Data Analysis
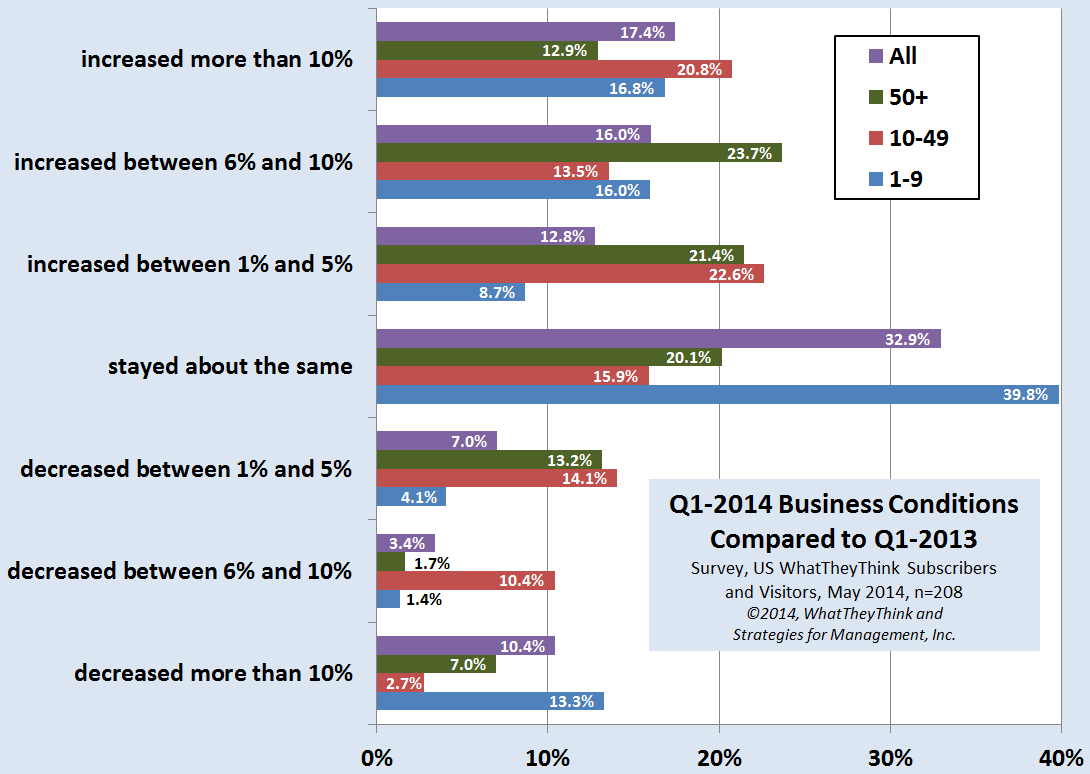
Q1-2014 Business Conditions Compared to Q1-2013
Published: May 29, 2014
Business conditions were generally good, with more than 33% reporting business increases of 6% or more. About 13% of respondents indicated business decreases of 6% or more Full Analysis
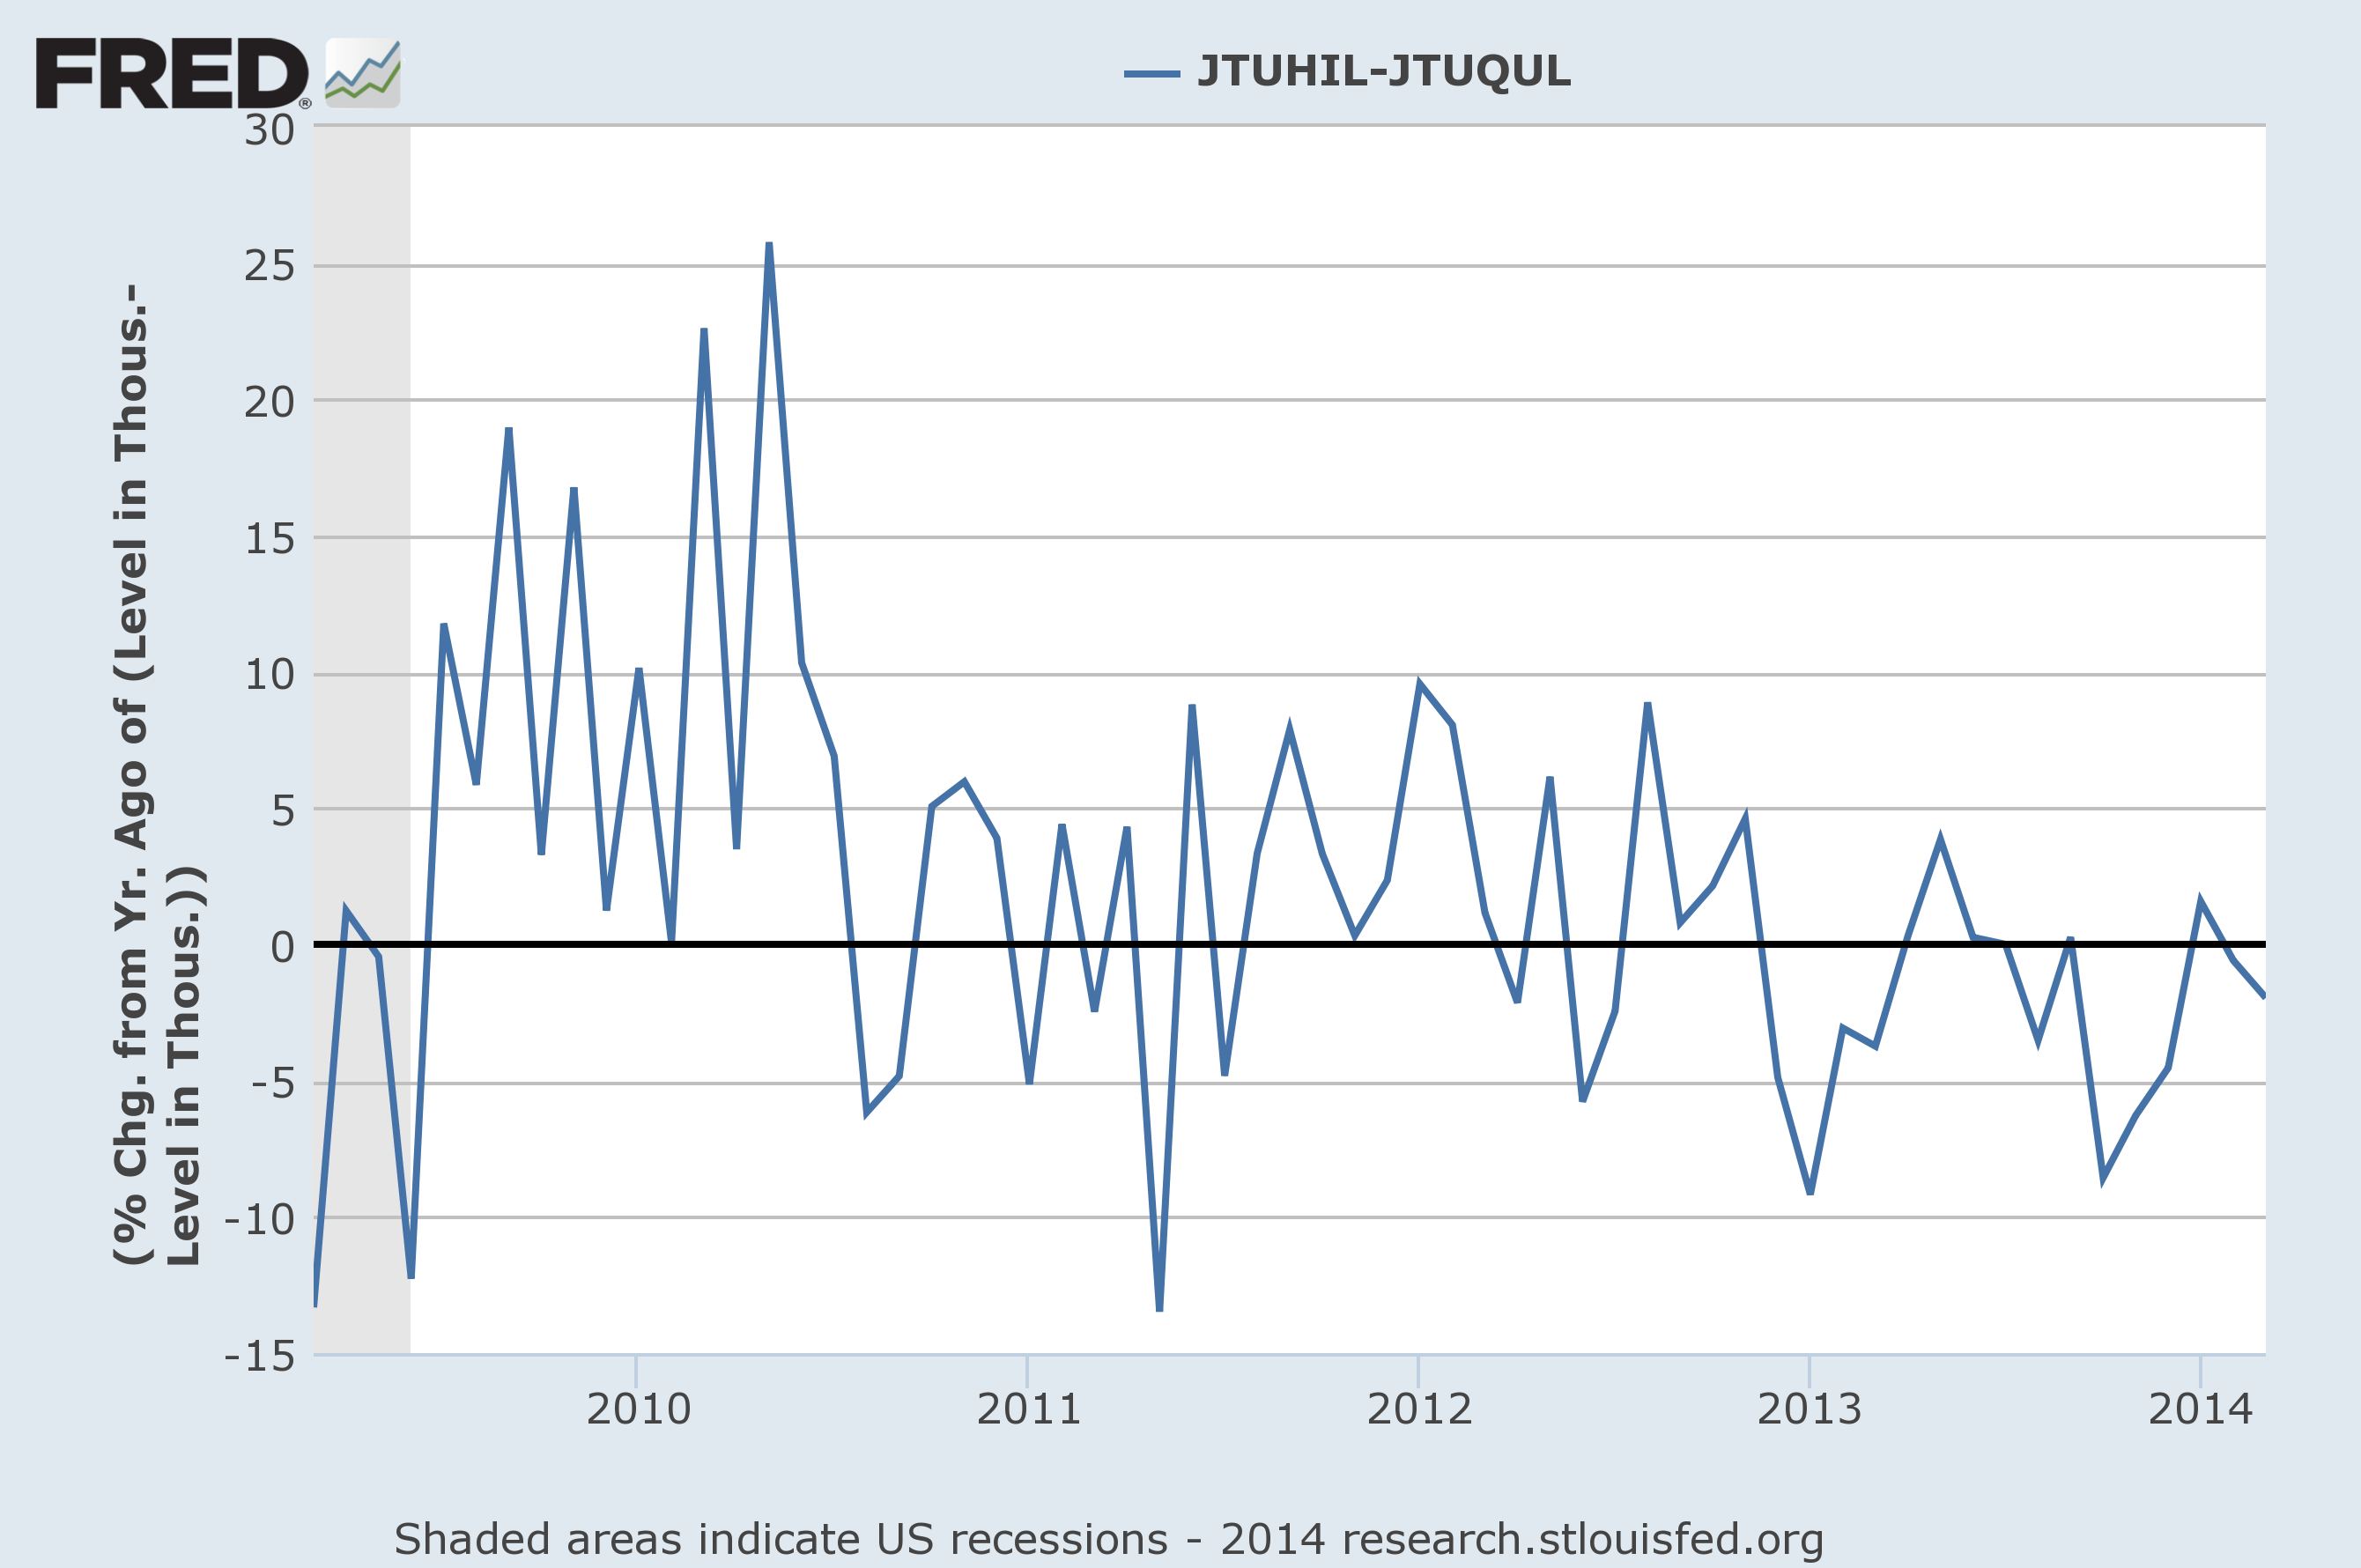
Labor Market Net Hiring Turns Negative
Published: May 15, 2014
US employment data has many cross-currents: the unemployment rate is down, but the labor participation rate is at 35-year lows. Last week the Bureau of Labor Statistics published its JOLTS report, which shows they dynamic factors at play in the labor market. This chart shows the percentage of hires less the number of quits on a year-to-year basis. Note in the chart below the rapid rise in employment as the recession ended and the recovery began, and also how it has narrowed and turned negative in recent months. It's been mainly negative for about 18 months. Full Analysis

Q1-2014 US Commercial Printing Shipments Down -4% Compared to 2013
Published: May 8, 2014
March 2013 US commercial printing shipments were down -$148 million (-2.2%) compared to 2012. The first quarter was down -$770 billion (-4%). On an inflation-adjusted basis, shipments were down -$270 million (-5.4%) and down -$1.05 billion (-5.4%) for the quarter. Full Analysis
Recovery Indicators Rebound; Q1-2014 GDP Below 1% but Corrects for Business Inventory Misjudgments
Published: May 8, 2014
The recovery indicators rebounded since last month. New orders for manufacturers remained at the same level that indicates growth. Full Analysis
April Printing Employment +1,000
Published: May 7, 2014
Printing employment in April rose by 1,000 workers. It is always hard to determine if these were actual workers or if the changes were the result of issues with the estimation models of the Bureau of Labor Statistics. Production workers were the greatest part of the increase (800). Full Analysis
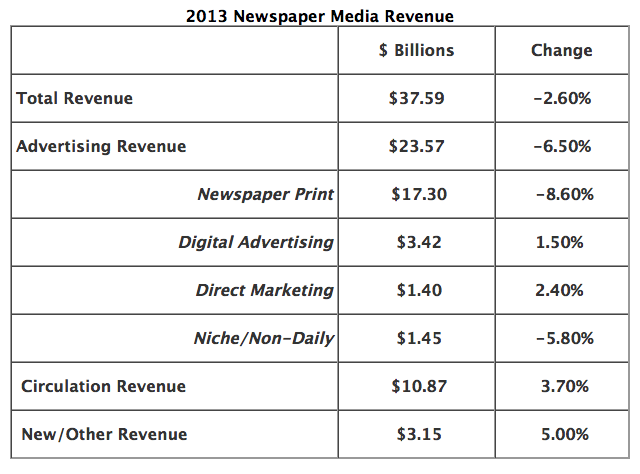
2013 Newspaper Revenue
Published: April 23, 2014
Circulation revenue for U.S. newspapers recorded a second consecutive year of growth, rising 3.7% to $10.87 billion in 2013 according to figures released by the Newspaper Association of America. Total revenue was $37.59 billion in 2013, a loss of 2.6 percent over 2012. Full Analysis
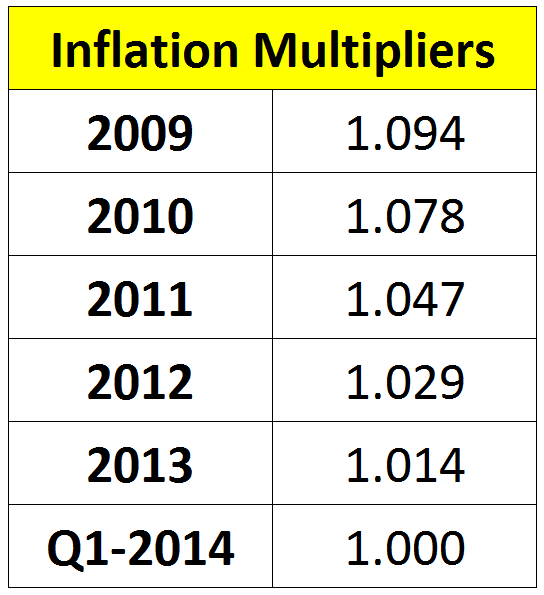
Table of Latest Inflation Multipliers
Published: April 23, 2014
Below is the latest set of multipliers based on the Consumer Price Index. Multiply your historical financial statements by the figures below to adjust data to the CPI for the first quarter of this year. Full Analysis
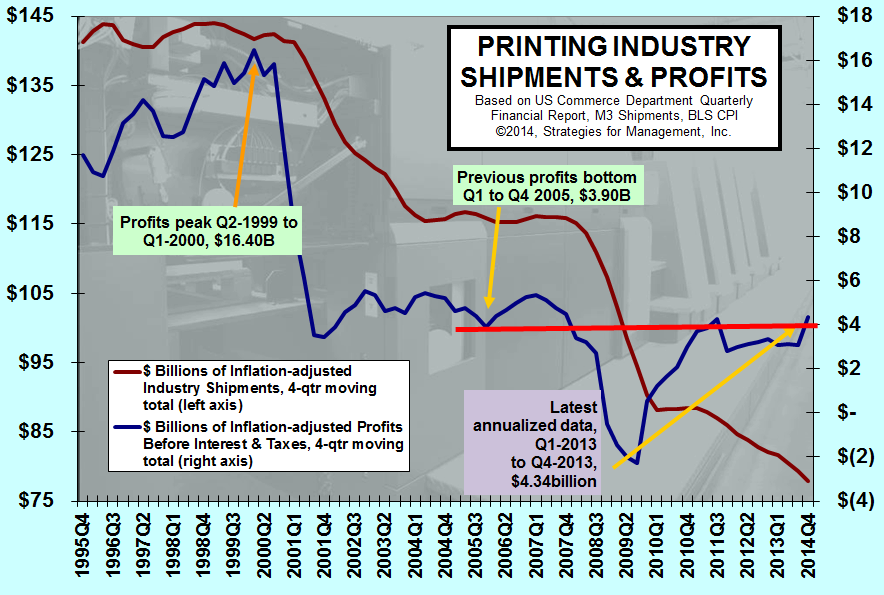
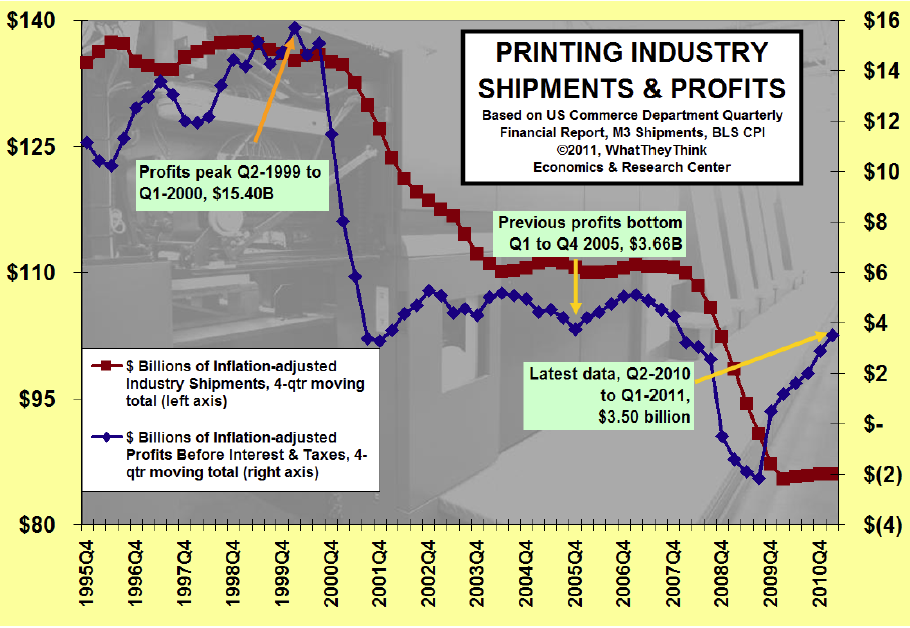
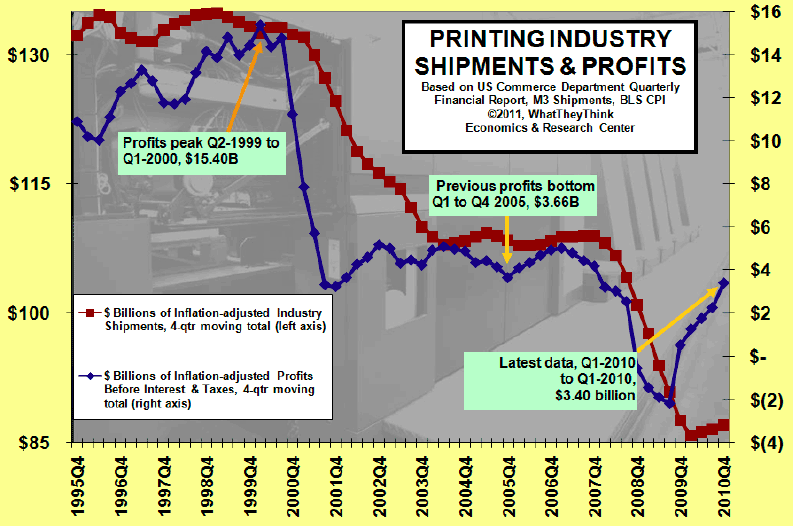
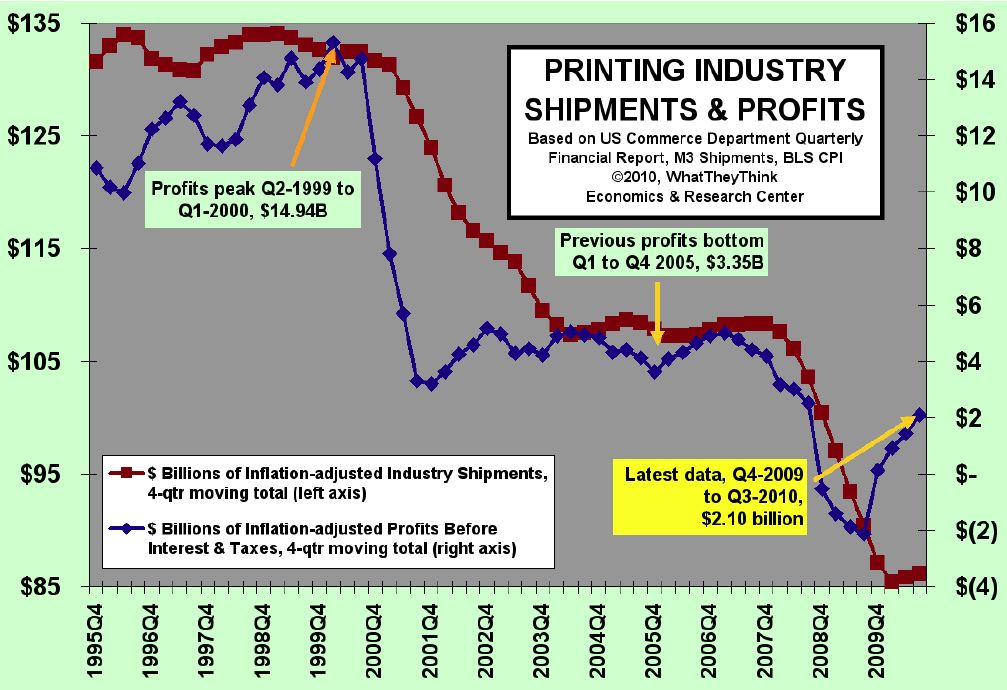
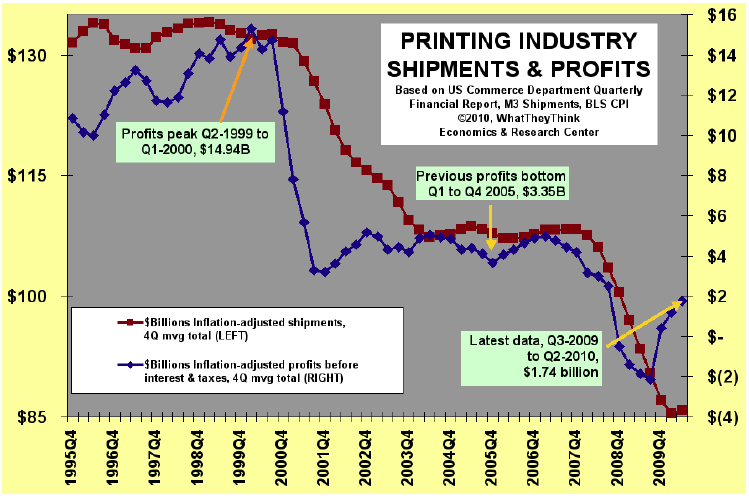
Printing Industry Shipments and Profits
Published: April 18, 2014
For the year, profits were $4.34 billion. On an inflation-adjusted basis, that was the highest level of industry profits since 2007. This is despite there being $28 billion less printing shipments, 8,000 fewer printing establishments, and 73,000 fewer employees. It was the best profits per establishment ($173,000) since 2000. Full Analysis
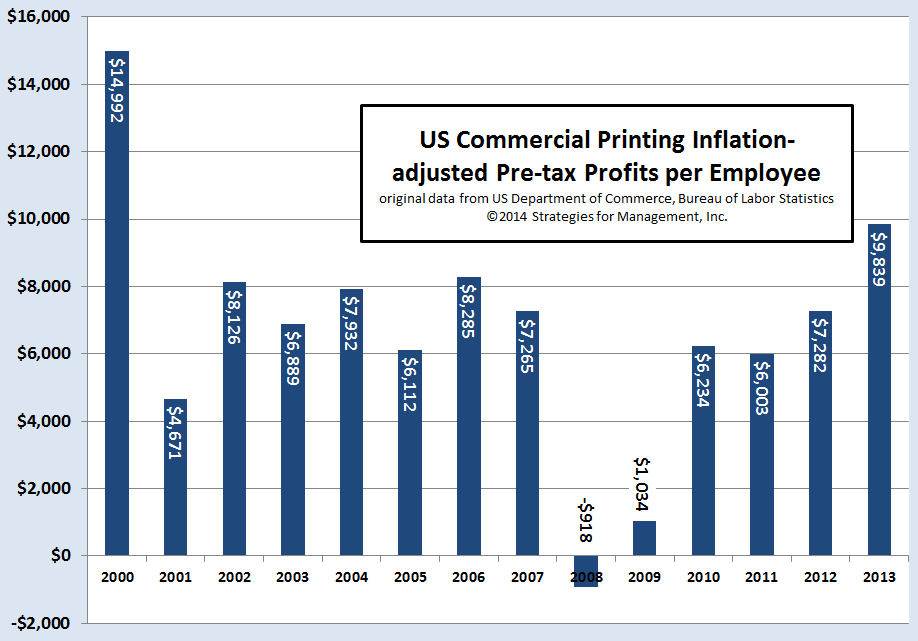
Printing Profits per Employee Rise
Published: April 17, 2014
Profits per employee increased to higher levels since 2000. Industry consolidation is a big factor in this report. It is not just mergers and acquisitions, but also plant closures and bankruptcies, and the opening of new businesses that absorb the best and most appropriate resources of the closed plants, and also the strategic changes that surviving companies make as they respond and anticipate marketplace changes, absorbing the sales volume of departed competitors. Full Analysis
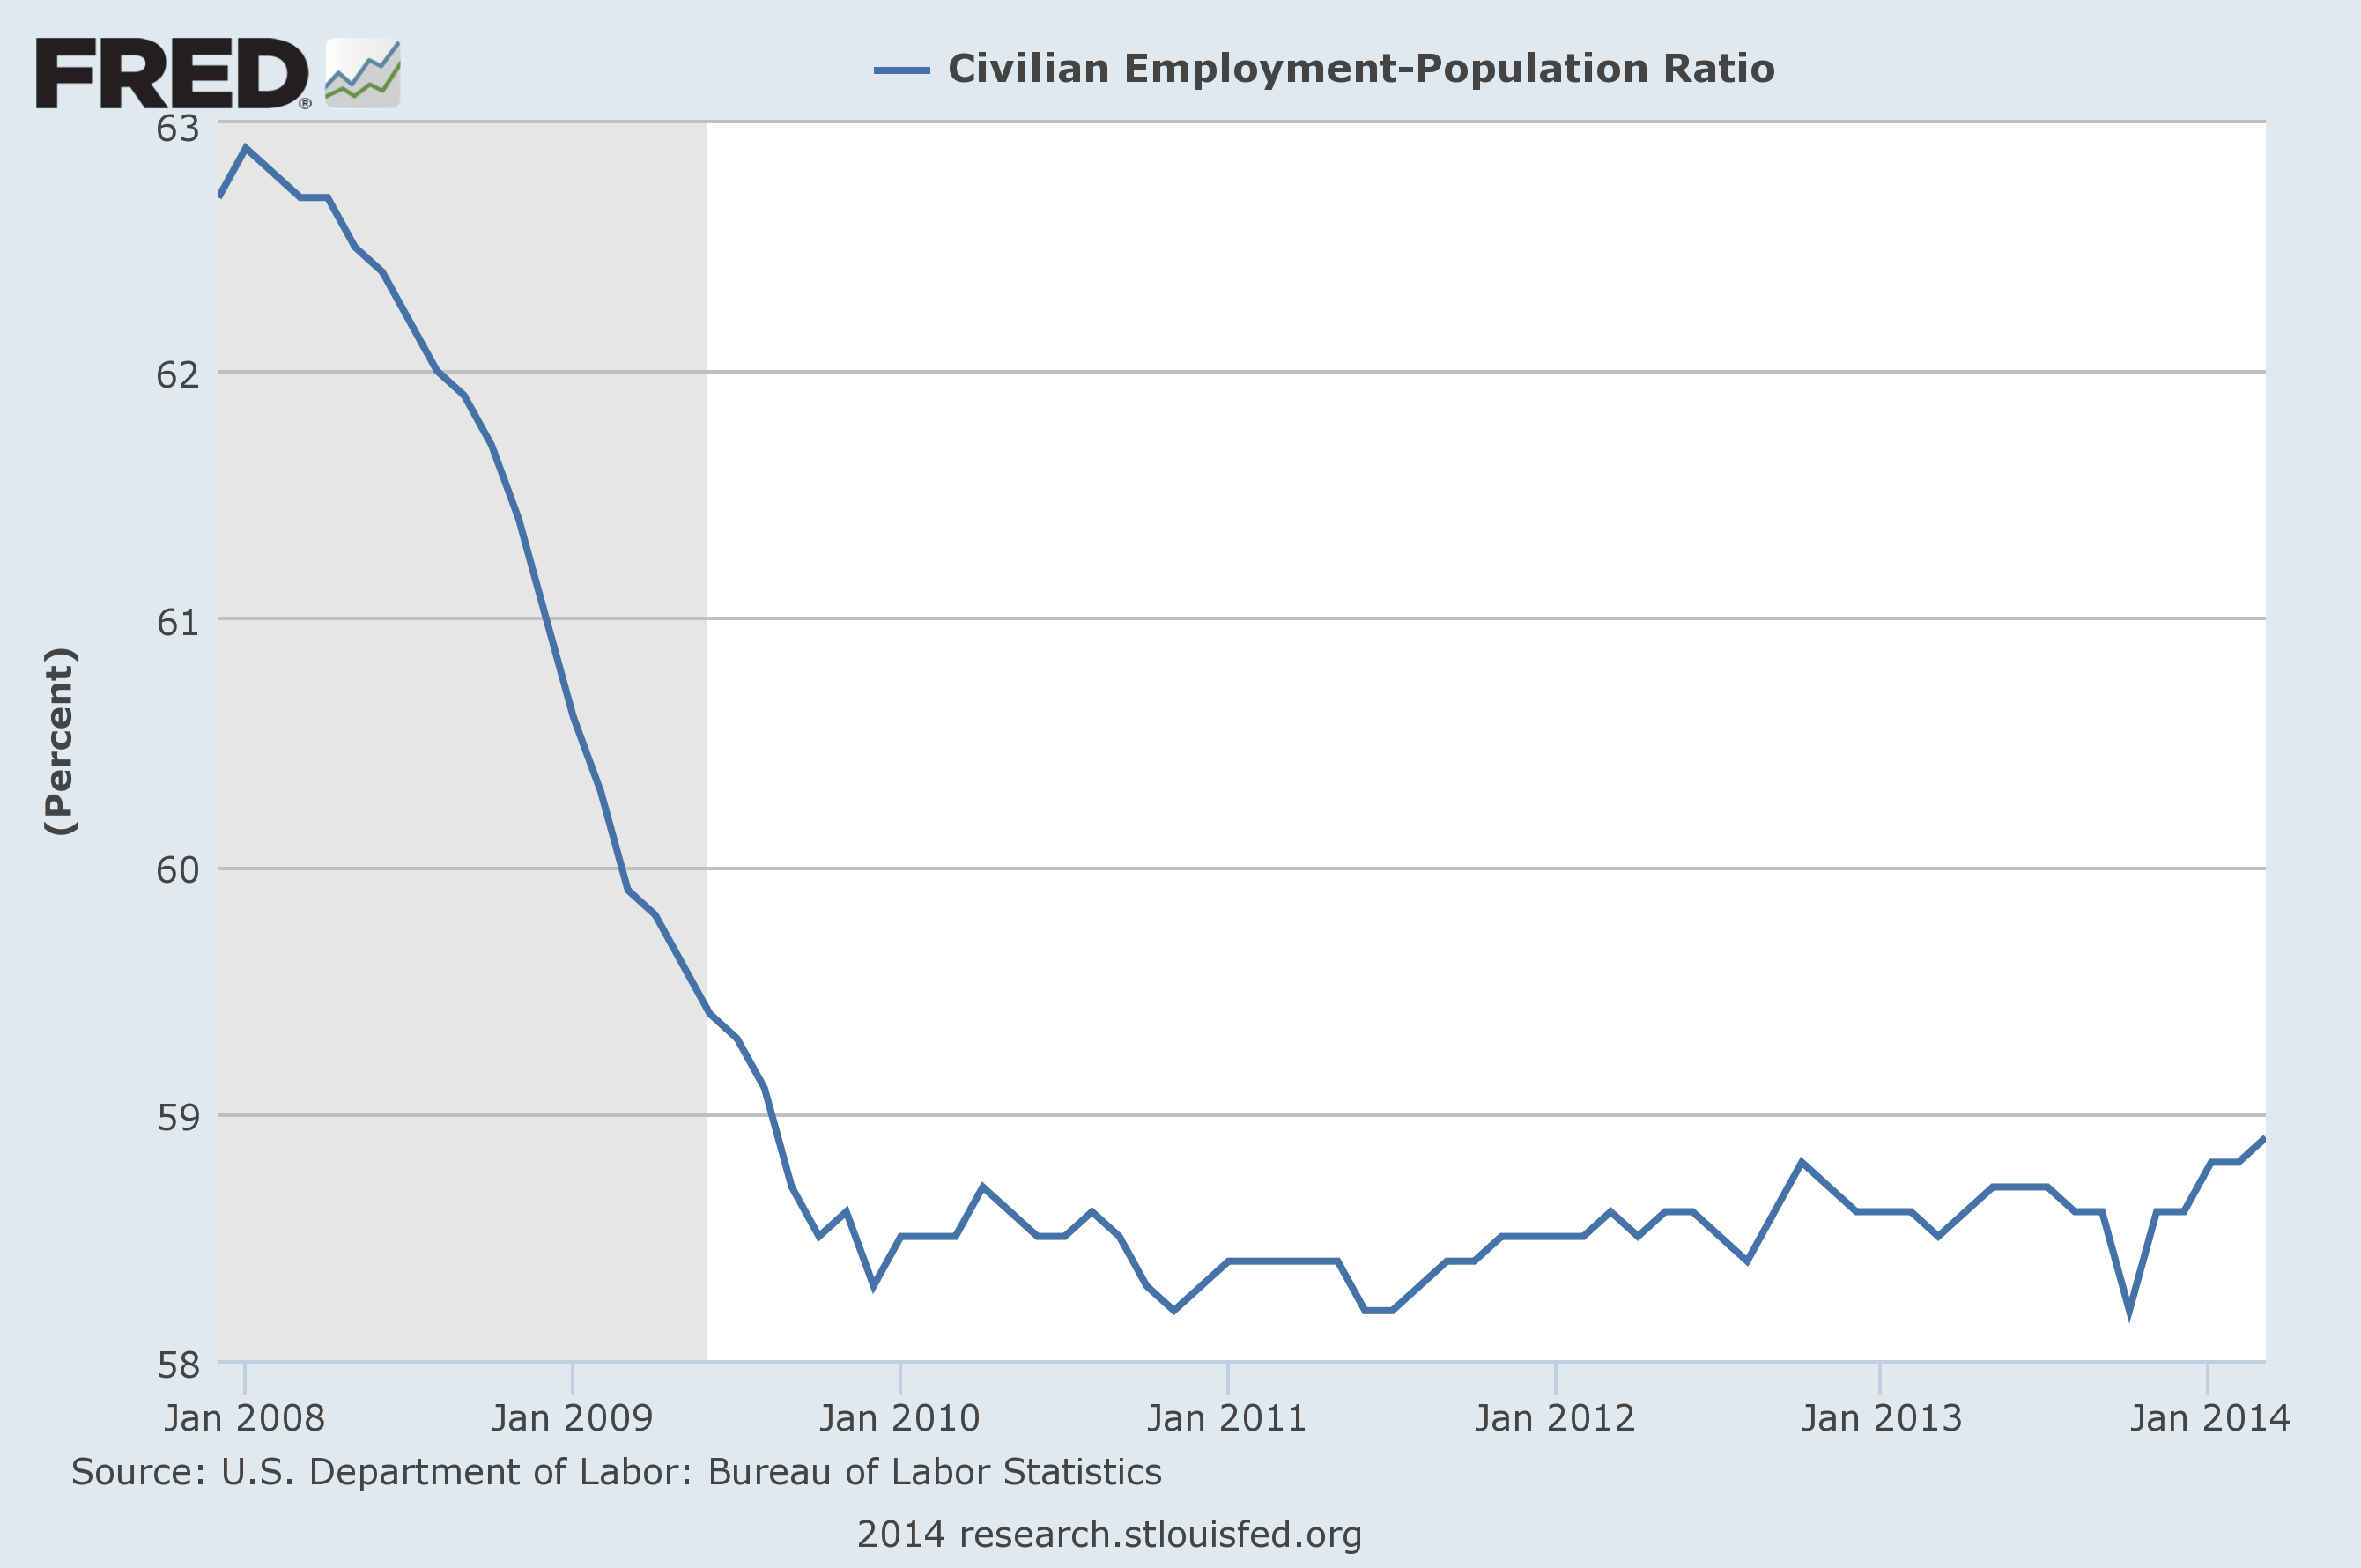
Employment-Population Ratio Still Below Pre-Recession Levels
Published: April 10, 2014
One of the measures of the health of the labor market is the comparison of the total population to civilian employment. This measure has yet to approach levels achieved prior to the recession. This measure is important because it follows the growth in population. The number of workers is now nearly what it was at the start of the recession, but population has grown about 6% since that time. In rough terms, this means that the economy is short about 5.6 million jobs. Full Analysis
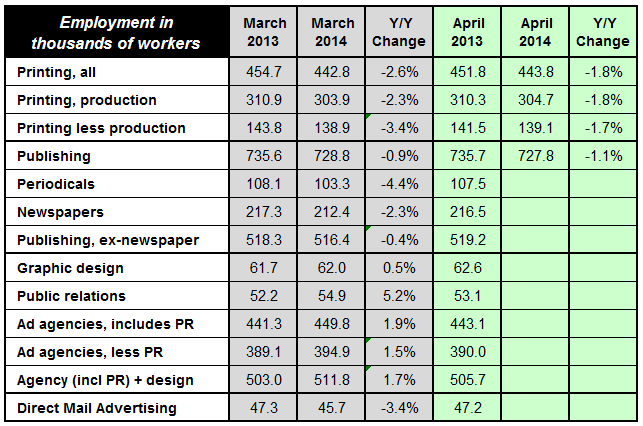
Employment Changes in the Printing and Content Creation Industries
Published: April 7, 2014
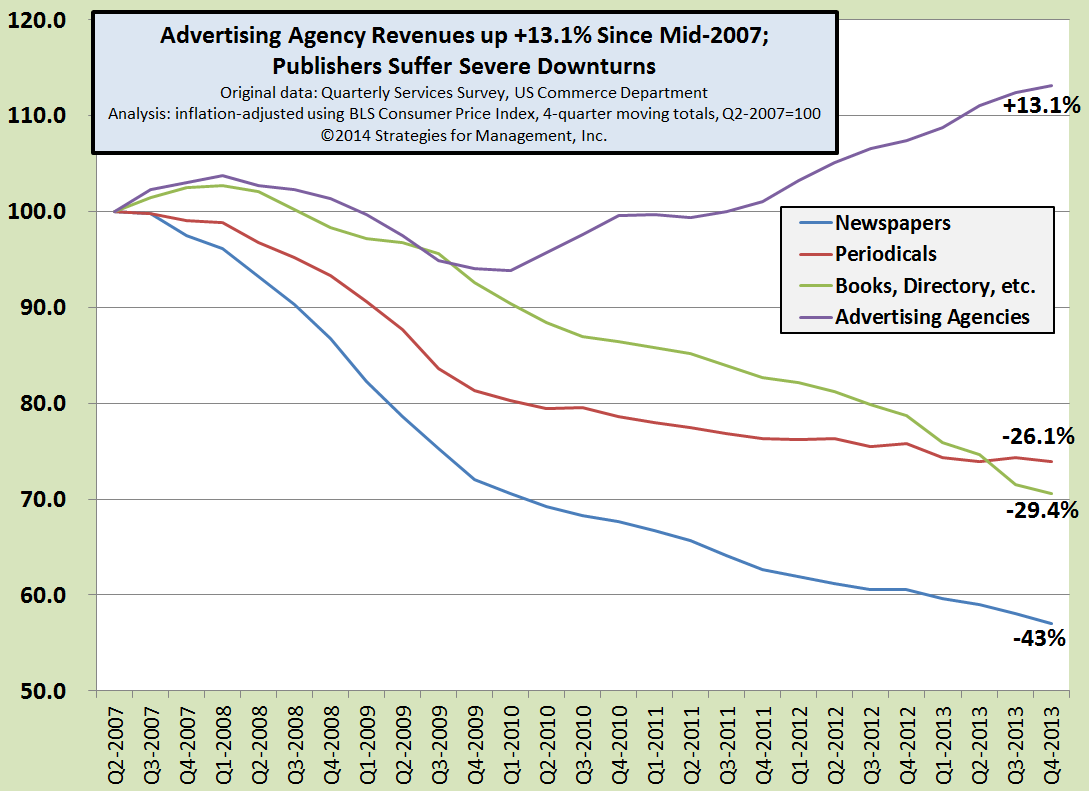
Ad Agency Revenues On Steady Rise Higher
Published: March 16, 2014
Since the second quarter of 2007, the first quarter for which we can create four-quarter inflation-adjusted moving totals, ad agency revenues are up more than 13%. Publishing industries have note fared well at all. Full Analysis

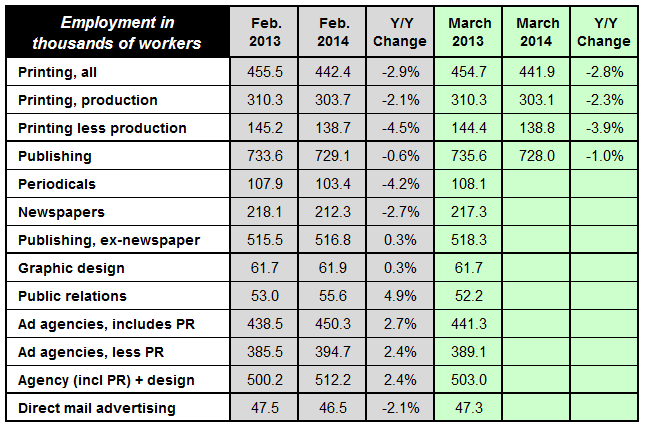
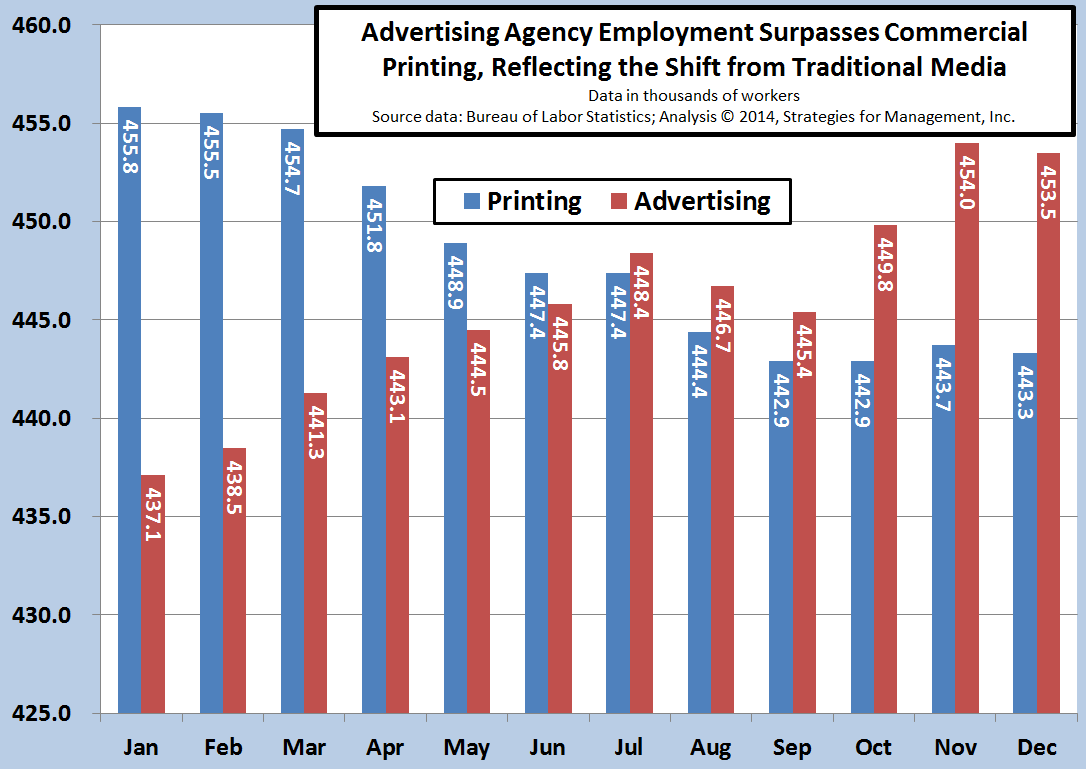
Advertising Agency Employment Surpasses Commercial Printing, Reflecting the Shift from Traditional Media
Published: February 7, 2014
The major news in the data update is that employment in advertising agencies surpassed that of the printing industry in July 2013. For 2013, printing employment was down by -12,600 (-2.8%). The biggest change was in employees outside of production who were -8,400 of that decline (-5.7%). Graphic design employment was down slightly for the year, but these data do not include freelancers, which are an essential part of that business. Inside the advertising agency employment data are public relations employees, the main area of employment growth in this sector. Full Analysis
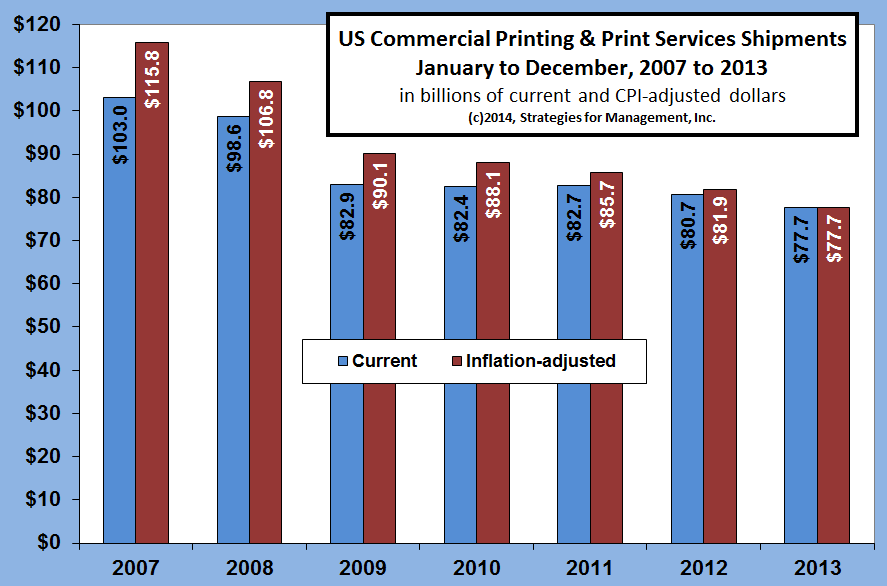
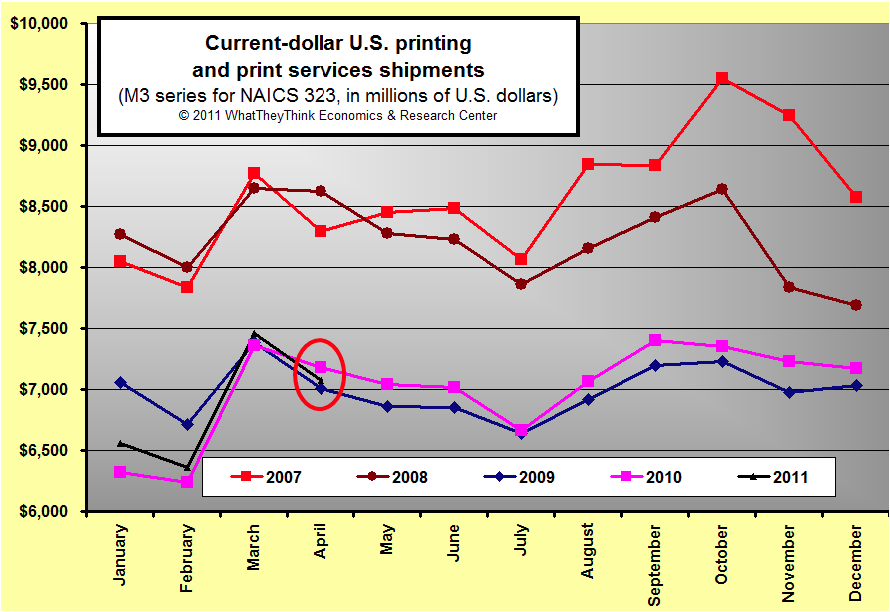
2013 US Commercial Printing Shipments Reach $77.6 Billion
Published: February 4, 2014
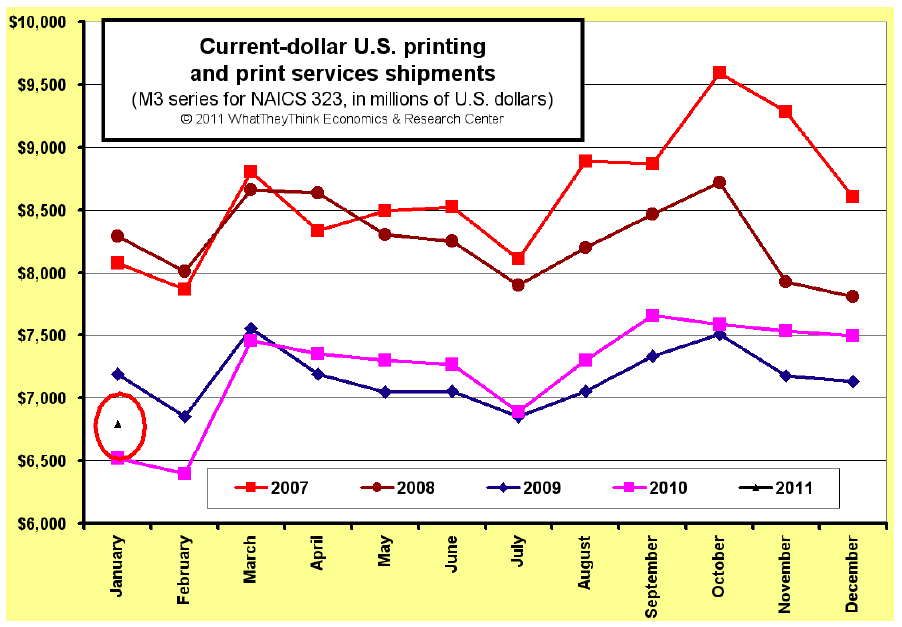
The Department of Commerce released December 2013 and revised November data. December shipments were $6.271B (-3.7% vs. Dec. 2012). On a current dollar basis, the total for the year was $77.6B, -3.8%. After adjusting for inflation using the Consumer Price Index, shipments were down -5.1%. The chart below shows current dollar and inflation-adjusted shipments starting with 2007 Full Analysis
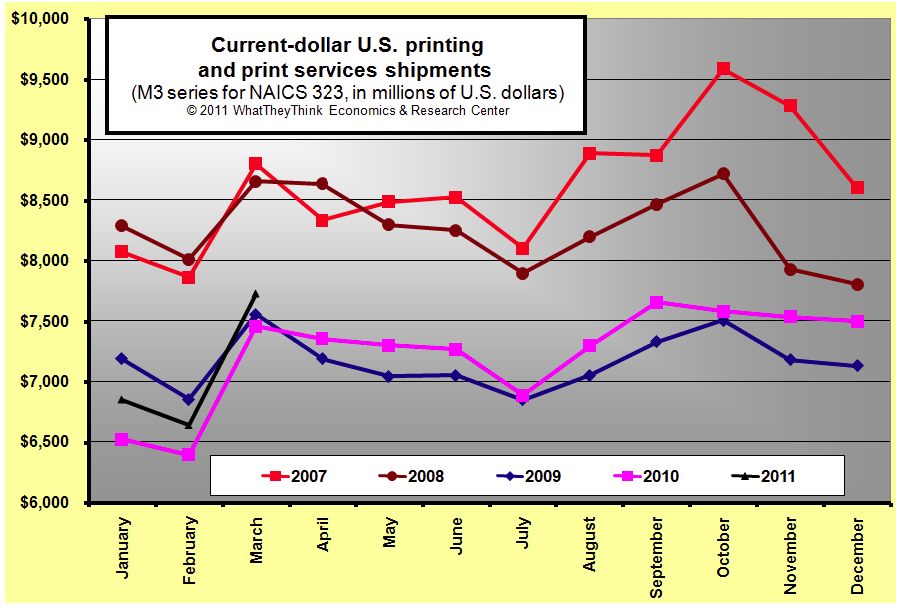
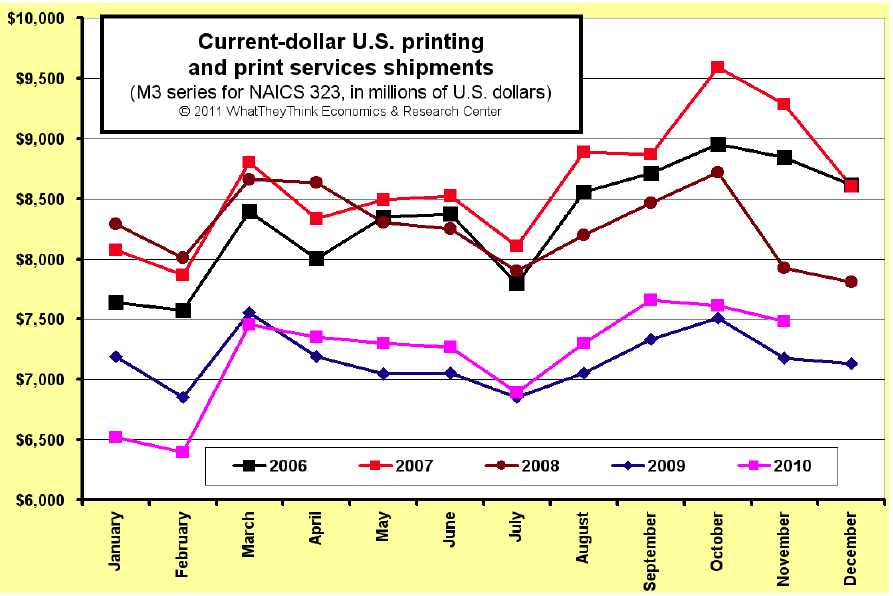
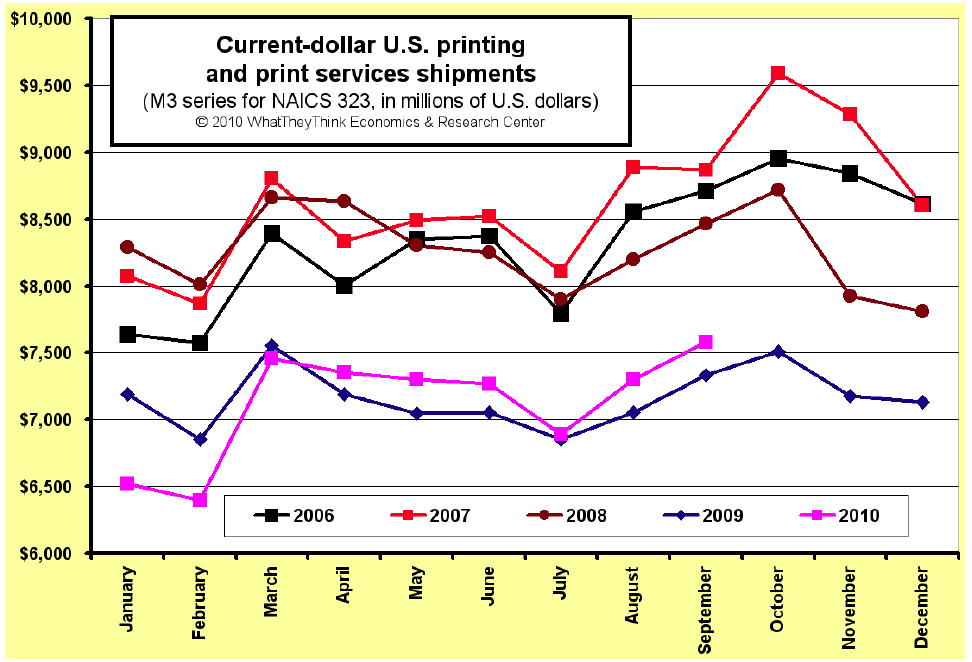
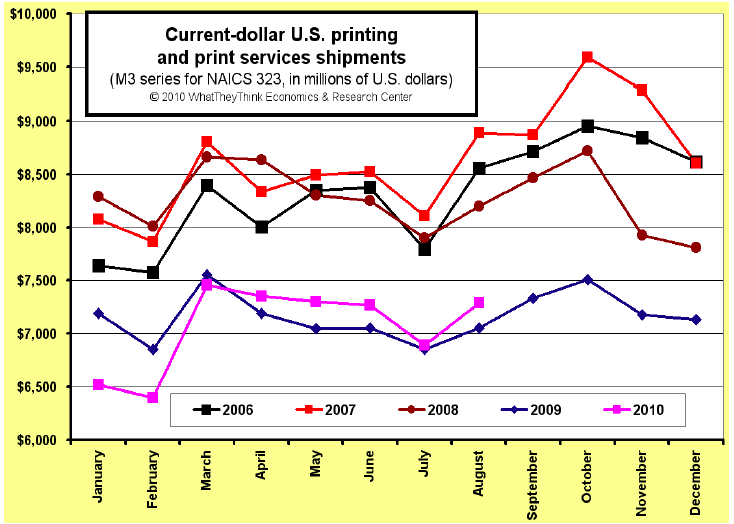
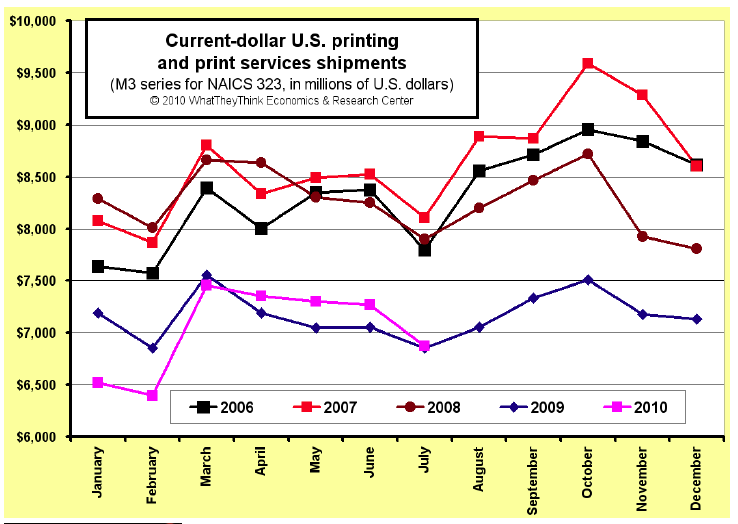
Inflation-adjusted US Printing and Print Services Shipments
Published: February 4, 2014
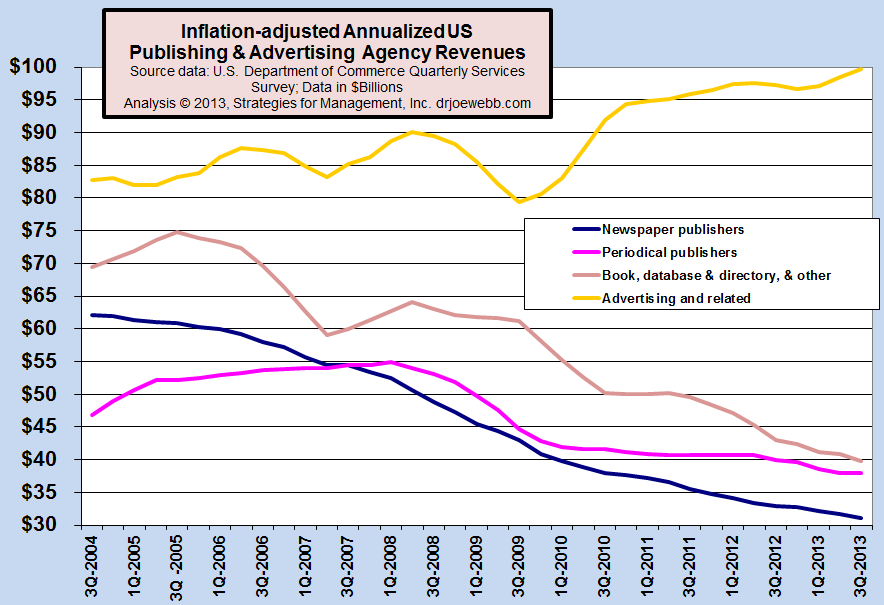
Inflation-adjusted Annualized US Publishing & Advertising Agency Revenues
Published: January 14, 2014
This chart shows the inflation-adjusted revenue trends for selected content-creation businesses. Note how advertising revenues have increased despite the declines in the revenues to publishers. Agencies have shifted much of their efforts to developing “earned media” (a/k/a search engines, social media, e-marketing and numerous other digital formats), and the production of it. Full Analysis
Six Consecutive Profitable Quarters for U.S. Commercial Printing Businesses
Published: June 15, 2011
The first quarter of 2011 continued a welcome continuation of profitability for the industry. The industry shakeout of unprofitable businesses, and the better management of healthier businesses continues to create an improved bottom line, but there are still great challenges ahead. The restructuring of the industry will be a continuing process in 2011 and beyond. Full Analysis
April 2011 U.S. Commercial Printing Shipments Down
Published: June 9, 2011
April 2011 commercial printing shipments were $7.08 billion, down -$109 million (-1.5%) compared to 2010. Adjusting for inflation, shipments were down -$366 million (-4.5%). Full Analysis
March 2011 U.S. Commercial Printing Shipments Up; Twelve Months of Increases
Published: May 6, 2011
March printing shipments were up, resulting in 12 consecutive months of increase. Dr. Webb explains how the easy comparisons to the prior year are about to end, and that the balance of 2011 will be about the same as 2010. He reviews the upcoming data revisions from the Commerce Department on May 13, the importance of inflation adjusting company financial data, and the shipment rates of Canada's commercial printing industry. Full Analysis
U.S. Commercial Printing Businesses Produce Estimated $1.11 Billion in Profits in Fourth Quarter 2010
Published: April 6, 2011
Dr. Joe Webb has compiled reports on US commercial printing profits going back to 1995, and brings it all current to Q4 2010. This report examines the latest trends in shipments, profits and capacity for the industry, of which the Federal Reserve just made revisions going back almost 25 years. How does Joe recommend printers steer the course? What will it take to get the print industry out of the hole? Dr. Webb has insights that can help. Full Analysis

February 2011 U.S. Commercial Printing Shipments Up +4.4%, Eleven Months of Y-O-Y Increases
Published: April 5, 2011
Dr. Webb looks at February's shipments, Canada's January shipments, and updated forecasts for the North American printing industry to 2017. There's an updated GDP Forecast model and commentary on why that model is not totally reliable for forecasting the print industry. Will the rest of 2011 be as positive as January and February? Dr. Joe discusses. Full Analysis
January 2011 U.S. Commercial Printing Shipments Up +4.1%, Good Start to New Year
Published: March 10, 2011
Dr. Webb comments on what the forecasting models are projecting for shipments out to 2017. The podcast also includes an analysis of how the industry has changed between 2000 and 2009 based on the latest data from the Commerce Department. Full Analysis
2010 U.S. Commercial Printing Shipments Finish at $86.7 Billion, +0.9% Versus 2009
Published: February 4, 2011
December 2010 commercial printing shipments were $7.48 billion, up $347 million (+4.9%) compared to 2009. Adjusting for inflation, shipments were up +3.3%. This brought the year's shipments to $86.7 billion. Full Analysis
November U.S. Commercial Printing Shipments Up +4.2%
Published: January 19, 2011
November 2010 commercial printing shipments were $7.48 billion, up $303 million (+4.2%) compared to 2009. Adjusting for inflation, shipments were up +4.2%. “This was a very encouraging month, and continues the consecutive gain in current dollar shipments for eight months,” explained Dr. Joe Webb, director of WhatTheyThink's Economics and Research Center. Full Analysis
U.S. Commercial Printing Businesses Produce Estimated $1.1 Billion in Profits in Third Quarter 2010
Published: December 14, 2010
The third quarter of 2010 continued a welcome continuation of profitability for the industry. It has had seven consecutive months of increased sales, but it's clear that the profits trend is increasing, but the long term sales trend is flat. Full Analysis

October U.S. Commercial Printing Shipments Up +1.4%
Published: December 6, 2010
October 2010 commercial printing shipments were $7.61 billion, up $108 million (+1.4%) compared to 2009. Adjusting for inflation, shipments were up +0.3%. Full Analysis
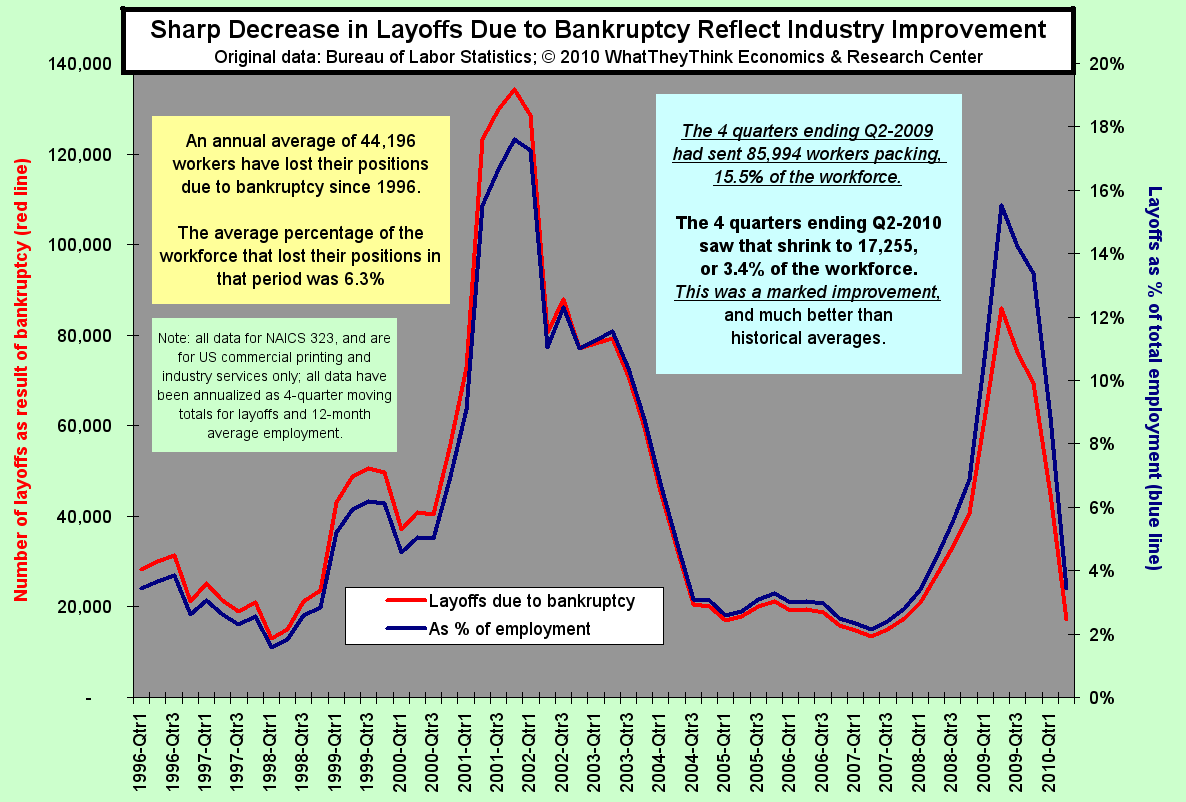
Sharp Decrease in Layoffs Due to Bankruptcy Reflect Industry Improvement
Published: November 15, 2010
Even something that sounds bad, like the number of printing industry layoffs due to bankruptcy, can be good if they're declining. Dr. Joe explains the sharp decline in the last four quarters and why it's very good news. Full Analysis
September U.S. Commercial Printing Shipments Up +3.4%; Six Consecutive Months of Growth Versus 2009
Published: November 4, 2010
September 2010 commercial printing shipments were $7.58 billion, up $248 million (+3.4%) compared to 2009. Adjusting for inflation, shipments were up +2.2%. “This continues the consecutive gain in current dollar shipments for six months, a welcome change for commercial printers,” explained Dr. Joe Webb, director of WhatTheyThink's Economics and Research Center. Full Analysis
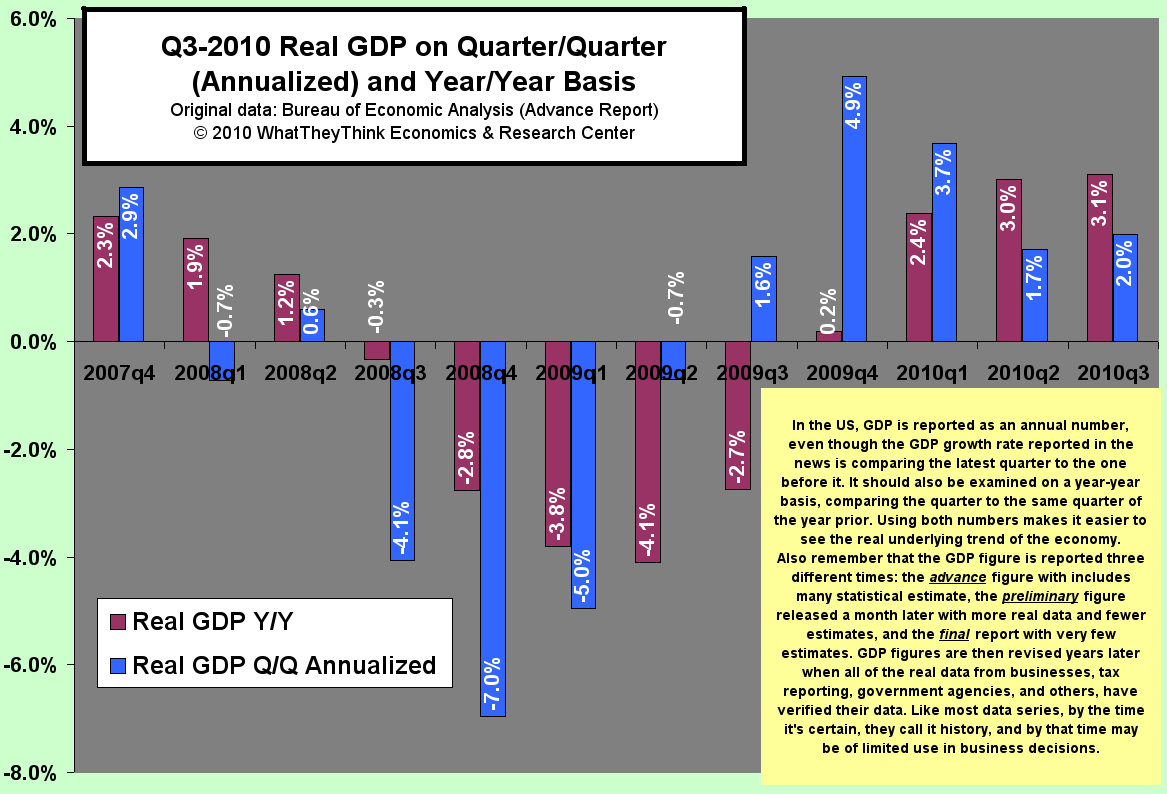
Q3 2010 Real GDP on Quarter/Quarter and Year/Year Basis
Published: November 1, 2010
Dr. Joe looks at the advance report for GDP in 2010's third quarter and explains what it means, what it doesn't, and why it might be worth ignoring. Full Analysis
Change in Commercial Printing Segments 1997-2008
Published: October 18, 2010
Dr. Joe updates his look at the recent trends in printing industry employment and the last five months of increased sales are playing out. Full Analysis
August U.S. Commercial Printing Shipments Up +3.3%
Published: October 11, 2010
August 2010 commercial printing shipments were $7.3 billion, up $235 million (+3.3%) compared to 2009. Adjusting for inflation, shipments were up +2.2. Full Analysis
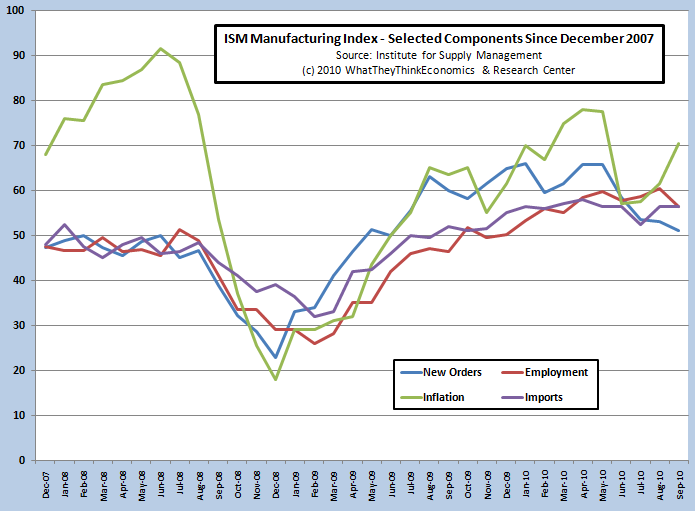
ISM Manufacturing Index - Selected Components Since December 2007
Published: October 4, 2010
Dr. Joe explains the latest Institute for Supply Management manufacturing report in terms of its key components of new orders, prices paid, employment, and imports. The manufacturing side of the economy is still growing, but it looks like it's slowing down, and inflation is starting to creep into the system. Full Analysis
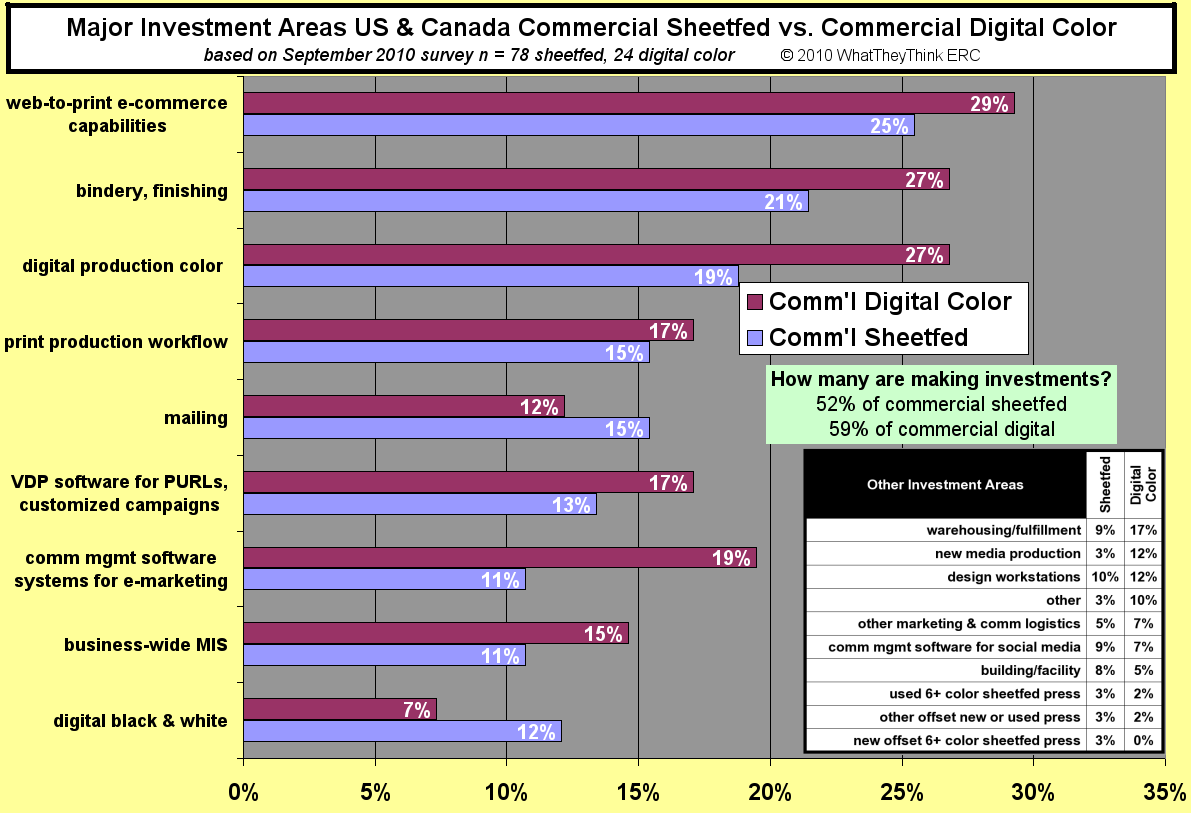
Major Investment Areas Commerical Sheetfed vs. Commercial Digital Color
Published: September 20, 2010
As we head into GraphExpo, what does our latest survey show that commercial sheetfed and commercial color digital printers are looking for? Dr. Joe explains it all Full Analysis
U.S. Commercial Printing Businesses Produce Estimated $1.1 Billion in Profits in Second Quarter 2010
Published: September 15, 2010
The second quarter of 2010 continued a welcome continuation of mild profitability for the industry. Much of the industry is still recovering from a very difficult 2009, and two quarters of profits can't really make up for that. But we're on the right track, even though there are still challenges ahead. Full Analysis
July U.S. Commercial Printing Shipments Up +0.3%
Published: September 7, 2010
July 2010 commercial printing shipments were $6.87 billion, up $18 million (+0.3%) compared to 2009. Adjusting for inflation, shipments were down -1%. This continues the consecutive gain in current dollar shipments for four months, the first time we have had a period of that extent since November 2007. Full Analysis
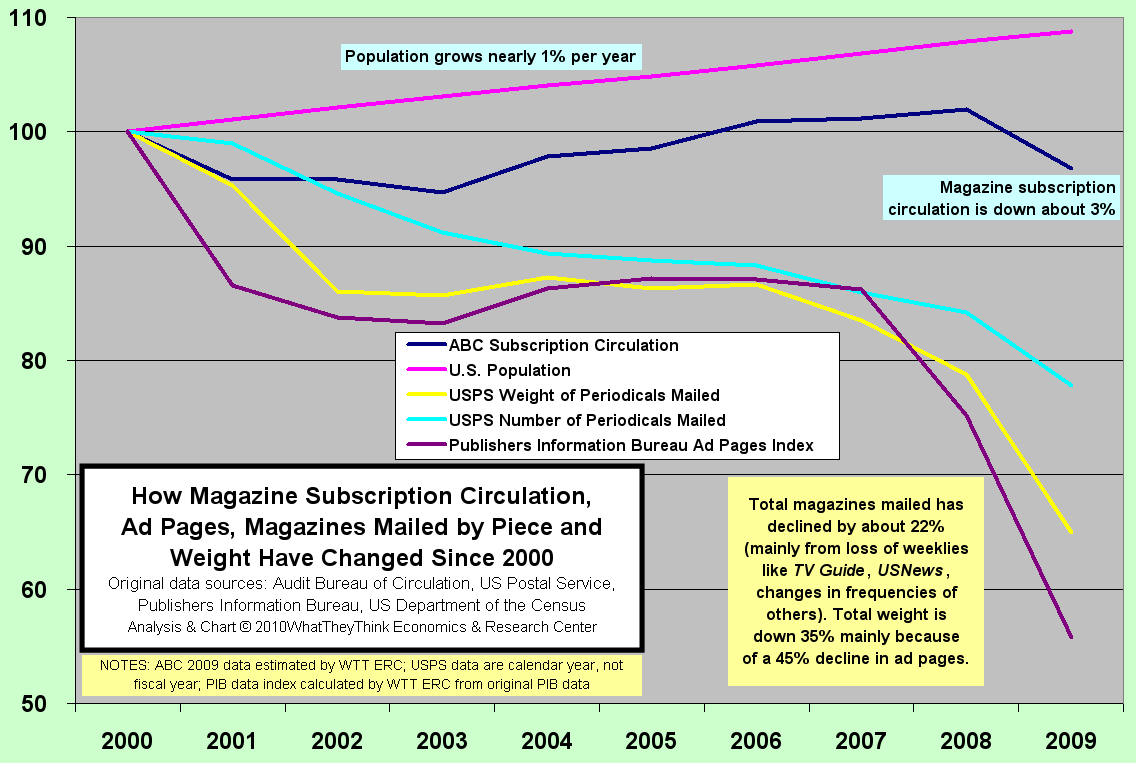
How magazine circulation, ad pages and mailed by piece has changed since 2000
Published: August 16, 2010
How have magazines changed over the last 10 years? Dr. Joe looks at subscription circulation, ad pages, postal shipments and weight, and what they tell us about this critical segment of our industry. Full Analysis
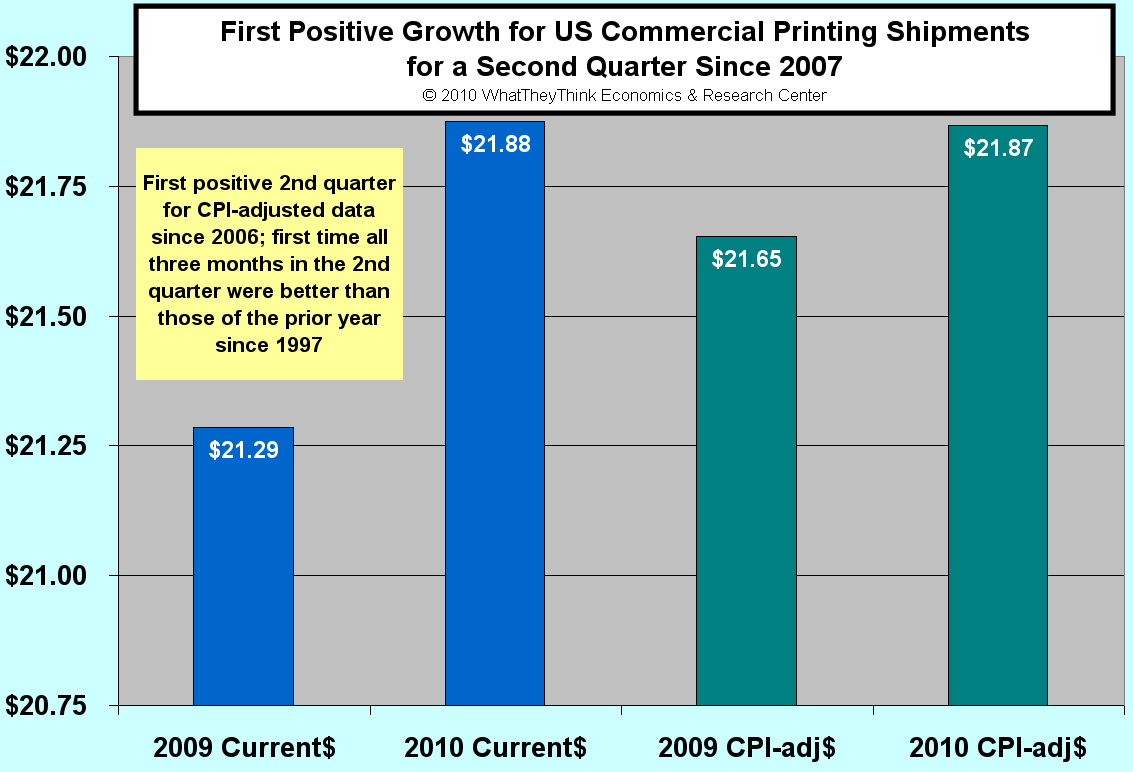
Second Quarter U.S. Commercial Printing Shipments Up +2.8%
Published: August 3, 2010
June 2010 commercial printing shipments were $7.2 billion, up +2.4% compared to 2009. Adjusting for inflation, shipments were up +1.3%. “This is the first three month gain in shipments on an inflation-adjusted basis since the period of October 2006 through April 2007. Full Analysis
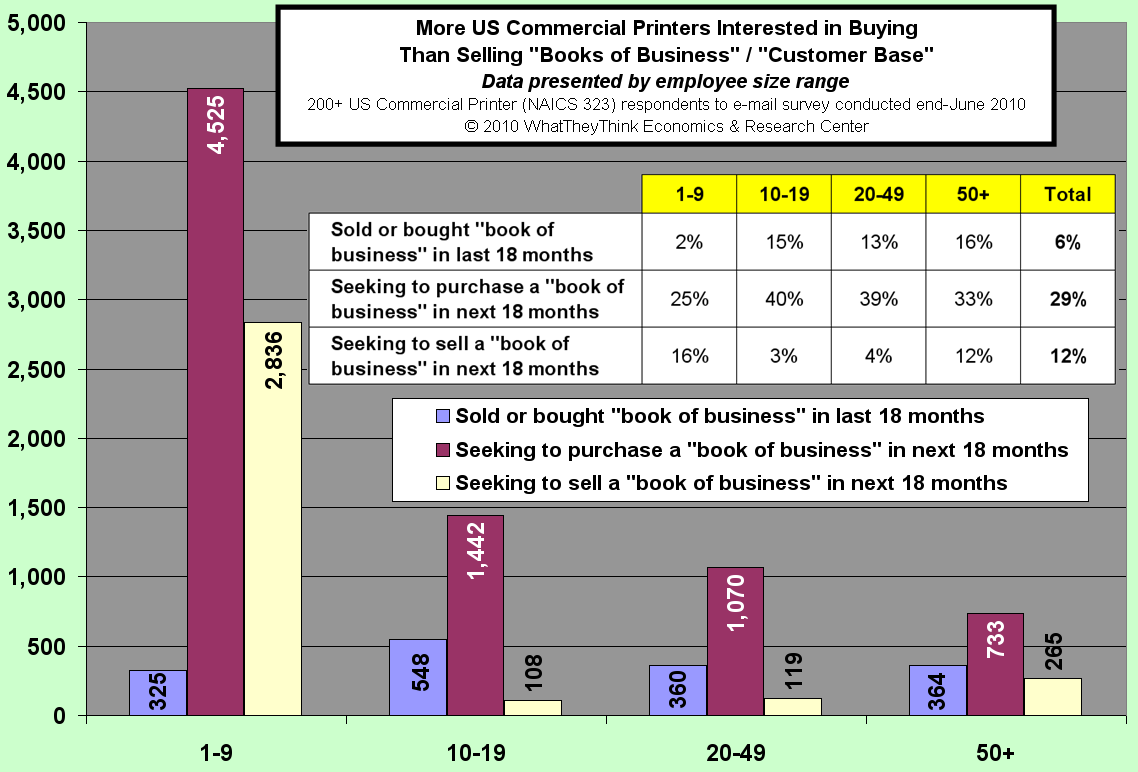
More printers interested in buying than selling books of business customer base
Published: August 2, 2010
Who's buying and who's selling? The print business has been consolidating, and we're certain there is more to go, especially with the popularity of "tuck-ins." Dr. Joe explains why "tuck-ins" are not about what you should do with your shirt, but how it has slowly been creating a more efficient industry. Full Analysis
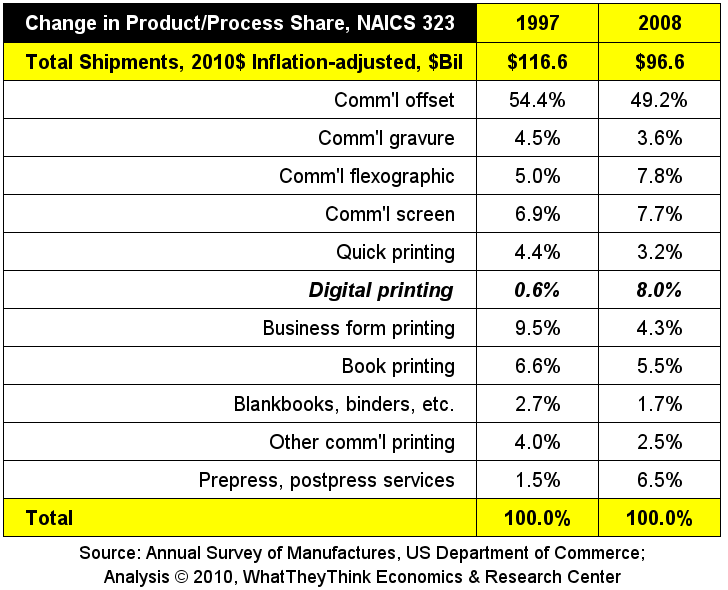
Change in Commerical Printing Segments 1997-2008
Published: July 19, 2010
Dr. Joe discusses how commercial printing segments have changed their share of industry shipments from 1997 through 2008, and why digital printing's share might be even larger than the data indicate. Full Analysis
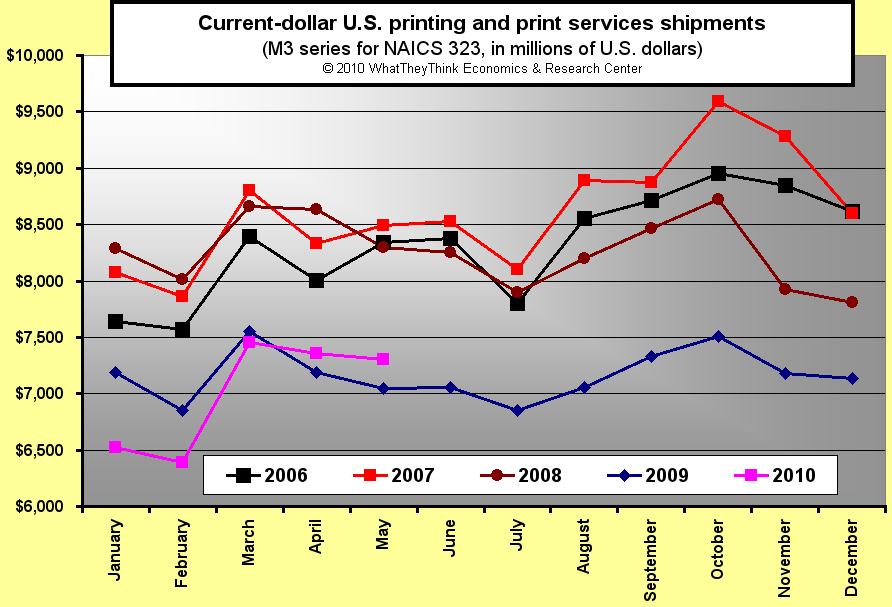
May U.S. Commercial Printing Shipments Up +3.6%
Published: July 6, 2010
May's shipments were up compared to 2009, and April's were revised significantly upward. This is the first time since early 2008 that the industry produced two consecutive months with shipment increases. For complete details see this month's printing shipments report. Full Analysis
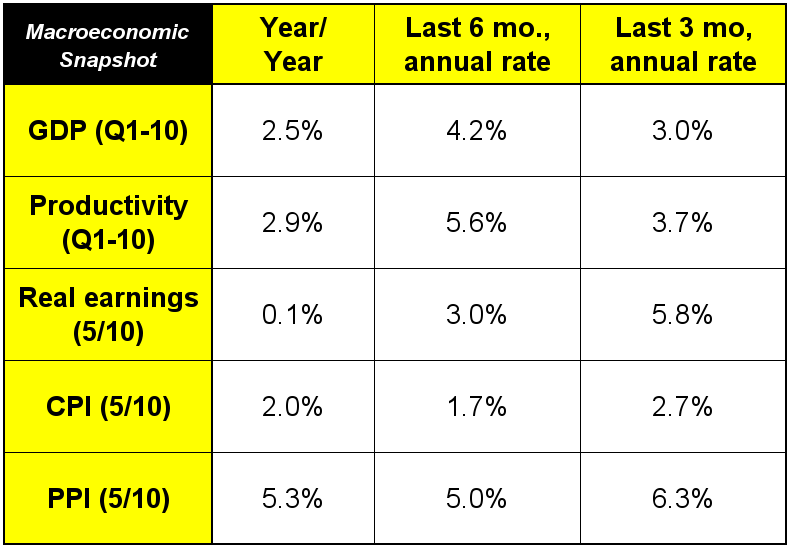
Dr. Joe reviews the latest economic data
Published: June 21, 2010
Dr. Joe reviews the latest economic data and explains where we're headed for the third and fourth quarters and why. Full Analysis
April 2010 commercial printing shipments
Published: June 7, 2010
April 2010 commercial printing shipments were $7.05 billion, down -1.9% compared to 2009. Adjusting for inflation, shipments were down -4.1%. For the first four months of 2010, shipments were down -4.7% on a current dollar basis. Full Analysis
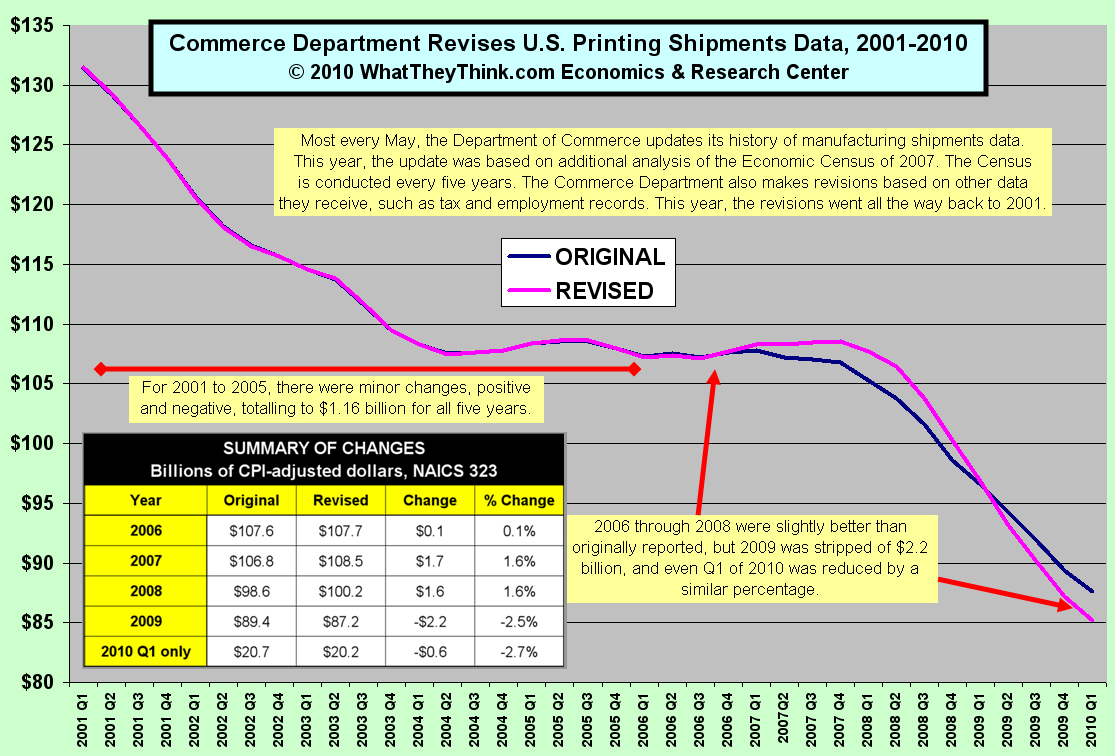
Commerce Department Revises Printing Shipments Data
Published: May 17, 2010
The Department of Commerce revised almost 10 years of printing industry shipments data last week. The WhatTheyThink economic data elves dug into the data and explain what those revisions mean, what years were revised up, and which ones were revised down. Full Analysis
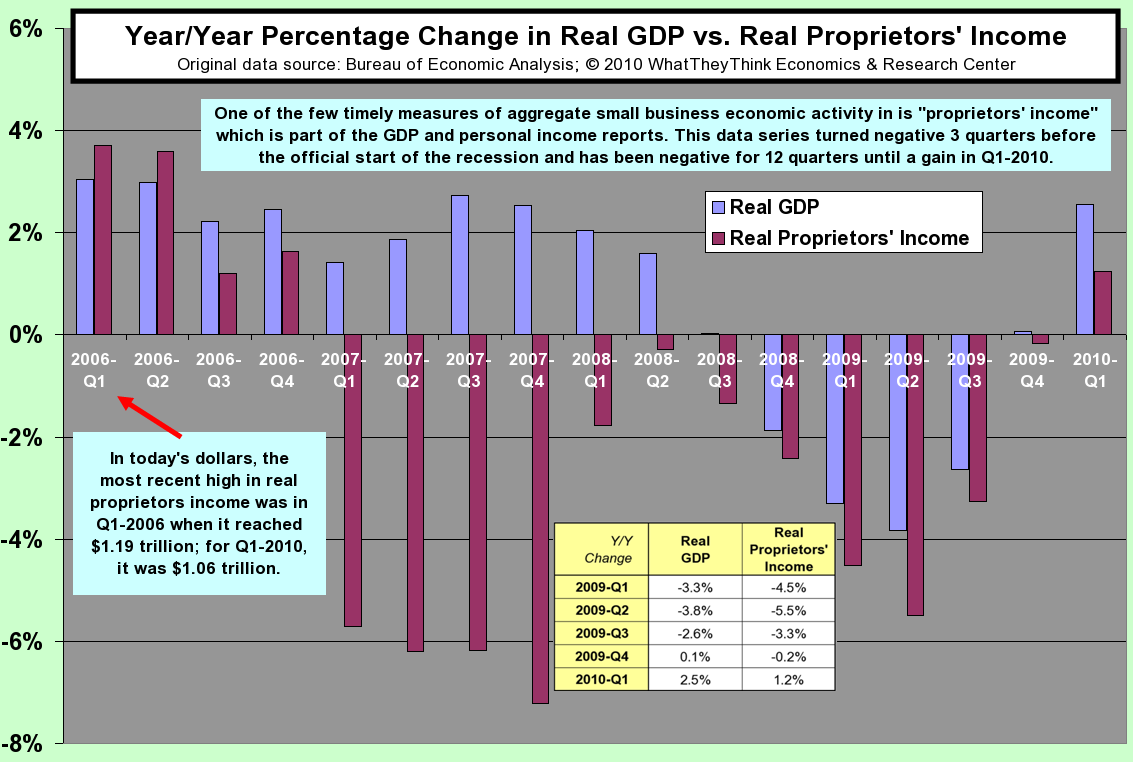
Year/Year Changes in Real GDP vs. Real Proprietors Income
Published: May 3, 2010
The first quarter GDP showed that the economy is growing, but that was compared to the fourth quarter. How is GDP changing on a year-to-year comparison? The GDP data are about the whole economy, but how is small business doing? Dr. Joe explains how a rarely reported part of the quarterly GDP data helps us judge the health of small businesses. Full Analysis
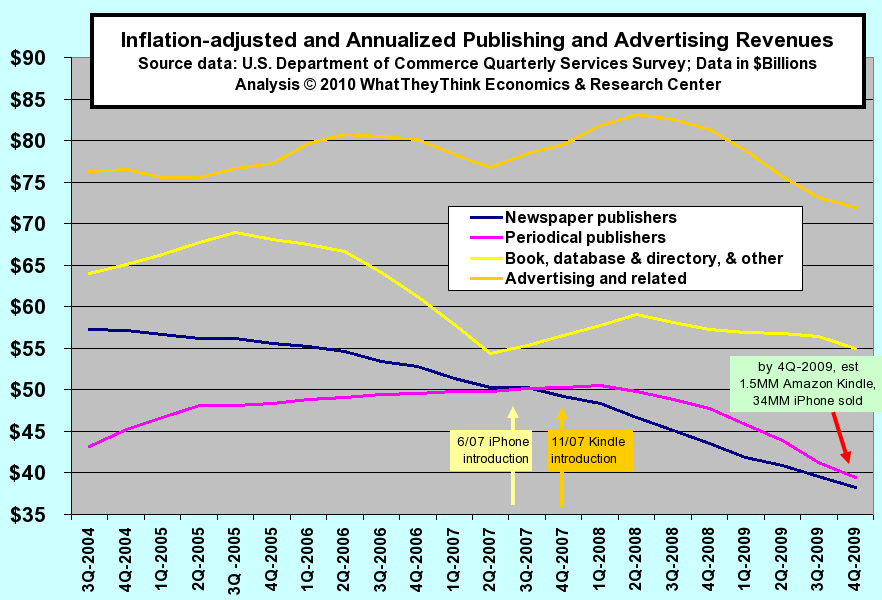
Inflation-adjusted and Annualized Publishing and Advertising Revenues
Published: April 19, 2010
The trends in industry revenues of advertising and publishing sectors each tell an interesting story. They get more interesting once iPhones, Kindles, and iPads are added to the mix. Dr. Joe explains it all, but may have more questions than answers, which might spell opportunities for print businesses. Full Analysis
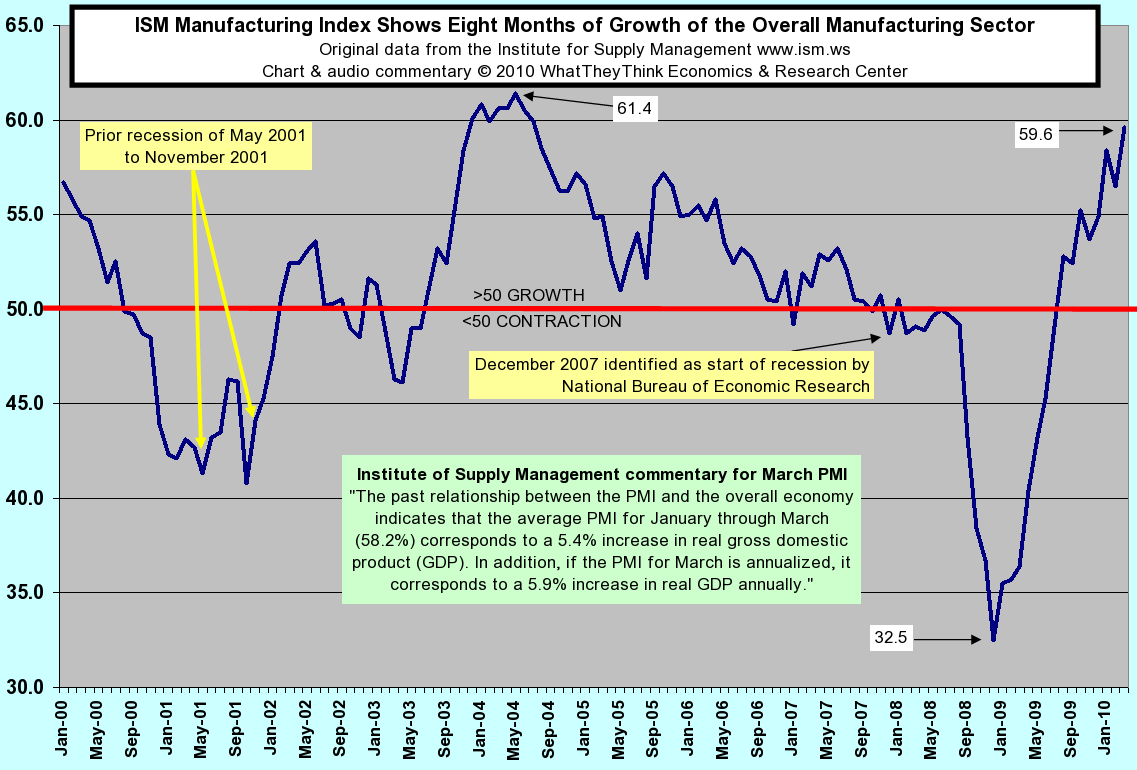
ISM Manufacturing Index Shows Eight Months of Growth
Published: April 5, 2010
The ISM Manufacturing Index is one of the most watched economic indicators. It's up for 8 consecutive months, and the latest release was one of the strongest of this decade. Dr. Joe gives some background and explains what this latest reading means. Full Analysis
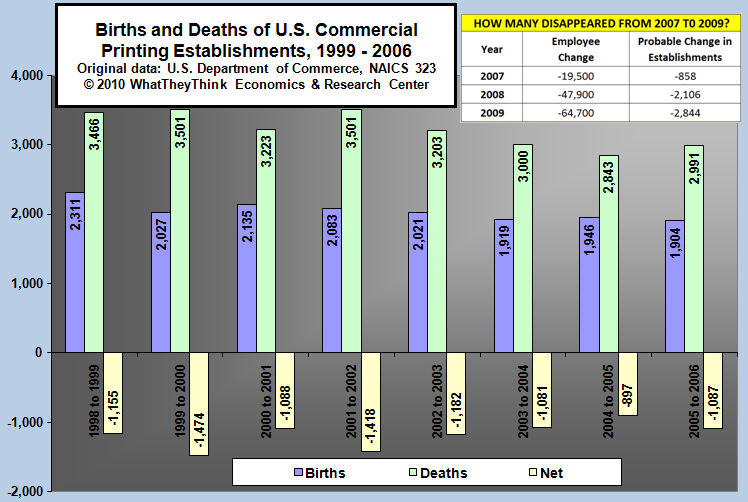
As The Industry Churns
Published: March 15, 2010
The Census Bureau publishes printing industry births and deaths data, but the data take years to be published. The latest data are from 2006, but Dr. Joe estimates what's happened since,especially 2008 and 2009. Full Analysis
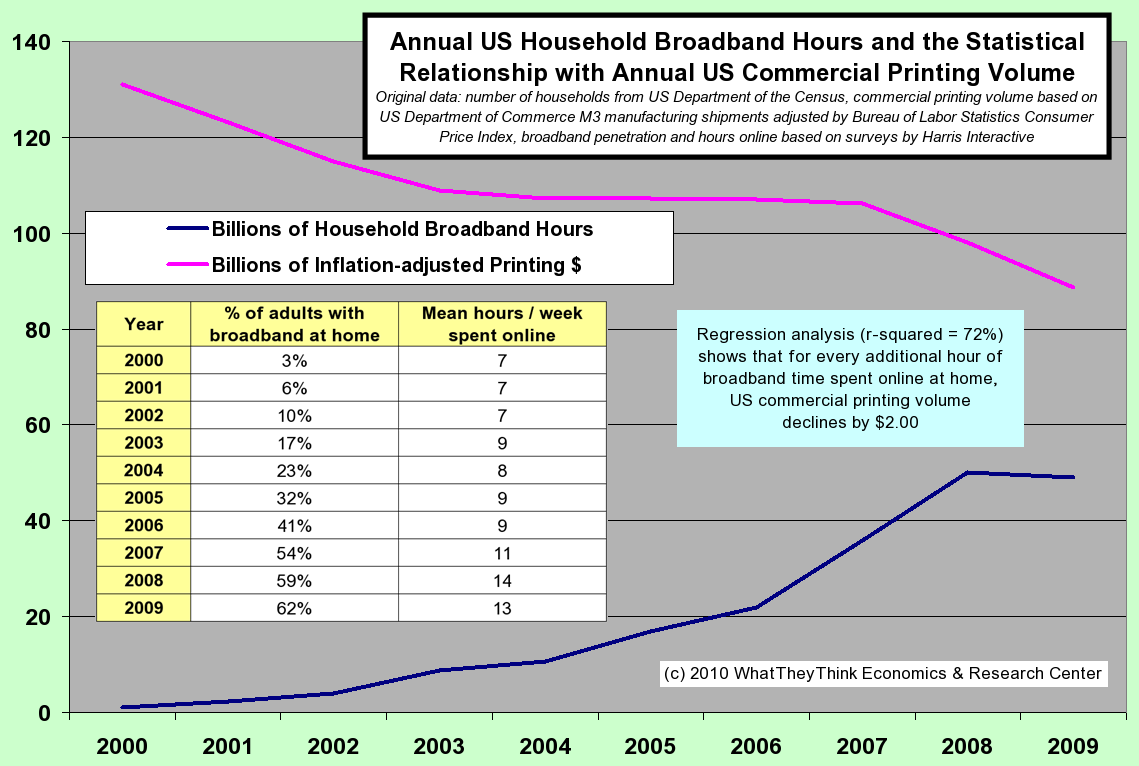
Broadband hours and the statistical relationship with printing volumes
Published: February 15, 2010
Broadband use by adults has been increasing and the number of households with broadband service has almost doubled since 2005. What's the relationship with commercial printing volume? Last year, there were about 48 billion hours of broadband use by households, and every additional hour of use decreases commercial print volume by about $2. Full Analysis
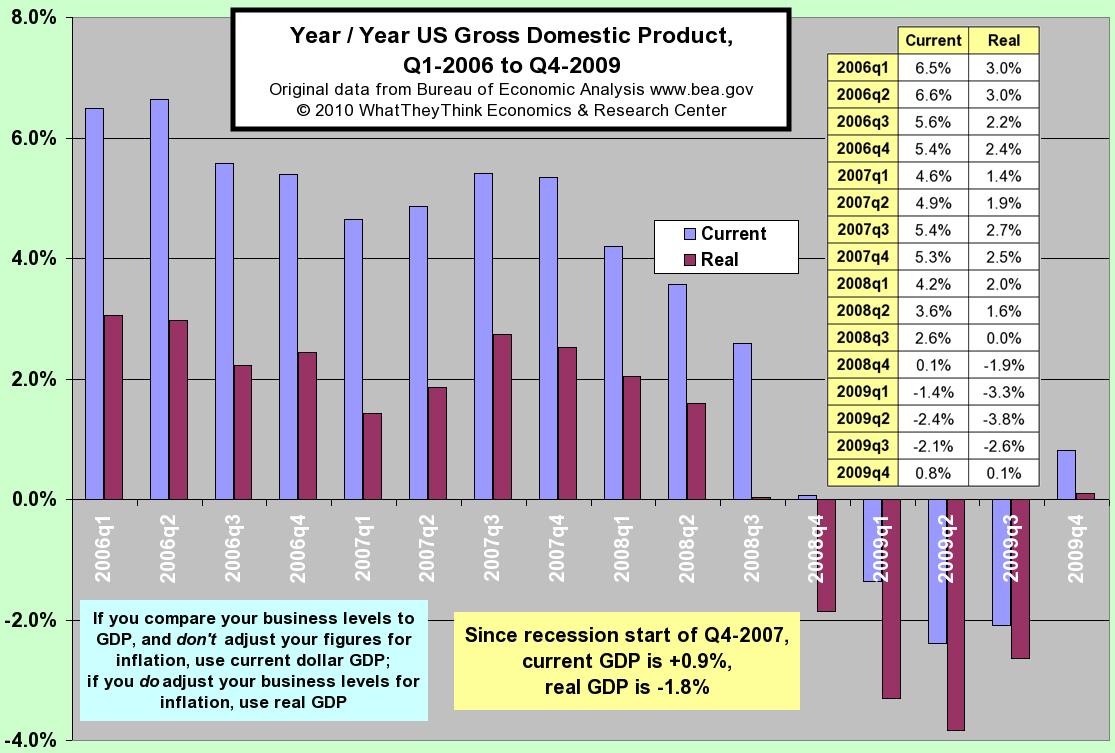
Year/Year US Gross Domestic Product
Published: February 1, 2010
Why was Q4-09 GDP +5.7% met with a stock market decline and more handwringing about the economy? Dr. Joe looks at the yearly change in GDP, and explains it all. Full Analysis


![]()
- Inkjet Integrator Profiles: DJM
- Spring Inkjet Update – Webinar
- Security Ink Technologies for Anti-Counterfeiting Measures
- Komori unveils B2 UV Inkjet
- Keeping Nozzles Fresh with Flow
- Komori to Unveil the J-throne 29 Next Generation Digital Press at drupa 2024
- Inkjet drives convergence of transactional and graphic arts applications
- The Inevitability of Technology Shifts and How to Communicate with Credibility

WhatTheyThink is the official show daily media partner of drupa 2024. More info about drupa programs
© 2024 WhatTheyThink. All Rights Reserved.