Data Analysis
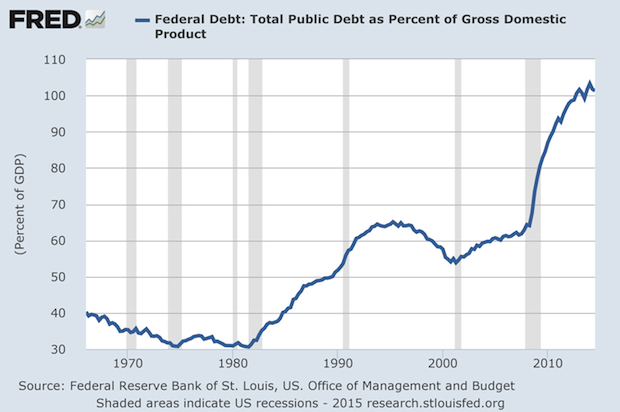
Federal Debt as Percentage of GDP Over 100%
Published: January 8, 2015
Economic press coverage of the Federal budget is usually limited to the annual deficit, the shortfall of tax and fee collections versus spending. While the deficit as a percentage of GDP is down to about -4% from 2009 when it was more than -9%, the deficits do accumulate. Now, the total debt of the US exceeds GDP. This is likely to keep political pressure on the Fed to keep rates down. It also means that a 1 percentage point rise in interest rates would cost $180 billion and can double the annual deficit. But the Fed may not be able to increase interest rates when they want to no how hard they might try. International rates, such as those in Germany, have recently been below 0.5% for the 10 year bond. US rates are comparatively high in the 2% range, and any push upward by the Fed would probably be met by arbitrage actions in the other direction. Full Analysis
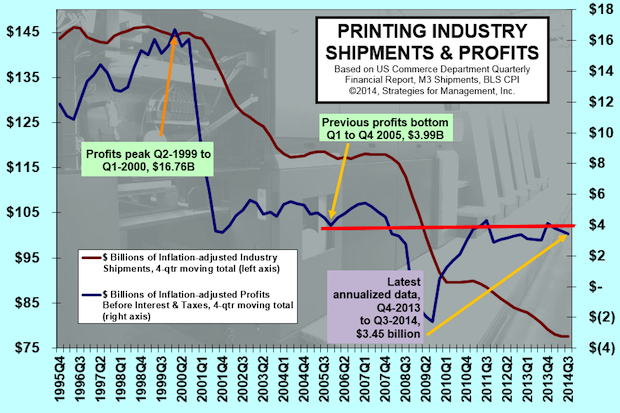
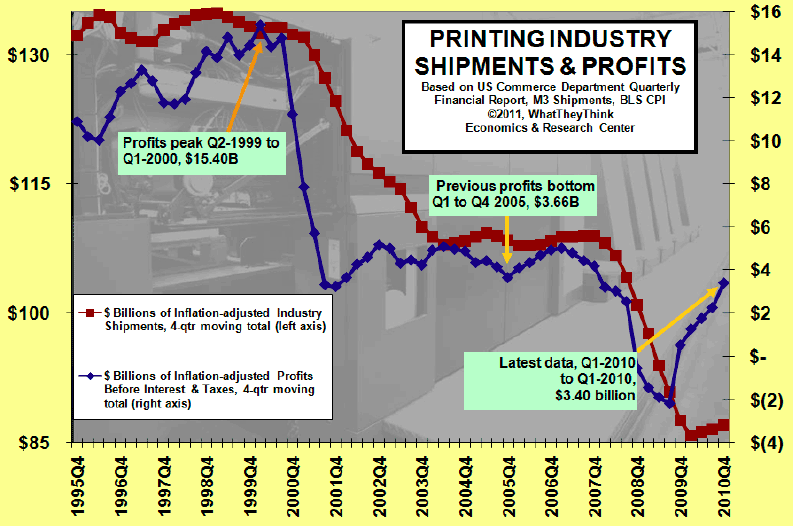
Profits Still Below $4 Billion on Annual Basis
Published: December 18, 2014
Four billion dollars was the approximate bottom of 2005's inflation adjusted annual profits. The four-quarter total annual profits have had a difficult time breaking through that level for more than eight years. Full Analysis
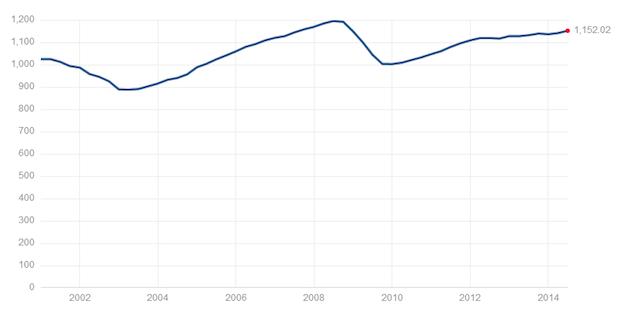
Inflation-adjusted Sales of S&P 500 Firms Still Below Pre-Recession Levels
Published: December 11, 2014
GDP may say that the recession ended in June 2009, but there are still data series that have not yet confirmed that five years later. Total employment is one of them, as is median household income, but so is the inflation-adjusted sales of companies in the S&P 500. Even though the companies in the S&P 500 index have revenues lower than the peak of June 2008, the S&P 500 stock index is getting closer to all-time high levels of Spring 2000 (The Dow Jones average already is, the Russell 2000 has been for a while, but the NASDAQ is still off by about 15%). These sales of 500 of the world's best companies have not kept up with real GDP growth since the recession ended (about 2% per year). Some economists believe that this is an indication that GDP data should be viewed with great suspicion, and that there has yet to be a true recovery. Full Analysis
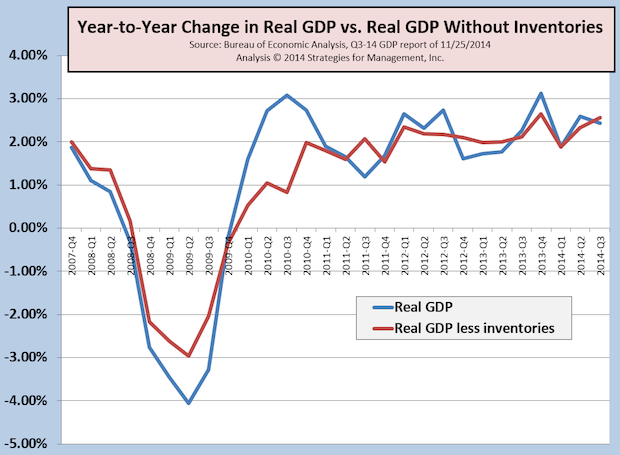
Revised GDP Pushed Higher, But Did Not Change Longer Range Growth Rate
Published: December 4, 2014
Third quarter GDP was revised from +3.5% to +3.9%, but the change was mainly in net inventories, and did little to affect the assessment of underlying and longer range growth compared to the prior year of about +2.43%. Inventories have been bouncing around a bit over recent quarters and are running a little higher than they should be, indicating that some minor correction is forthcoming, especially if non-US economies are slowing down. Full Analysis
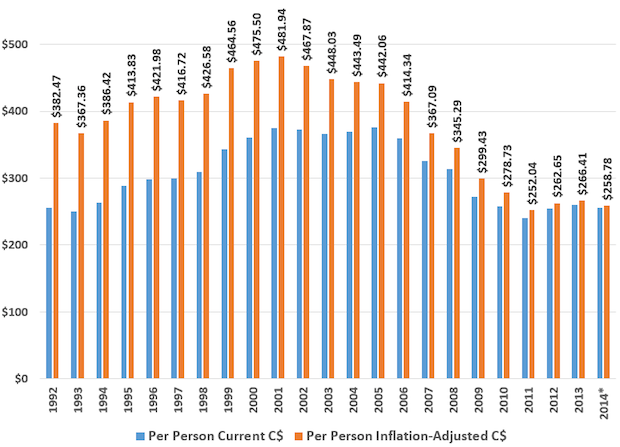
Canada Per Capita Commercial Printing 1992-2014
Published: November 14, 2014
Using printing shipments and population data from Statistics Canada, we have prepared this chart that shows per capita shipments of commercial printing in Canada current dollars and Canada inflation-adjusted dollars. Full Analysis
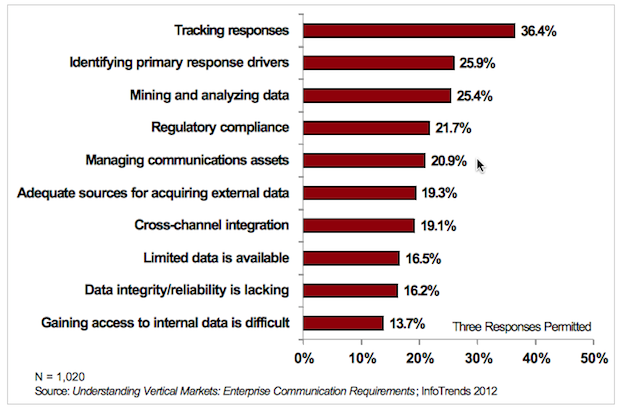
Top Challenges When Executing Personalized Communications/Campaigns
Published: November 13, 2014
InfoTrends’ study entitled Understanding Vertical Markets: Enterprise Communication Requirements surveyed over 1,000 enterprise executives. When asked about the top data challenges that they faced related to executing personalized campaigns, respondents highlighted tracking responses, understanding response drivers, and analyzing and mining data. Full Analysis
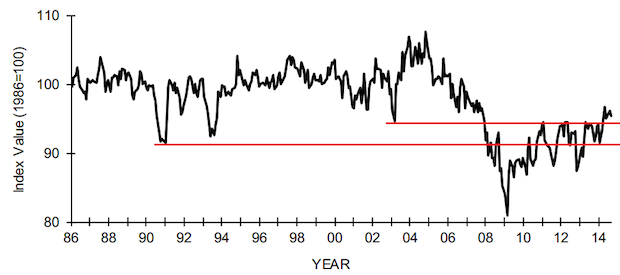
NFIB Small Business Index Retreats Slightly, But is Still on Path of Slow Uptrend
Published: October 16, 2014
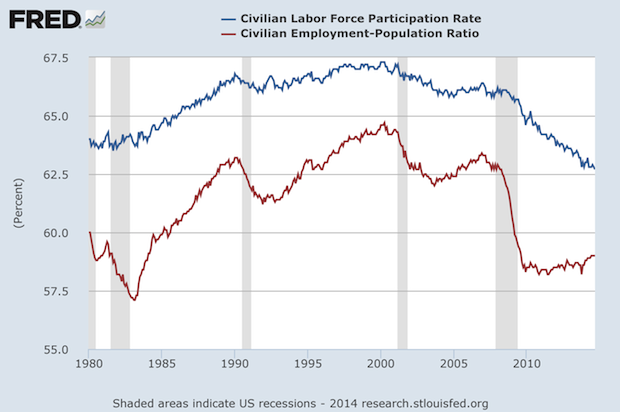
Labor Force Participation Rate and Employment-Population Ratio Below 1980 Levels
Published: October 9, 2014
What's made the economic recovery since June 2009 so intriguing has not been its below-history GDP growth rate, but also the deterioration in key measures of employment. The labor force participation rate has been declining as idled workers decide not to return to the workforce. Full Analysis
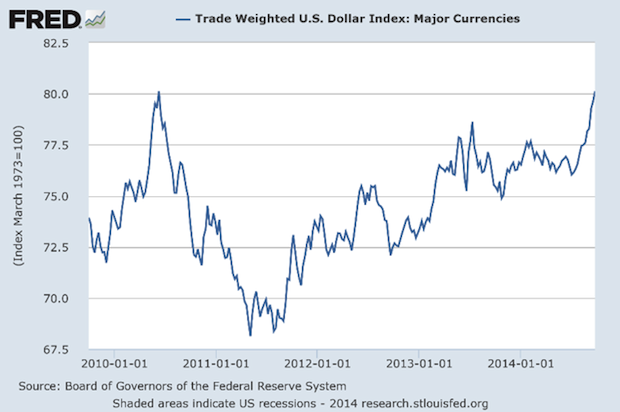
The Stronger Dollar... or Is It?
Published: October 2, 2014
There's been a lot of interest in the stronger dollar for many reasons. Some consider it a safe haven during times of global tensions. Others say it's a bounce off a bottom. Still others consider the dollar the least ugly of all the major currencies. But is it really stronger? (Two charts) Full Analysis
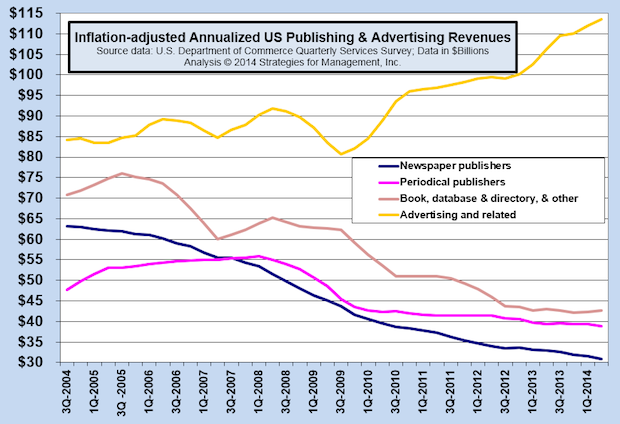
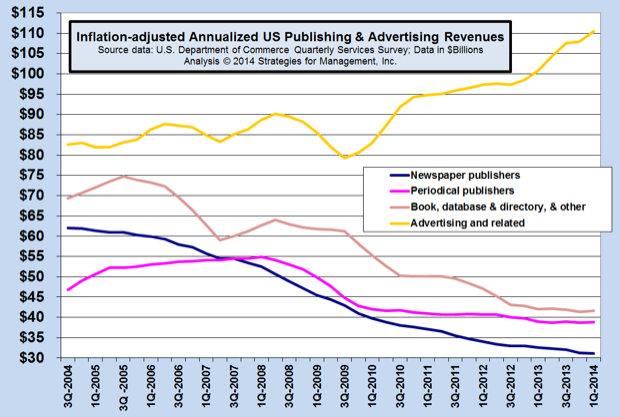
Advertising Agency Revenues Up at Annual Rate of 7% Since Start of Economic Recovery
Published: September 25, 2014
The latest data from the Commerce Department's Quarterly Service Survey shows that advertising agency revenues have climbed at the rate of 7% per year since the recovery began after June 2009. The rate of growth exceeds real GDP growth which has been +2.2% on an annual basis since that time. How did they do it? A strong emphasis on digital media strategy and production that's replaced their loss of commissions and fees for broadcast and print advertising. Publishers revenues have not come close to even that lackluster GDP rate. The steep decline for magazines and books is over, for now: they are not growing and the decline in revenues is mild. Newspapers, however, are still in long term decline. Newspaper revenues are about half of what the were in 2004. Full Analysis
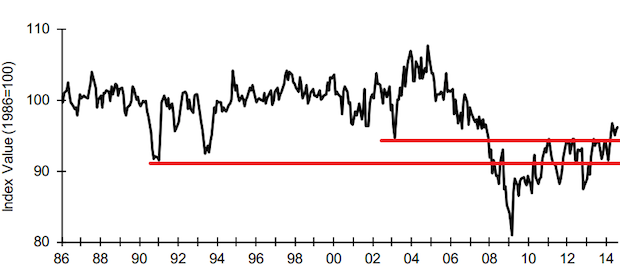
NFIB Small Business Index Breaks Through Recession Upper Range
Published: September 18, 2014
Small business seems to be improving, at least according to the NFIB monthly survey of small business owners. For years, it was usually trapped between two recession bottoms, but it has broken through of three consecutive surveys. It's an encouraging report, but it's not bullish. The NFIB commentary states “More owners still think business conditions will be worse in six months than think they will be better. Few see the current period as a good time to expand. The outlook for improvements in real sales volumes faded. Interest in borrowing continues to remain at record low levels; owners are satisfied with inventories and aren’t planning a lot of investment.” The NFIB is still in the range of a 2+% GDP growth level, but sees not robust small business activity in the near term. Basically, the NFIB report is good news in that conditions are better, but a big positive breakout in activity will remain elusive. Full Analysis
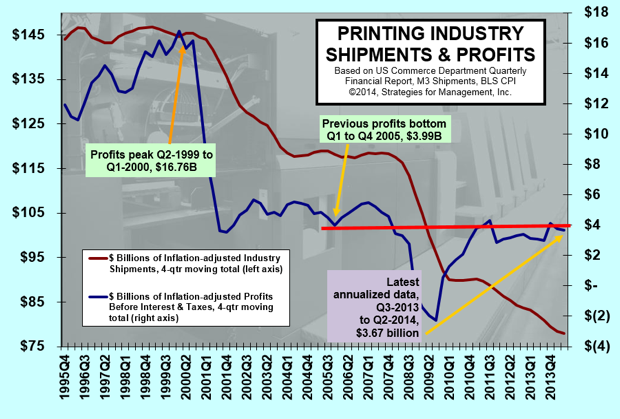
Annualized Inflation-adjusted Profit
Published: September 12, 2014
Second quarter US commercial printing profits were $1.13 billion, based on the recent Quarterly Financial Report issued by the Department of Commerce and combined with other Commerce Department and Bureau of Labor Statistics data. This was down -7.5% compared to Q2-2013. For the last four quarters, total profits were $3.67 billion, and that is +20% higher than the equivalent measure a year ago. The Q1 four-quarter moving total was revised down from $4.03 billion to $3.77 billion. Full Analysis
Sept 4th Key Recovery Indicators
Published: September 4, 2014
Dr. Joe's Key Recovery Indicators were started in 2009, and track the monthly ups and downs of the economy in terms that are relevant to small and mid-size businesses. Full Analysis
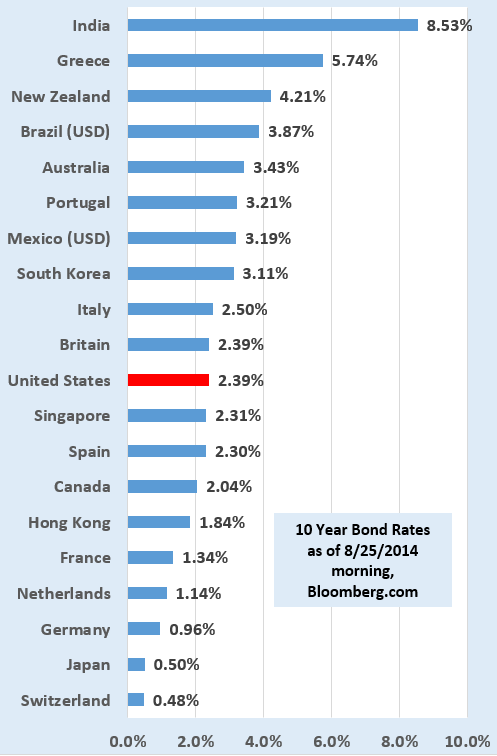
Global Bond Rates May Make it Hard for the Fed to Affect US Long-Term Rates
Published: August 29, 2014
The Fed has been in unchartered territory with its post-2008 actions, and unwinding them may take a bit of creativity. One of their obstacles might be the rates of long term government bonds around the world. The chart below shows the yield of 10-year bonds earlier this week. The rate on US 10-year bonds is more than 4x Japan's and more than 2x Germany's. In an odd situation, US bonds are actually paying less than those of Spain. Global investors looking for yield (pension funds, governments, mutual funds, and others) may thwart Fed actions by finding US funds to be compelling deals on a relative basis. The Fed can usually affect only short term rates, which was one of the reasons they became aggressive in buying long term debt in their Quantitative Easing (QE) actions. Getting yields down for all durations is what made their actions were essentially unprecedented for the US. If they attempt to sell their holdings quickly to raise rates, there might be more buyers than they anticipate, making the action fruitless. It still looks like once the QE buying is done in the next few weeks the Fed will simply let their most of their holdings mature rather than force-feed them to the market. Listen for the word “macroprudential” in the next months. That's how Fed officials are describing the gentle prodding they may have to take to reverse their course. It turns out that some of the Fed members are worried their actions may encounter resistance, so they will resort to some arm-twisting to push banks to act in the manner they want. That hasn't worked well in the past, and it probably won't work well now, but it does add a word to our vocabulary. Full Analysis
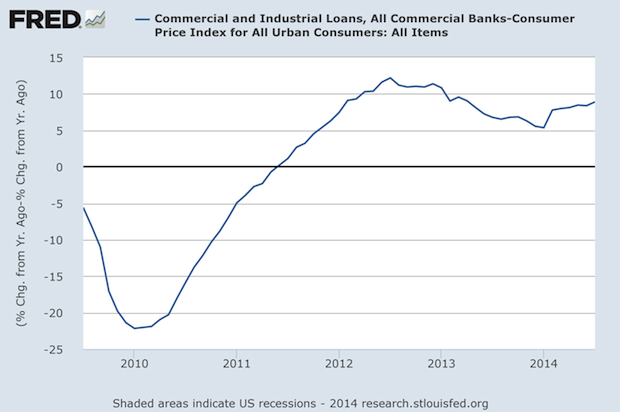
Inflation-adjusted Commercial & Industrial Loans Growing
Published: August 22, 2014
Commercial and industrial loans took a while to start growing again, almost two years after the recovery started. Loans now total $1.7 trillion, the highest amount in the history of the data series, a little more than 10% of GDP. Overall, they are up about 40% on a current dollar basis since mid-2010. Full Analysis
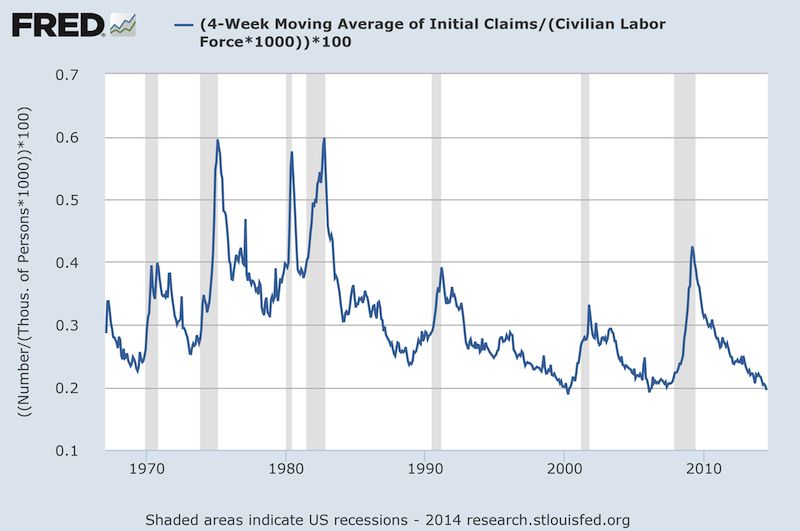
Initial Jobless Claims as a Percentage of the Workforce
Published: August 15, 2014
As the number of employed workers has been slowly increasing, and the total workforce has been growing, initial claims for unemployment have been decreasing. The historical perspective is very interesting. This past recession, as bad as it was, did not come close to the levels of the 1970s and 1980s recessions (about 0.6% of the workforce). This most recent recovery is already at the best levels of prior expansions. It doesn't feel “that good”; what's different? The workforce has not kept up with population growth, and about 2 million workers have permanently left the workforce. Also, companies have been cautious in their hiring, meaning, that there are fewer workers to dismiss when businesses of the past needed to. One could look at the chart and say that when this ratio reaches this current level (0.2%) a recession has always followed. Probably not in this case: this ratio may go to unprecedented lower levels because of the workforce exodus and the slow pace of hiring that has made this recovery so different than previous ones. Economist Mark Perry at the American Enterprise Institute discussed the steady rise in job openings at his blog. They are at a 13-year high (not adjusted for population growth), and still less than January 2000 by 800,000. Full Analysis
Latest Recovery Indicators
Published: August 8, 2014
Dr. Joe's Key Recovery Indicators were started in 2009, and track the monthly ups and downs of the economy in terms that are relevant to small and mid-size businesses. Full Analysis
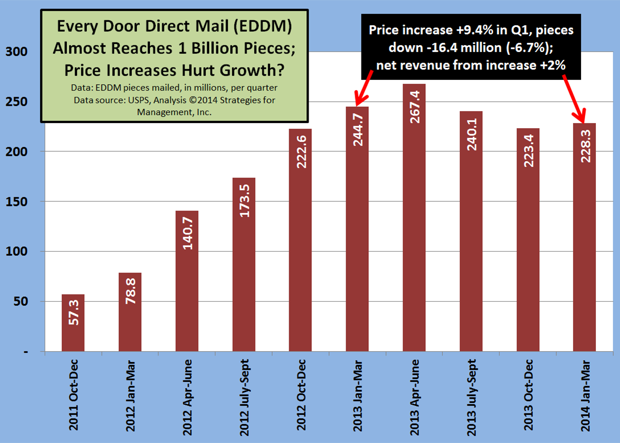
USPS' Every Door Direct Mail Program Declines After Price Increase
Published: July 24, 2014
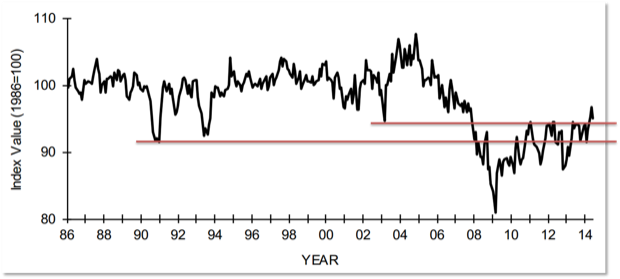
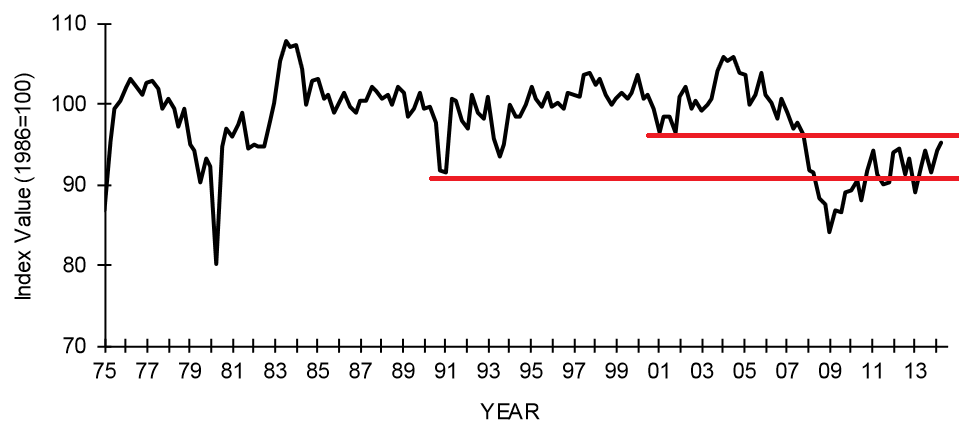
NFIB Small Business Index Breaks Through 2003 Recession Bottom for Last Two Months
Published: July 10, 2014
The NFIB index has been trapped between the bottom of two recessions, that of the early 1990s and the early 2000s recession bottom. Though the latest report retreated a bit, it's still above the 2003 low. Small business is improving at a very slow pace, but this may finally be a good sign after the very disappointing Q1 GDP report. Full Analysis
Recovery Indicators Improve
Published: July 3, 2014
The recovery indicators were mainly better this month, with the NASDAQ bouncing around then finishing well, and three of the four ISM indicators increasing. The one that didn’t is still firmly in expansion territory. The original estimate of proprietors’ income was $1,371 then it was reduced to $1,366 billion and now it’s $1,359. Full Analysis
Advertising Agency Revenues Still Climbing
Published: June 24, 2014
The chart below shows the latest revenue data, on an inflation-adjusted basis, for ad agencies and publishers. Note how ad agency revenues are rising. While there have always been agencies that specialize in certain media, like television, direct mail, or others, the industry is media agnostic in the aggregate. Its job is to increase the positive visibility of its clients and help spur their customers into action. Full Analysis
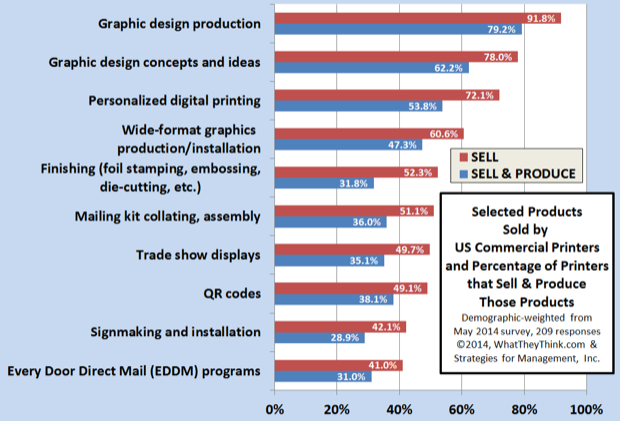
Selected Generally “Non-Offset” Products and Services Offered by US Commercial Printers
Published: June 18, 2014
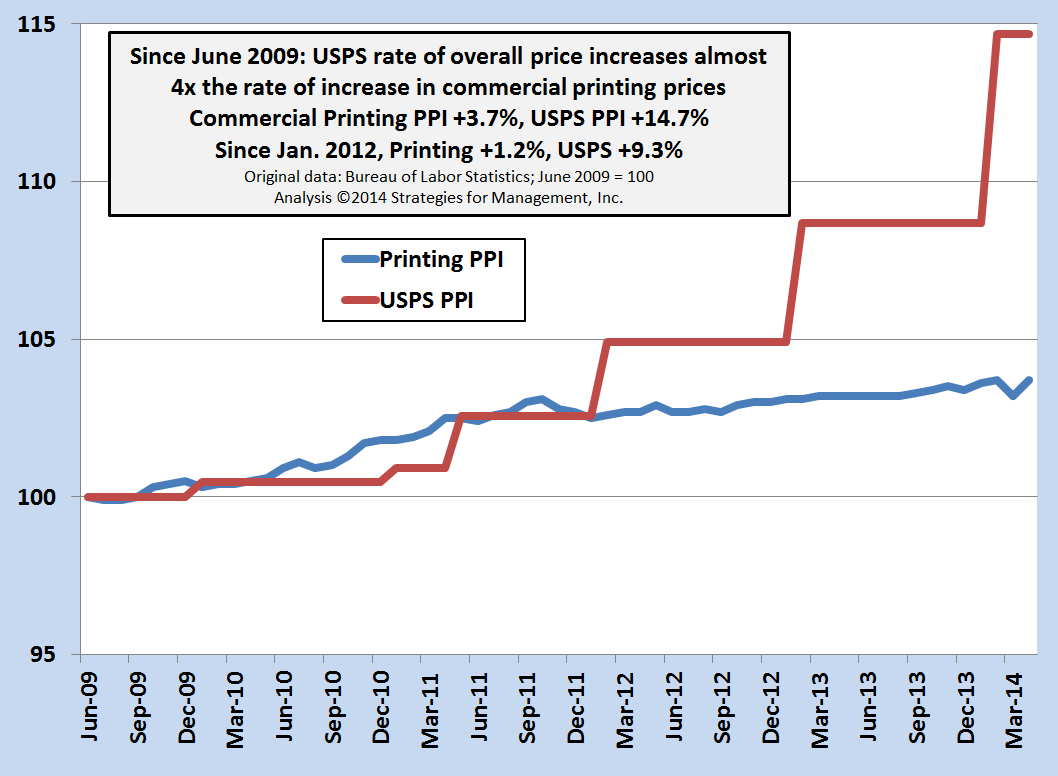
Since June 2009, rate of overall USPS price increases almost 4x the rate of increase in commercial printing prices
Published: June 5, 2014
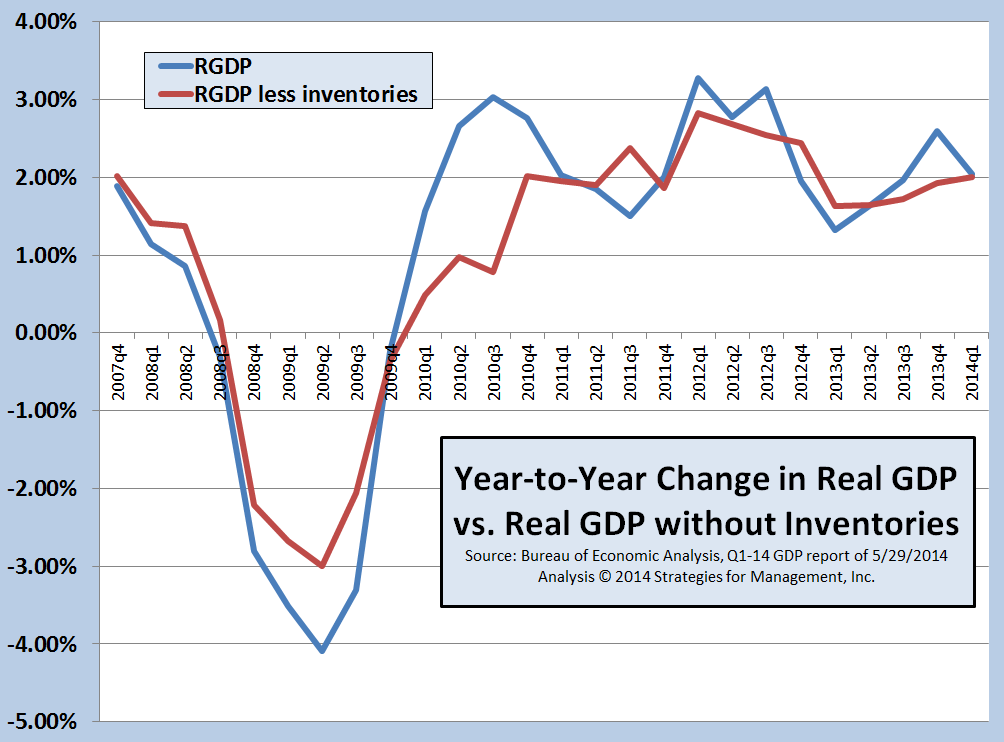
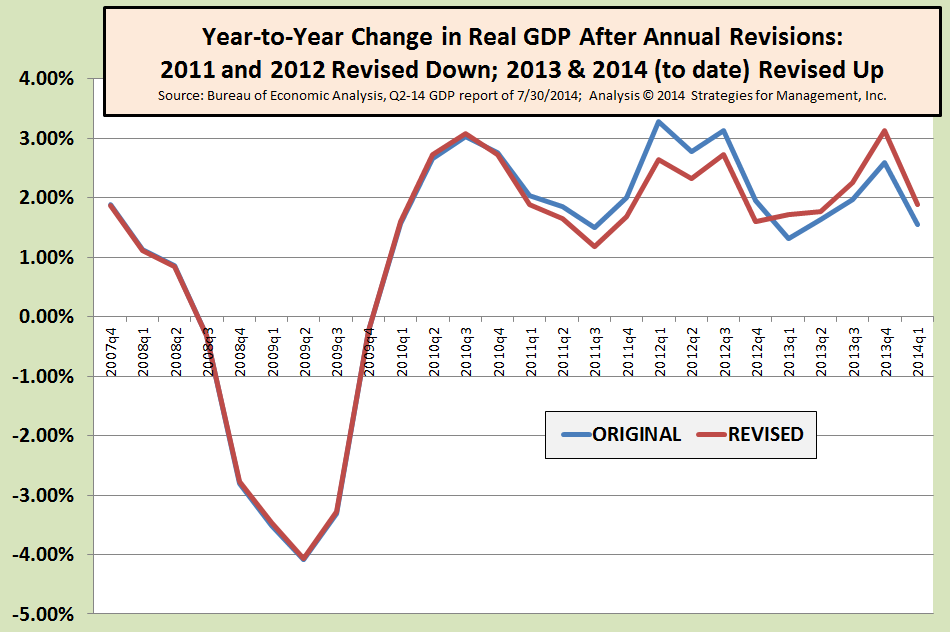
Though Q1-2014 GDP was -1%, the Year-to-Year Trend Remains in the +2% Range
Published: May 29, 2014
The Bureau of Economic Analysis released the second revision of Q1-2014 US Gross Domestic Product (GDP), indicating a contraction of the US economy in the quarter. As reported in prior (“laughable and embarassing”) analysis, an inventory buildup in the last two quarters of 2013 distorted the underlying condition of the economy. Full Analysis
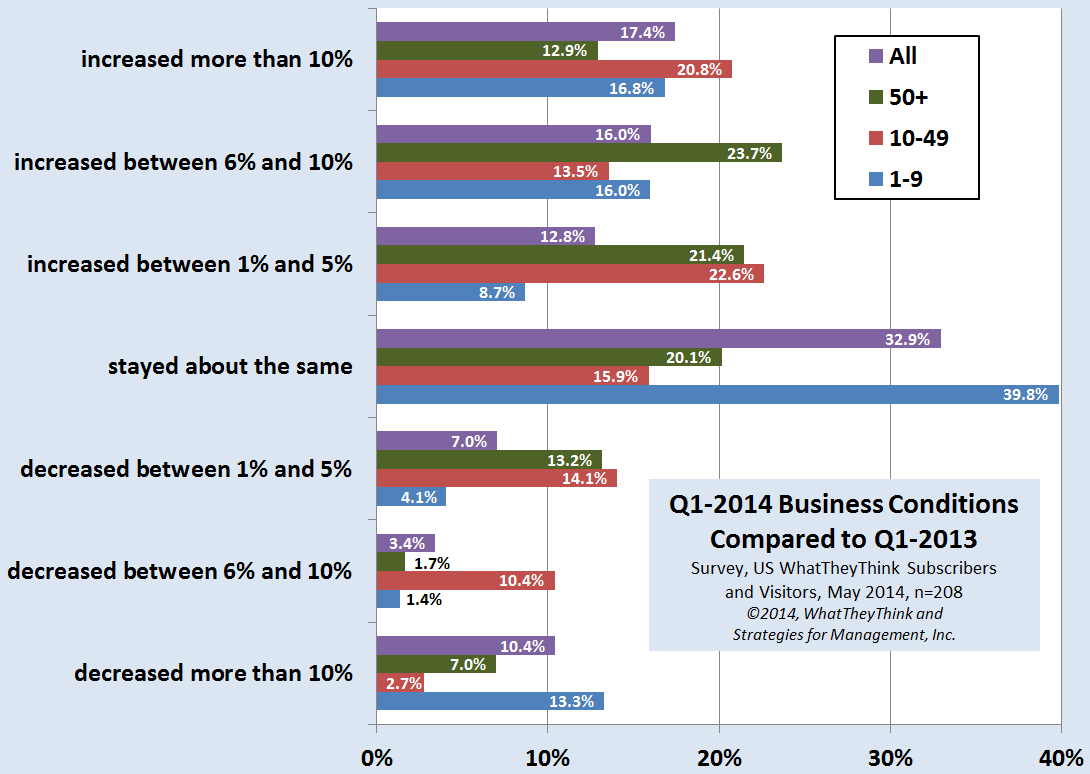
Q1-2014 Business Conditions Compared to Q1-2013
Published: May 29, 2014
Business conditions were generally good, with more than 33% reporting business increases of 6% or more. About 13% of respondents indicated business decreases of 6% or more Full Analysis
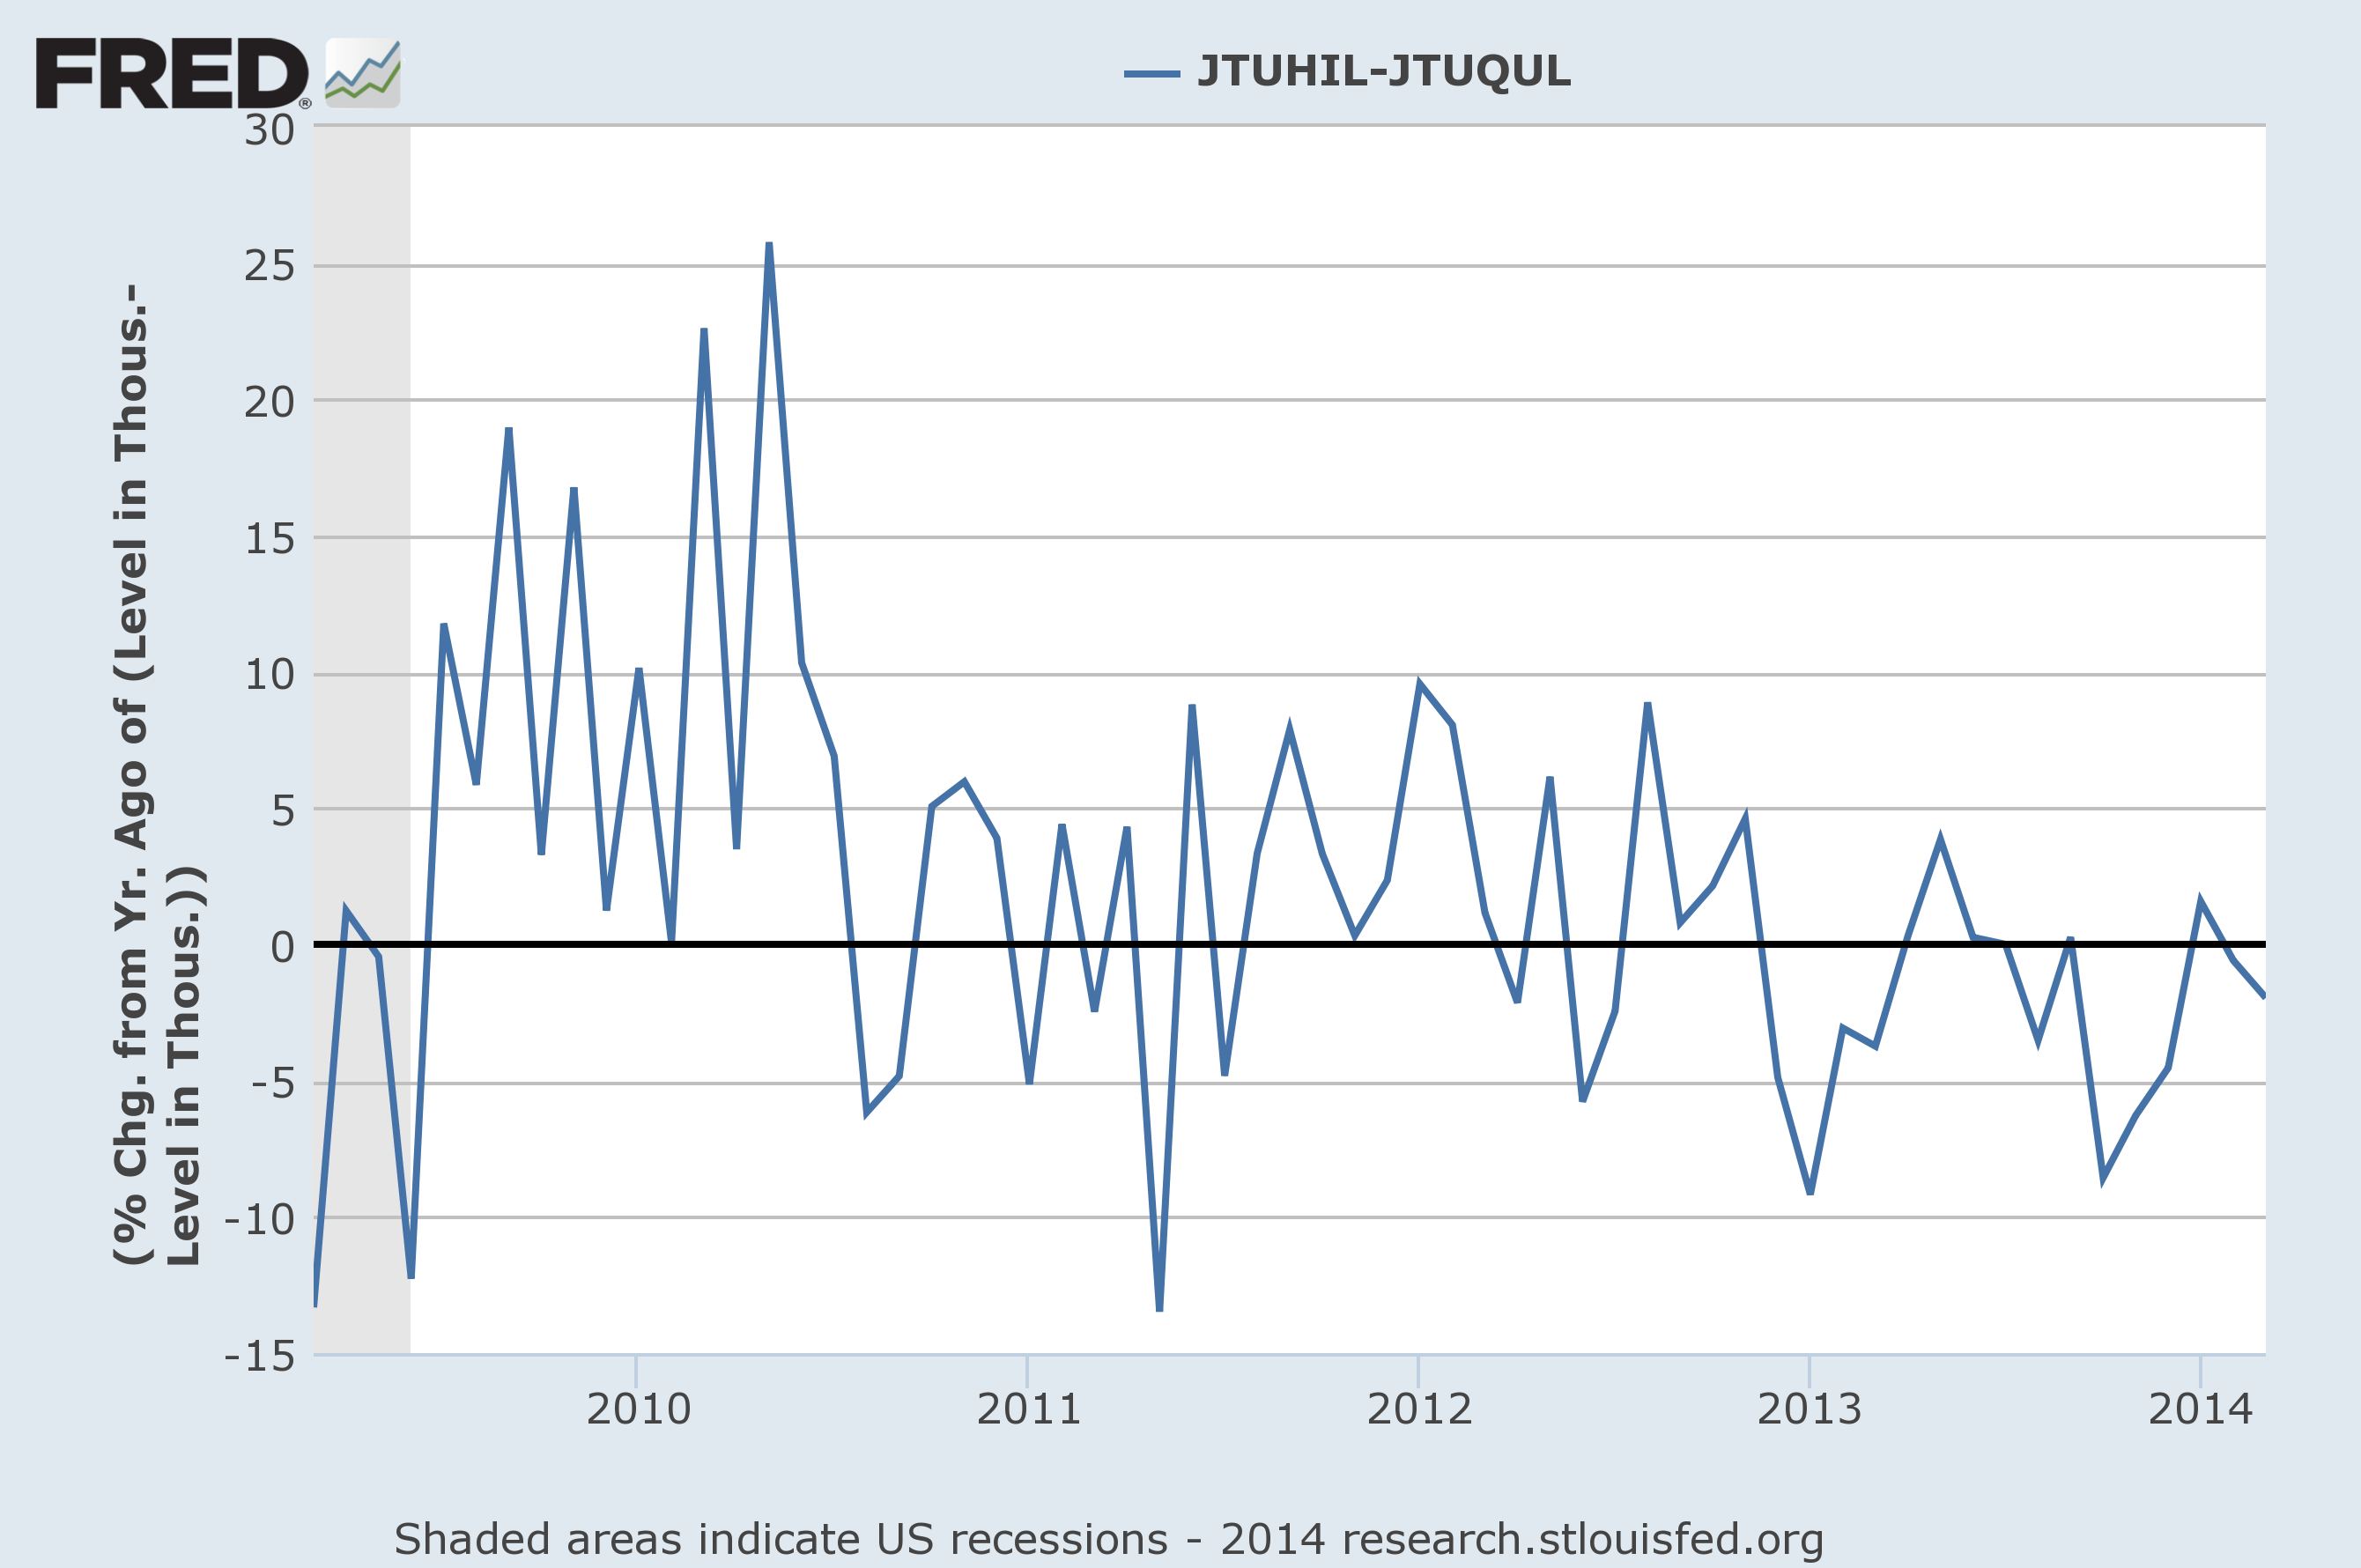
Labor Market Net Hiring Turns Negative
Published: May 15, 2014
US employment data has many cross-currents: the unemployment rate is down, but the labor participation rate is at 35-year lows. Last week the Bureau of Labor Statistics published its JOLTS report, which shows they dynamic factors at play in the labor market. This chart shows the percentage of hires less the number of quits on a year-to-year basis. Note in the chart below the rapid rise in employment as the recession ended and the recovery began, and also how it has narrowed and turned negative in recent months. It's been mainly negative for about 18 months. Full Analysis

Q1-2014 US Commercial Printing Shipments Down -4% Compared to 2013
Published: May 8, 2014
March 2013 US commercial printing shipments were down -$148 million (-2.2%) compared to 2012. The first quarter was down -$770 billion (-4%). On an inflation-adjusted basis, shipments were down -$270 million (-5.4%) and down -$1.05 billion (-5.4%) for the quarter. Full Analysis
Recovery Indicators Rebound; Q1-2014 GDP Below 1% but Corrects for Business Inventory Misjudgments
Published: May 8, 2014
The recovery indicators rebounded since last month. New orders for manufacturers remained at the same level that indicates growth. Full Analysis
April Printing Employment +1,000
Published: May 7, 2014
Printing employment in April rose by 1,000 workers. It is always hard to determine if these were actual workers or if the changes were the result of issues with the estimation models of the Bureau of Labor Statistics. Production workers were the greatest part of the increase (800). Full Analysis
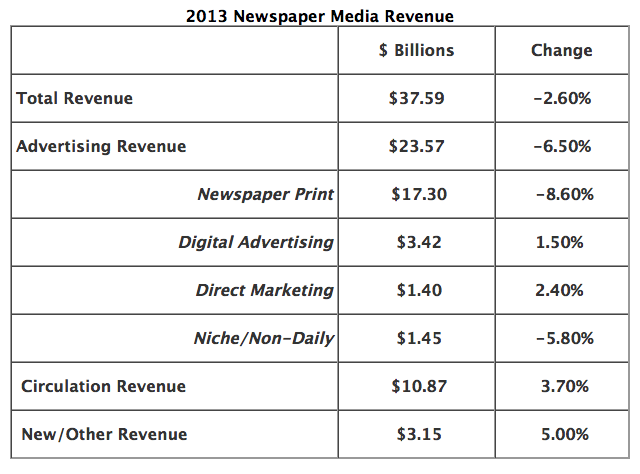
2013 Newspaper Revenue
Published: April 23, 2014
Circulation revenue for U.S. newspapers recorded a second consecutive year of growth, rising 3.7% to $10.87 billion in 2013 according to figures released by the Newspaper Association of America. Total revenue was $37.59 billion in 2013, a loss of 2.6 percent over 2012. Full Analysis
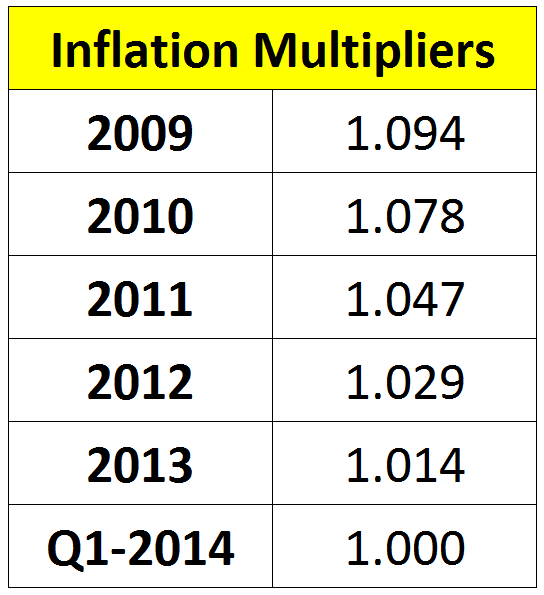
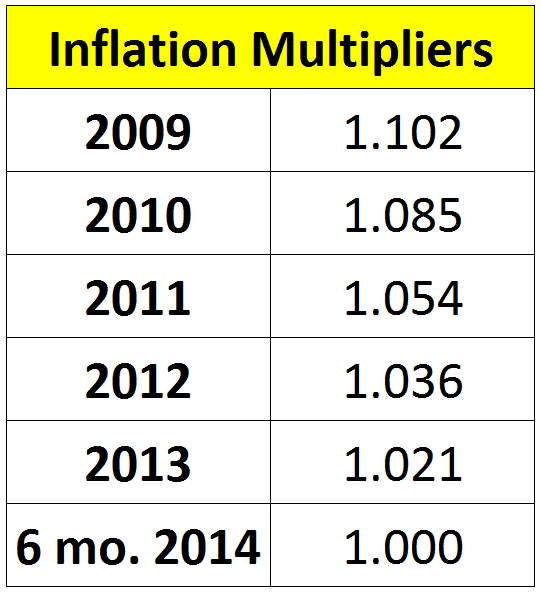
Table of Latest Inflation Multipliers
Published: April 23, 2014
Below is the latest set of multipliers based on the Consumer Price Index. Multiply your historical financial statements by the figures below to adjust data to the CPI for the first quarter of this year. Full Analysis
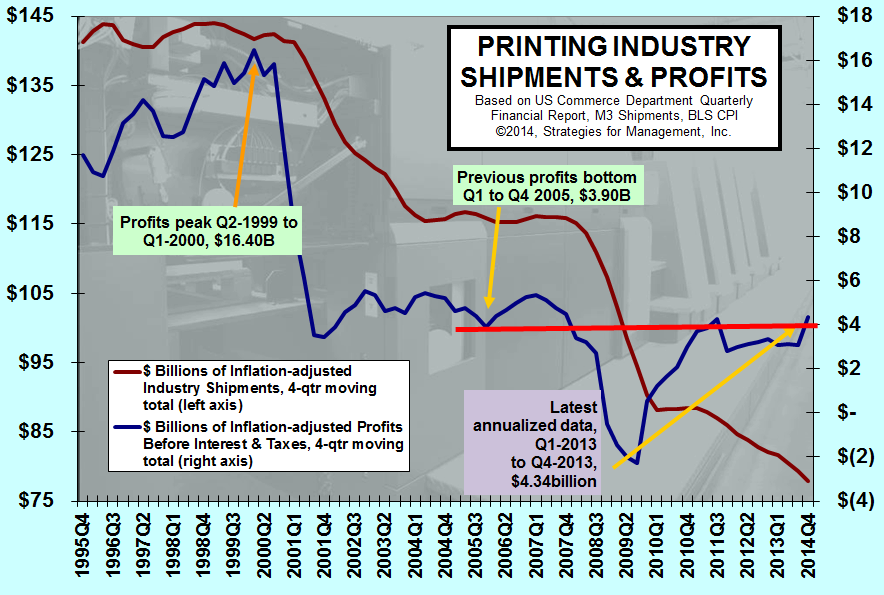
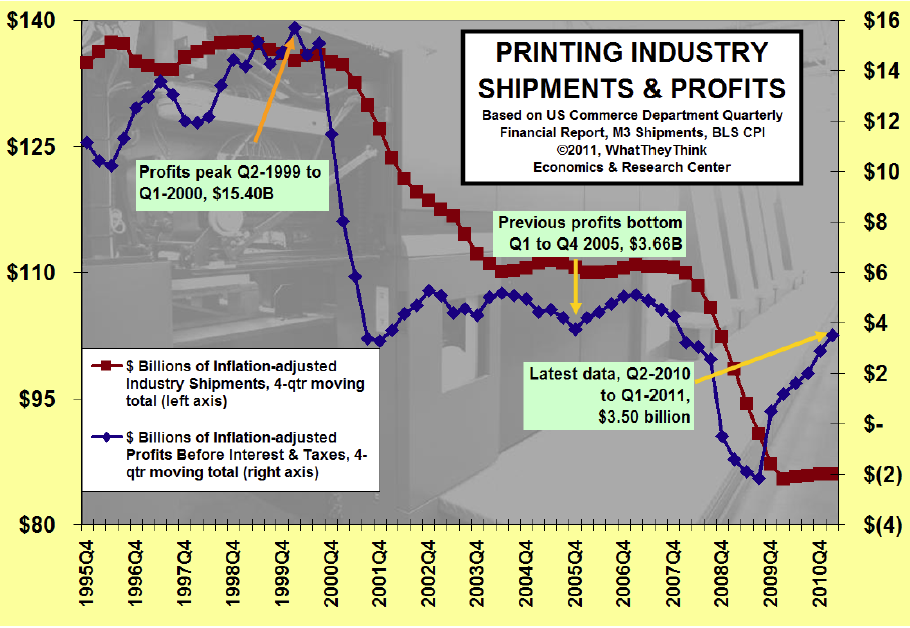
Printing Industry Shipments and Profits
Published: April 18, 2014
For the year, profits were $4.34 billion. On an inflation-adjusted basis, that was the highest level of industry profits since 2007. This is despite there being $28 billion less printing shipments, 8,000 fewer printing establishments, and 73,000 fewer employees. It was the best profits per establishment ($173,000) since 2000. Full Analysis
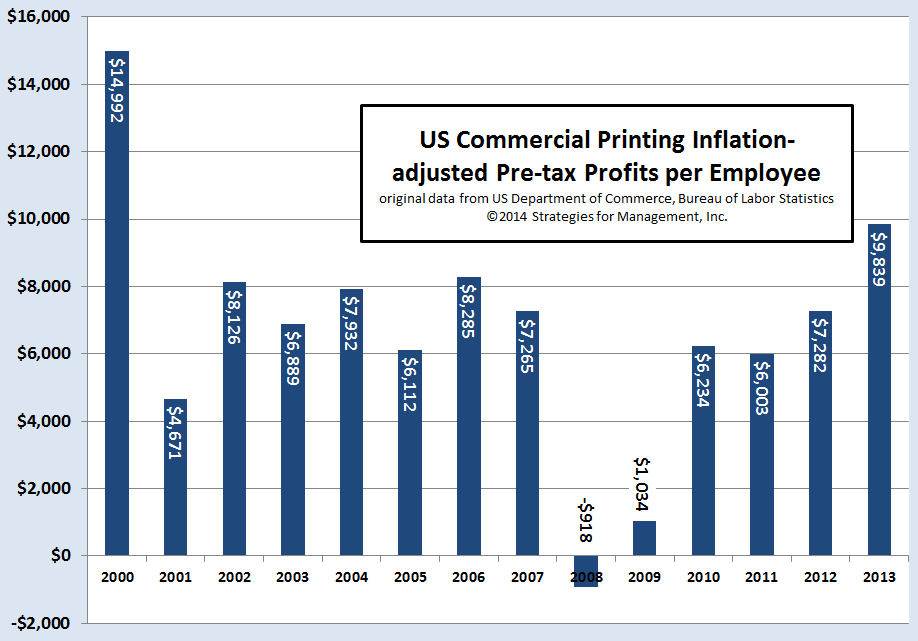
Printing Profits per Employee Rise
Published: April 17, 2014
Profits per employee increased to higher levels since 2000. Industry consolidation is a big factor in this report. It is not just mergers and acquisitions, but also plant closures and bankruptcies, and the opening of new businesses that absorb the best and most appropriate resources of the closed plants, and also the strategic changes that surviving companies make as they respond and anticipate marketplace changes, absorbing the sales volume of departed competitors. Full Analysis
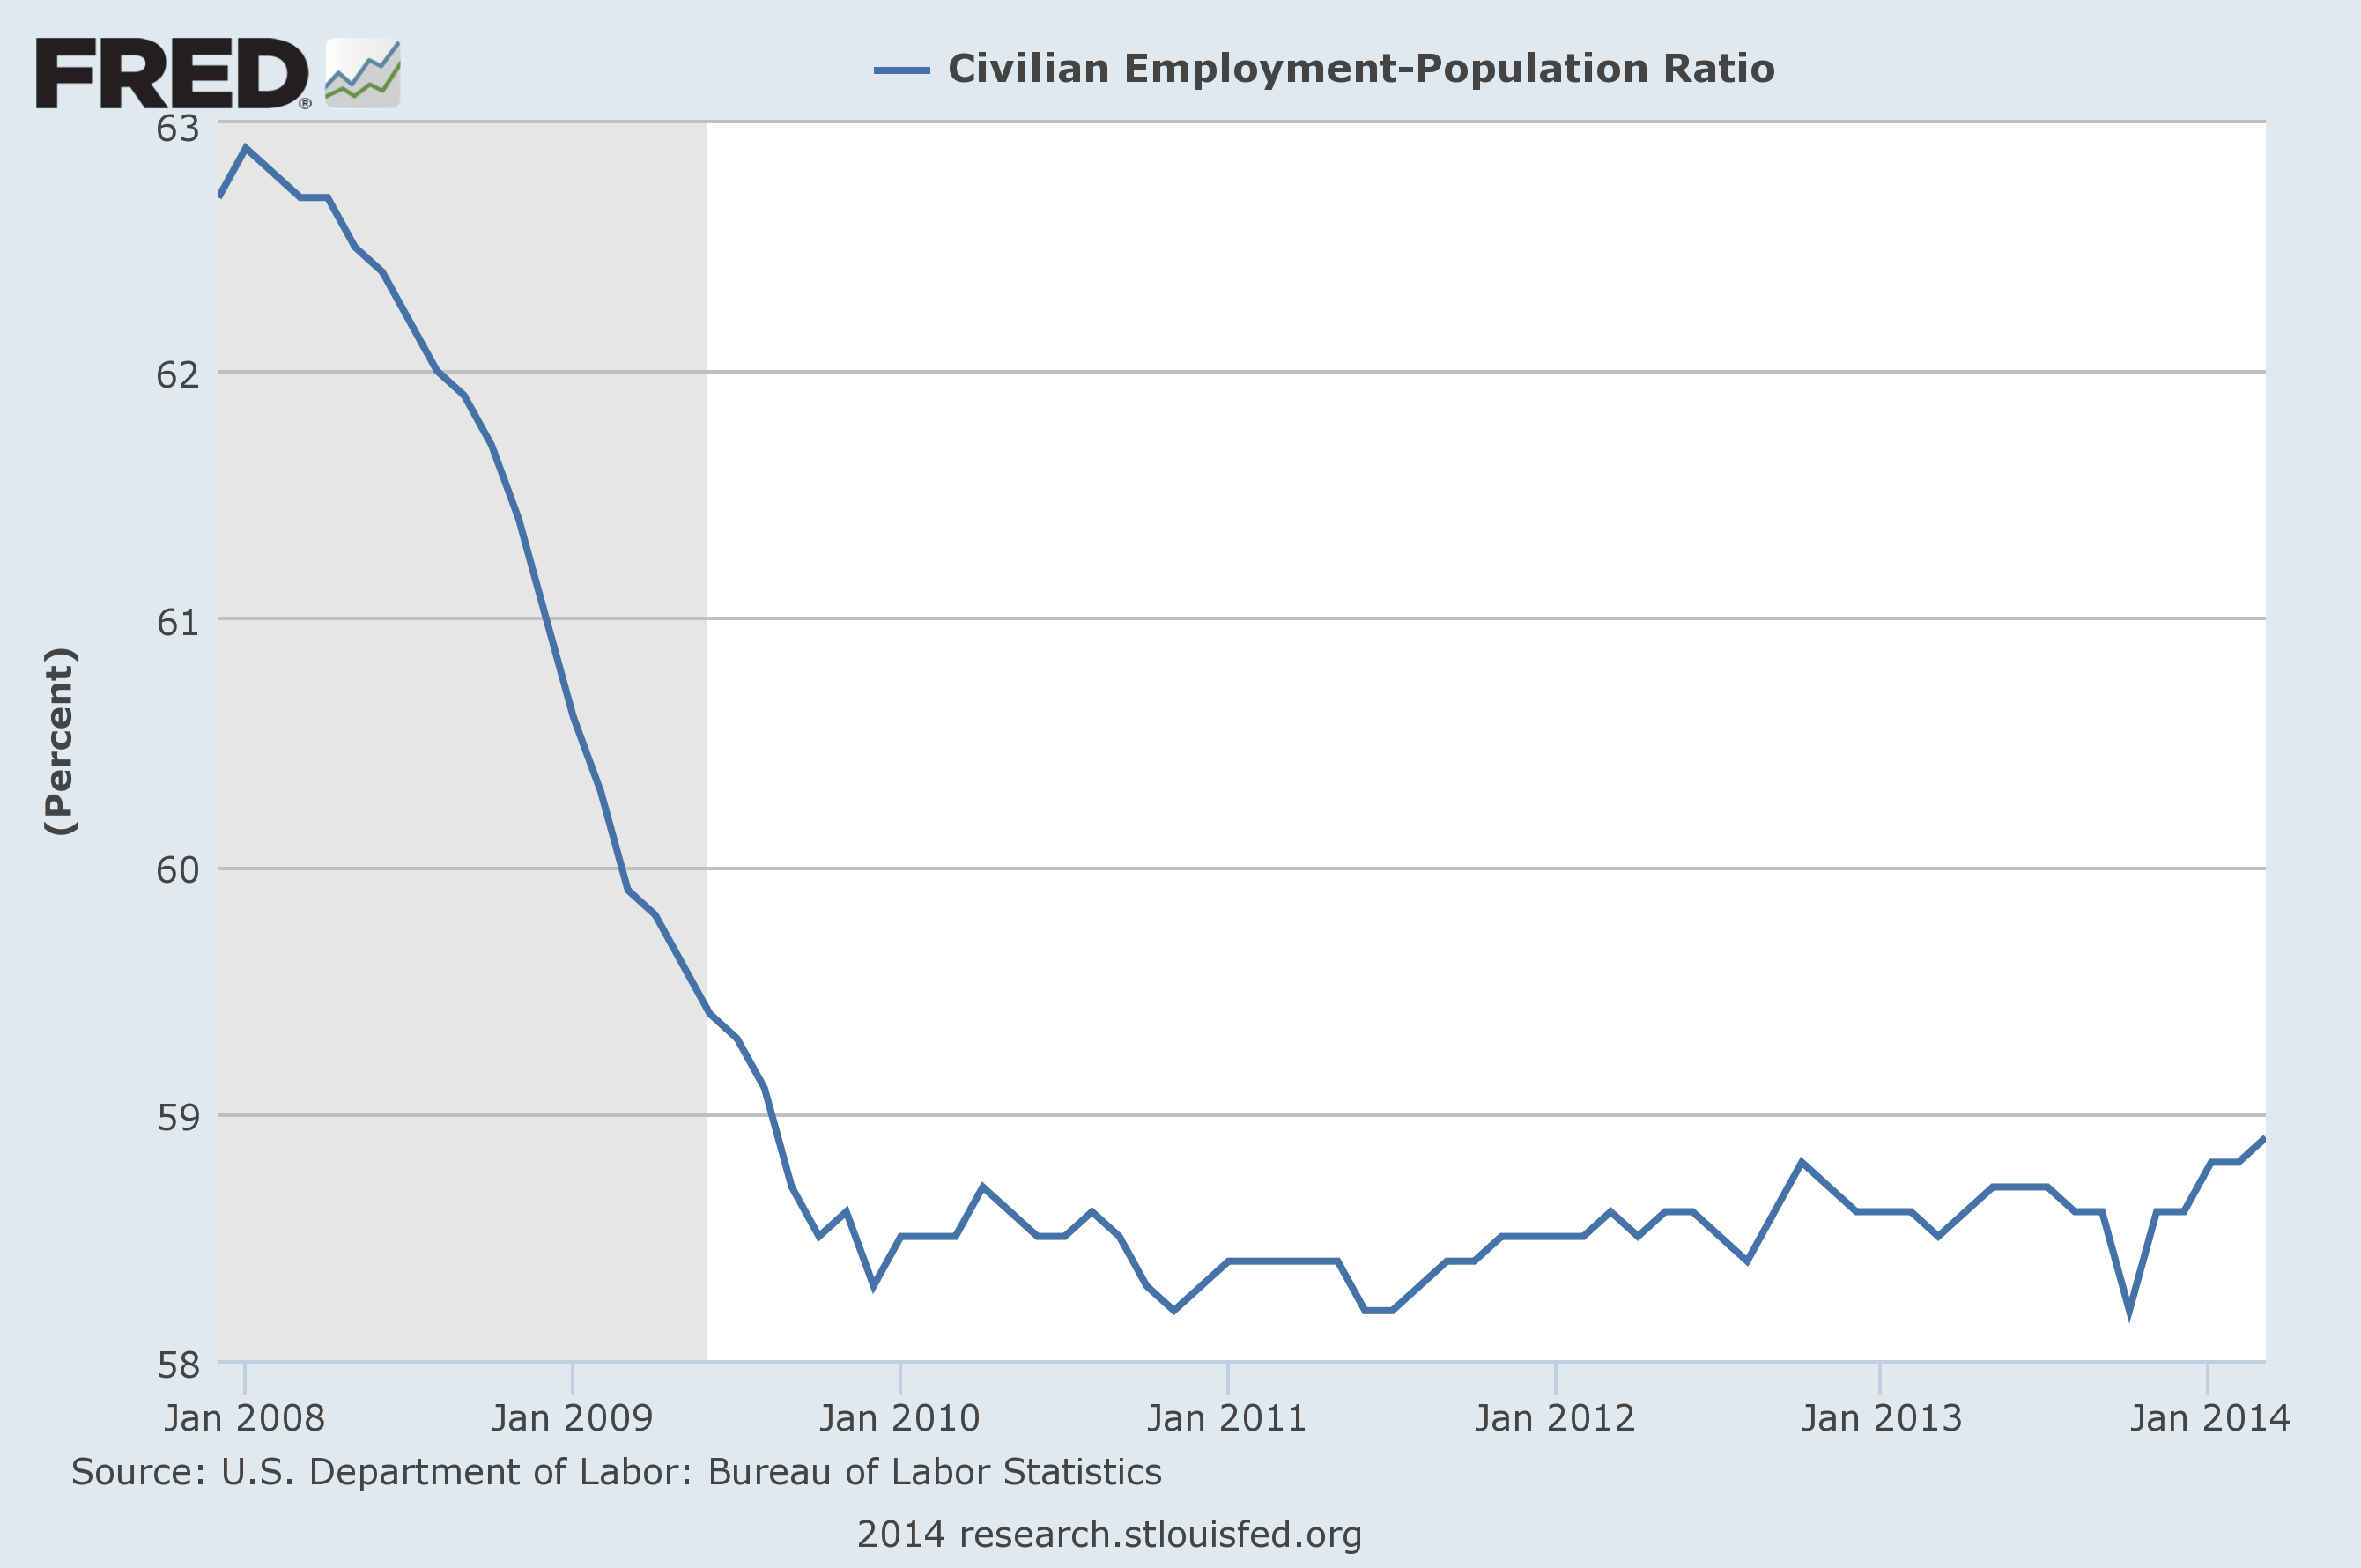
Employment-Population Ratio Still Below Pre-Recession Levels
Published: April 10, 2014
One of the measures of the health of the labor market is the comparison of the total population to civilian employment. This measure has yet to approach levels achieved prior to the recession. This measure is important because it follows the growth in population. The number of workers is now nearly what it was at the start of the recession, but population has grown about 6% since that time. In rough terms, this means that the economy is short about 5.6 million jobs. Full Analysis
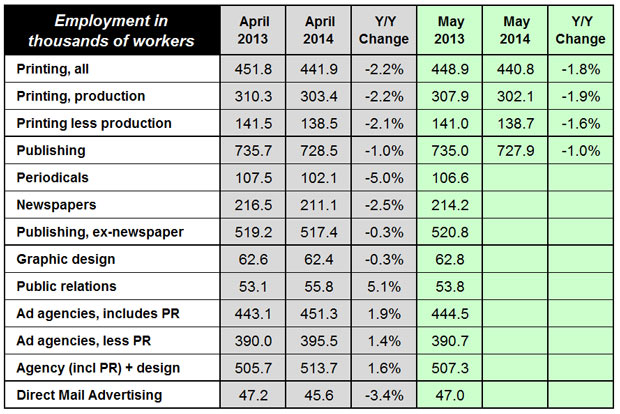
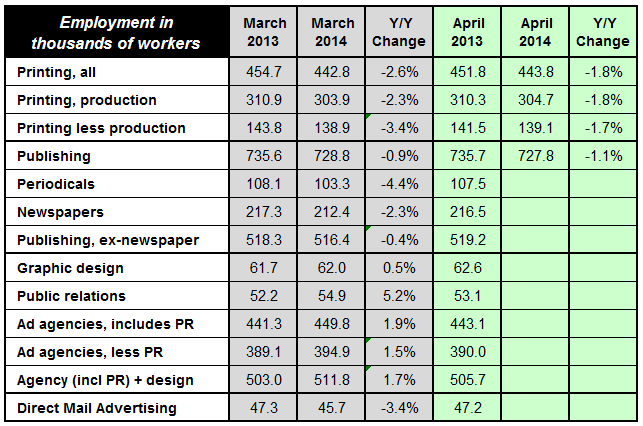
Employment Changes in the Printing and Content Creation Industries
Published: April 7, 2014
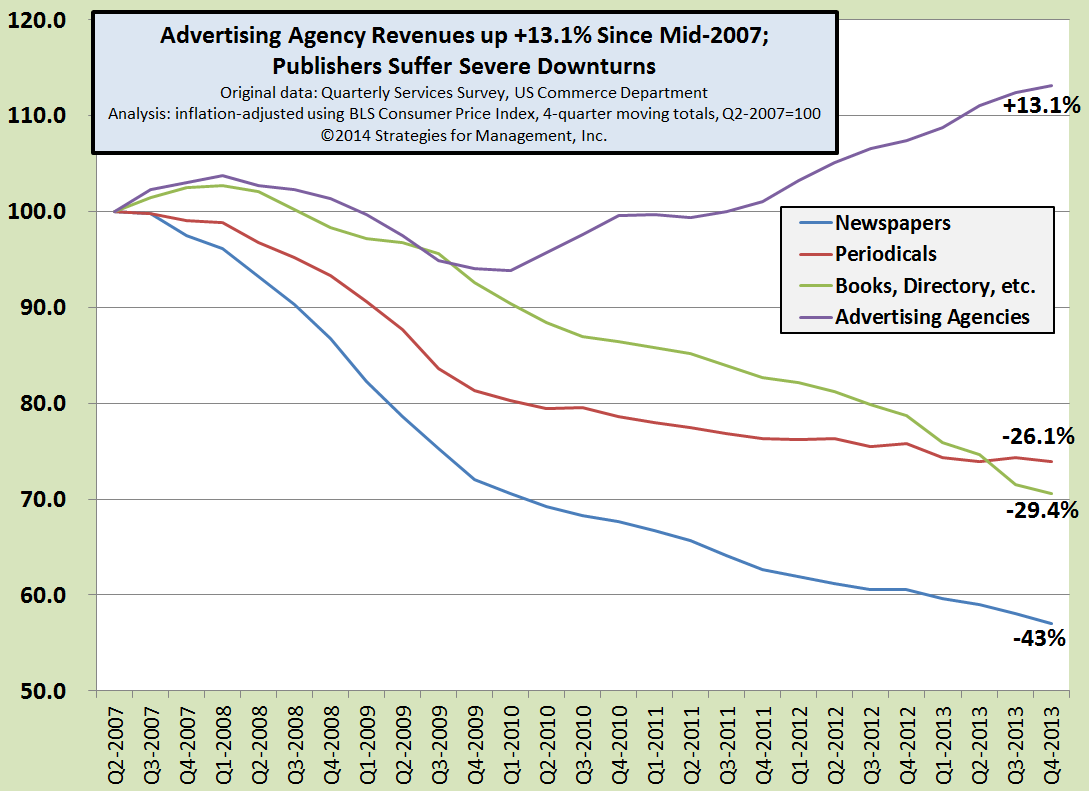
Ad Agency Revenues On Steady Rise Higher
Published: March 16, 2014
Since the second quarter of 2007, the first quarter for which we can create four-quarter inflation-adjusted moving totals, ad agency revenues are up more than 13%. Publishing industries have note fared well at all. Full Analysis

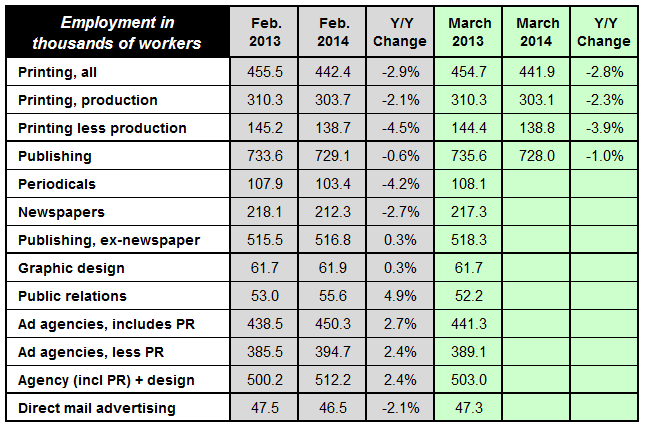
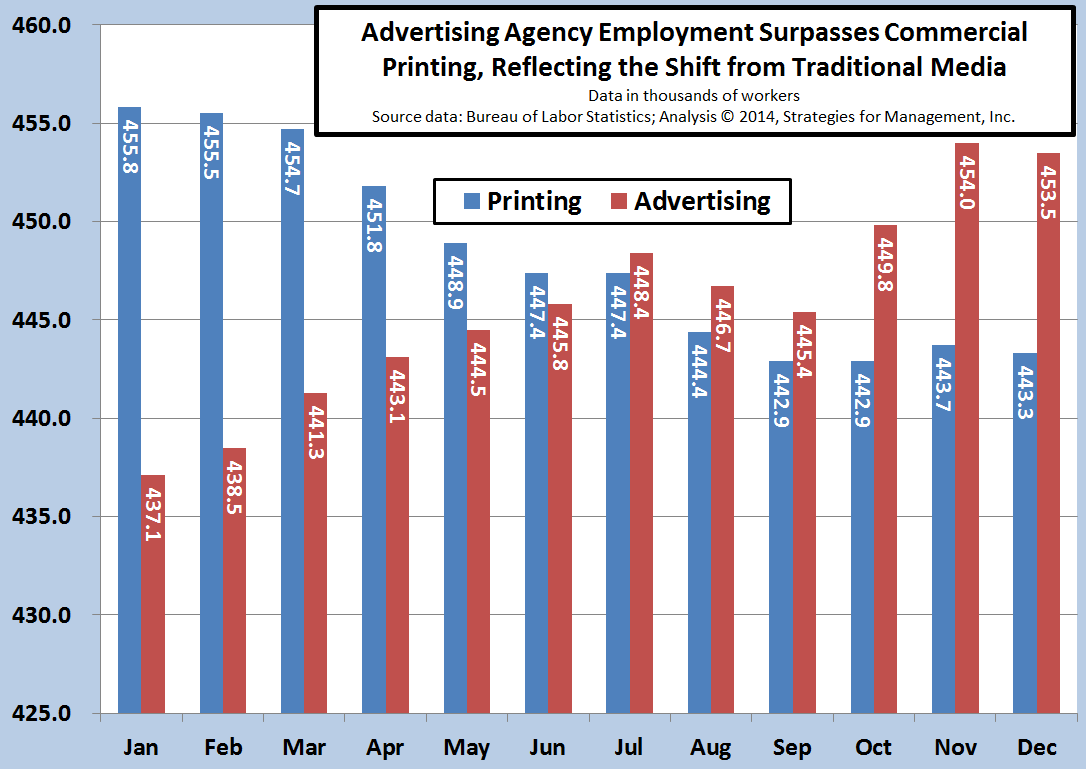
Advertising Agency Employment Surpasses Commercial Printing, Reflecting the Shift from Traditional Media
Published: February 7, 2014
The major news in the data update is that employment in advertising agencies surpassed that of the printing industry in July 2013. For 2013, printing employment was down by -12,600 (-2.8%). The biggest change was in employees outside of production who were -8,400 of that decline (-5.7%). Graphic design employment was down slightly for the year, but these data do not include freelancers, which are an essential part of that business. Inside the advertising agency employment data are public relations employees, the main area of employment growth in this sector. Full Analysis
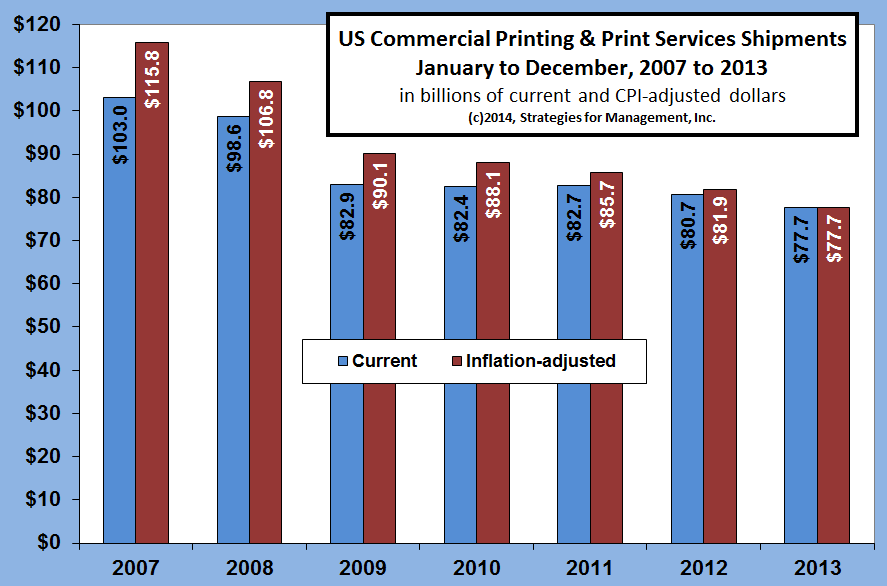
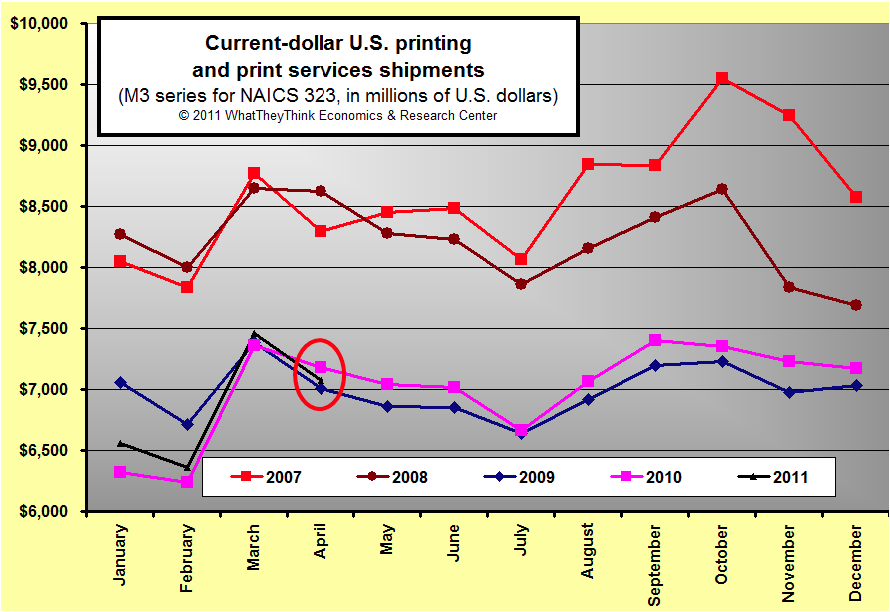
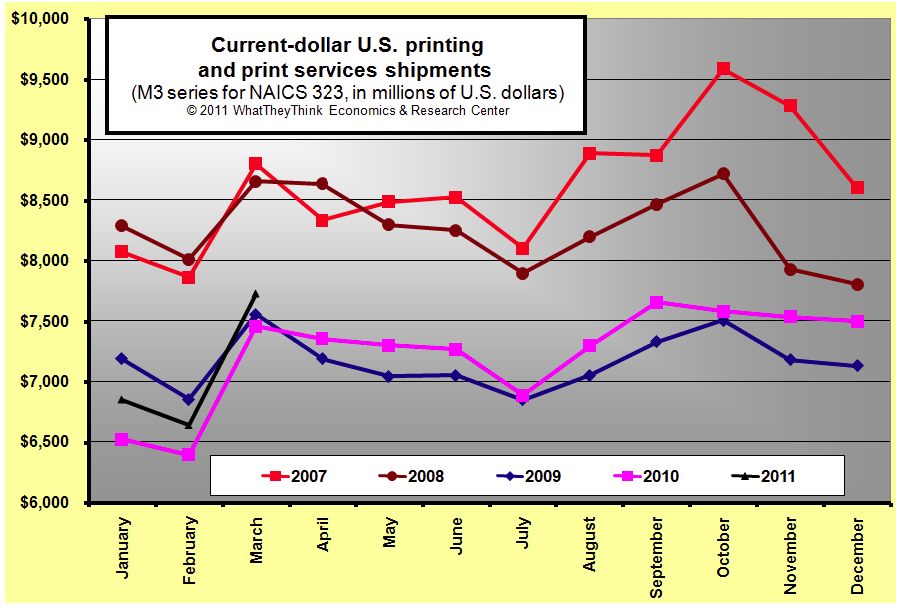
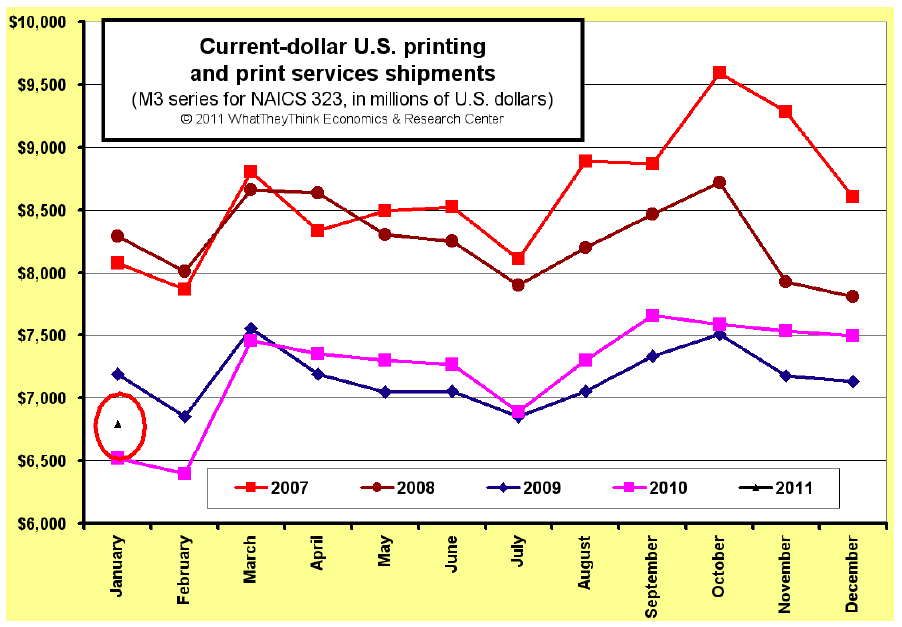
2013 US Commercial Printing Shipments Reach $77.6 Billion
Published: February 4, 2014
The Department of Commerce released December 2013 and revised November data. December shipments were $6.271B (-3.7% vs. Dec. 2012). On a current dollar basis, the total for the year was $77.6B, -3.8%. After adjusting for inflation using the Consumer Price Index, shipments were down -5.1%. The chart below shows current dollar and inflation-adjusted shipments starting with 2007 Full Analysis
Inflation-adjusted US Printing and Print Services Shipments
Published: February 4, 2014
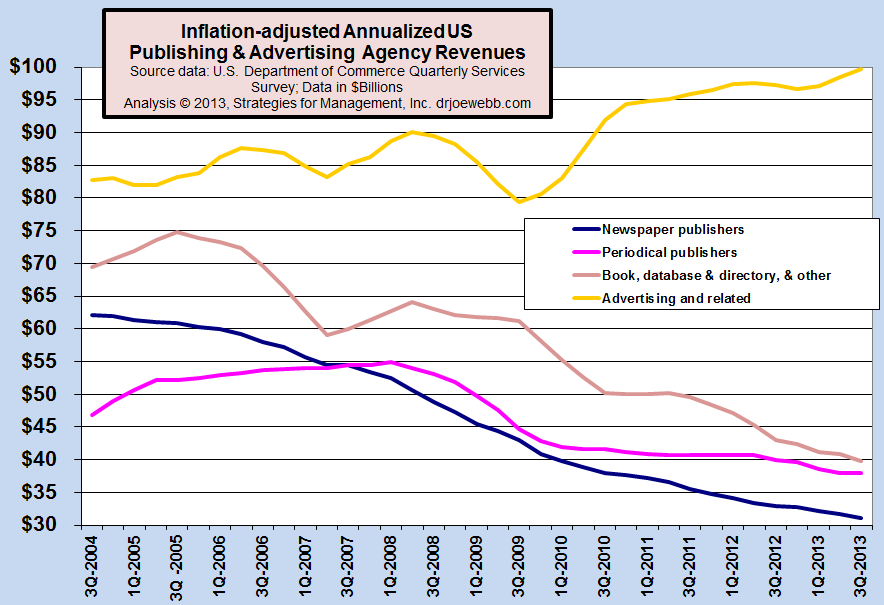
Inflation-adjusted Annualized US Publishing & Advertising Agency Revenues
Published: January 14, 2014
This chart shows the inflation-adjusted revenue trends for selected content-creation businesses. Note how advertising revenues have increased despite the declines in the revenues to publishers. Agencies have shifted much of their efforts to developing “earned media” (a/k/a search engines, social media, e-marketing and numerous other digital formats), and the production of it. Full Analysis
Six Consecutive Profitable Quarters for U.S. Commercial Printing Businesses
Published: June 15, 2011
The first quarter of 2011 continued a welcome continuation of profitability for the industry. The industry shakeout of unprofitable businesses, and the better management of healthier businesses continues to create an improved bottom line, but there are still great challenges ahead. The restructuring of the industry will be a continuing process in 2011 and beyond. Full Analysis
April 2011 U.S. Commercial Printing Shipments Down
Published: June 9, 2011
April 2011 commercial printing shipments were $7.08 billion, down -$109 million (-1.5%) compared to 2010. Adjusting for inflation, shipments were down -$366 million (-4.5%). Full Analysis
March 2011 U.S. Commercial Printing Shipments Up; Twelve Months of Increases
Published: May 6, 2011
March printing shipments were up, resulting in 12 consecutive months of increase. Dr. Webb explains how the easy comparisons to the prior year are about to end, and that the balance of 2011 will be about the same as 2010. He reviews the upcoming data revisions from the Commerce Department on May 13, the importance of inflation adjusting company financial data, and the shipment rates of Canada's commercial printing industry. Full Analysis
U.S. Commercial Printing Businesses Produce Estimated $1.11 Billion in Profits in Fourth Quarter 2010
Published: April 6, 2011
Dr. Joe Webb has compiled reports on US commercial printing profits going back to 1995, and brings it all current to Q4 2010. This report examines the latest trends in shipments, profits and capacity for the industry, of which the Federal Reserve just made revisions going back almost 25 years. How does Joe recommend printers steer the course? What will it take to get the print industry out of the hole? Dr. Webb has insights that can help. Full Analysis

February 2011 U.S. Commercial Printing Shipments Up +4.4%, Eleven Months of Y-O-Y Increases
Published: April 5, 2011
Dr. Webb looks at February's shipments, Canada's January shipments, and updated forecasts for the North American printing industry to 2017. There's an updated GDP Forecast model and commentary on why that model is not totally reliable for forecasting the print industry. Will the rest of 2011 be as positive as January and February? Dr. Joe discusses. Full Analysis
January 2011 U.S. Commercial Printing Shipments Up +4.1%, Good Start to New Year
Published: March 10, 2011
Dr. Webb comments on what the forecasting models are projecting for shipments out to 2017. The podcast also includes an analysis of how the industry has changed between 2000 and 2009 based on the latest data from the Commerce Department. Full Analysis
This is the Last Page


![]()

WhatTheyThink is the official show daily media partner of drupa 2024. More info about drupa programs
© 2024 WhatTheyThink. All Rights Reserved.