Data Analysis
Twenty-one Months of Consecutive Increases for US Commercial Printing Shipments
Published: April 6, 2016
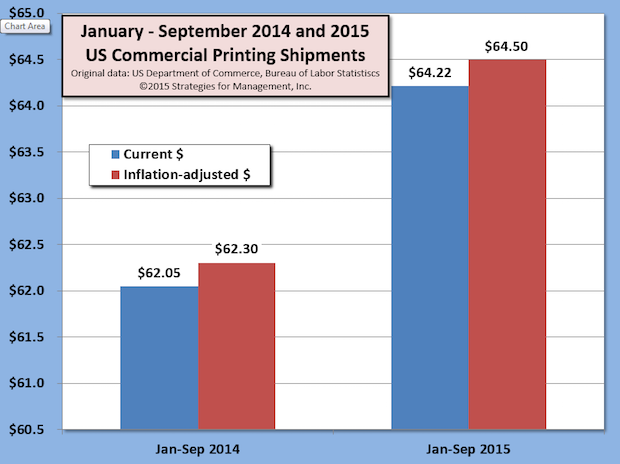
The US Department of Commerce issued its latest report of US commercial printing shipments (NAICS 323) and the data show 21 consecutive months of positive comparisons to the prior year current dollar shipments. The trend started with June 2014, and has been an average increase of +3.3%, +$225 million per month, for that period. Full Analysis
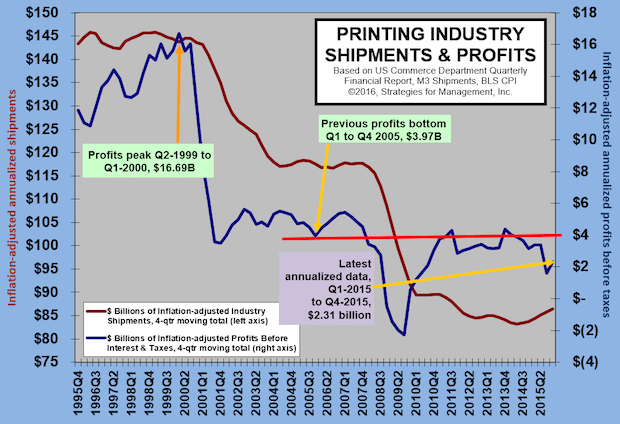
Printing Profits Rebound (A Little)
Published: March 31, 2016
Profits bounced back from a terrible third quarter which had an industry-aggregate loss of -2.57% as a percentage of revenues, and went back up to a more reasonable 4.38%. The difference was the massive writedowns of the third quarter which resulted in a -10.97% loss in printing companies with more than $25 million in assets. Full Analysis
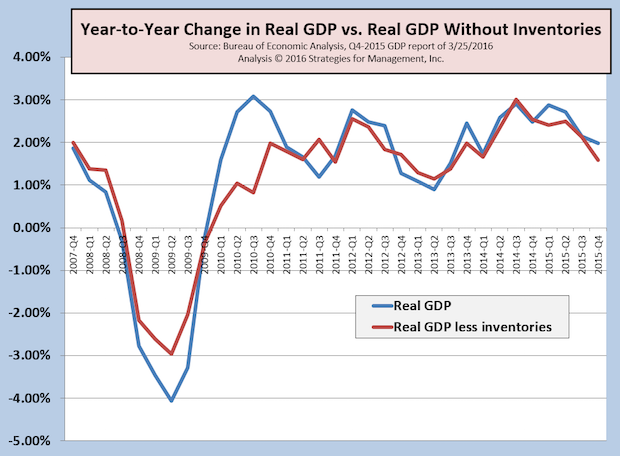
Third Look at 4Q-2015 GDP Revised Up, Atlanta Fed Q1-2016 GDP Estimate Plummets
Published: March 30, 2016
In a clear case of dealing with a two-handed economist when asked about economic conditions, the Bureau of Economic Analysis increased their estimate of fourth quarter GDP to +1.4%. The initial report was +0.7%, and then it was revised to +1.0%, and now it is +1.4%. They were off only by $100 billion from the first report, greater than the size of the printing industry, just to add some perspective about how big the US economy is. Full Analysis
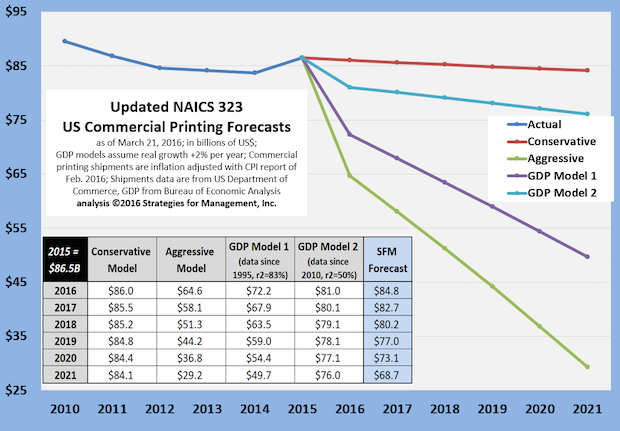
Updated Commercial Printing Forecasts to 2021
Published: March 24, 2016
Now that 2015 data are complete, we have run the forecasting models again and present them in this chart. Full Analysis
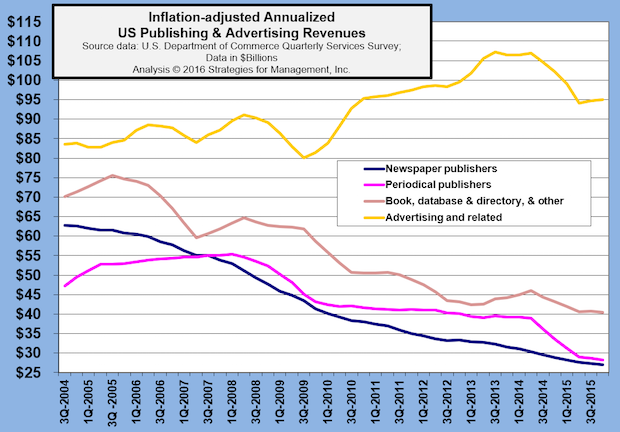
Advertising Agency Revenues Have Major Revision Down for 2013 & 2014, but Remain in Long-term Uptrend
Published: March 17, 2016
The US Department of Commerce released its latest Quarterly Service Survey last week, and it reduced shipments for the third quarter of 2013 by -$4 billion (whoops – a -15% statistical error). Full Analysis
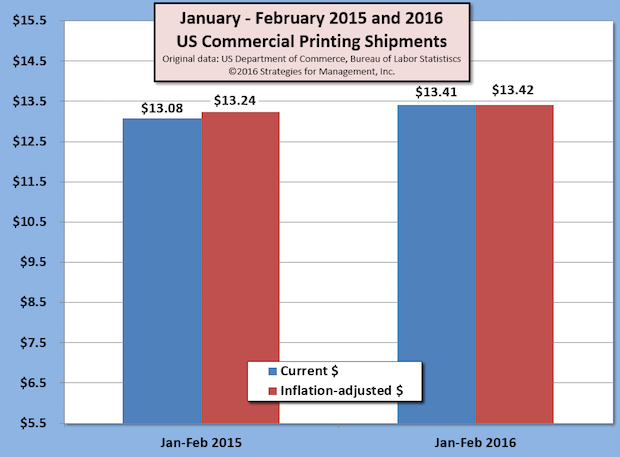
Is the Positive Run for Commercial Printing Coming to a Close?
Published: March 10, 2016
The latest printing shipments were discussed in the “Mondays with Dr. Joe” of March 7. The chart offers more details. Revenues turned around on a current dollar basis with June 2014 shipments (blue line) and the positive comparisons to the prior year kept going until the most recent report, January 2016. In current dollars, January’s shipments were barely above those of 2015, keeping the positive comparison streak intact. Full Analysis
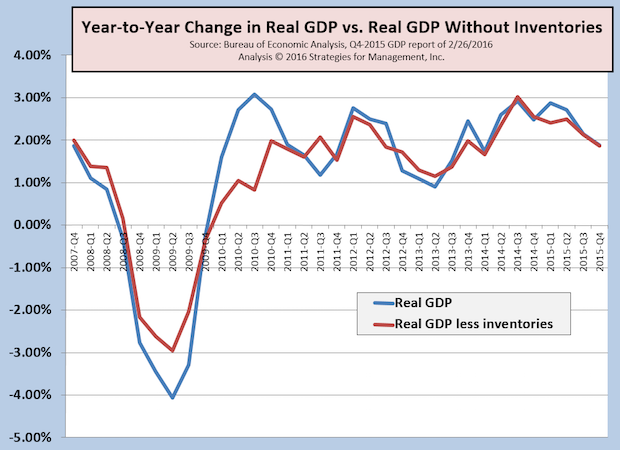
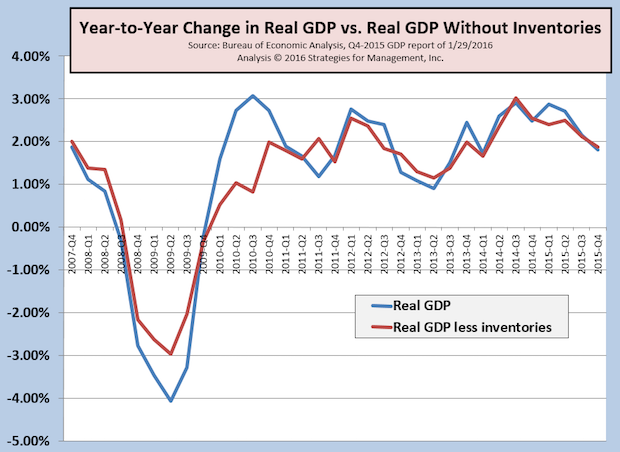
4Q-2015 GDP Revised Up from +0.7% to +1.0%, But Not as Good as It Seems
Published: March 1, 2016
The second estimate of fourth quarter GDP was revised up from +0.7% to +1.0%, mainly from an increase in net inventories. This factor in the GDP calculation is volatile, so we track GDP with and without it to get a perspective of the underlying GDP rate from a long term perspective in a year-to-year comparison. Full Analysis
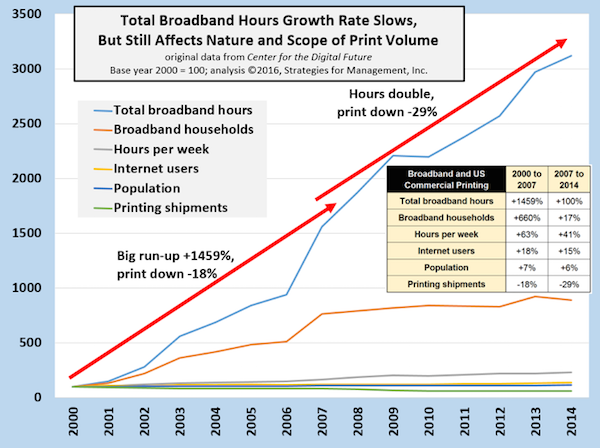
Broadband Hours and US Commercial Printing
Published: February 26, 2016
In 2014, US per capita hours using broadband is just over 900 per year (2.5 per day), and that's the entire population. The number of total hours has doubled since 2007. The population has grown in that period, but the average number of hours online per week has gone from 15.3 to 21.5 in 2014, and households with broadband connections grew from 76% to 89%. The cumulative effect has had most of its effect on mainstream commercial printing, especially information materials used for promotion and product support and advertising-funded products like magazines and catalogs. Printing's use is becoming more tactical, focused on specialty uses of printed images with higher expectations for impact, especially in concert with other media. Full Analysis
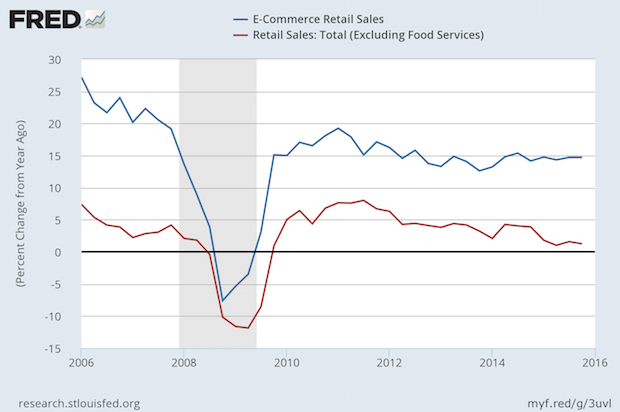
E-Commerce Retail Sales Still Growing at Nearly 15% Per Year
Published: February 18, 2016
E-commerce sales of all types, including industrial products, is still growing at a rate just under 15% per year. Full Analysis
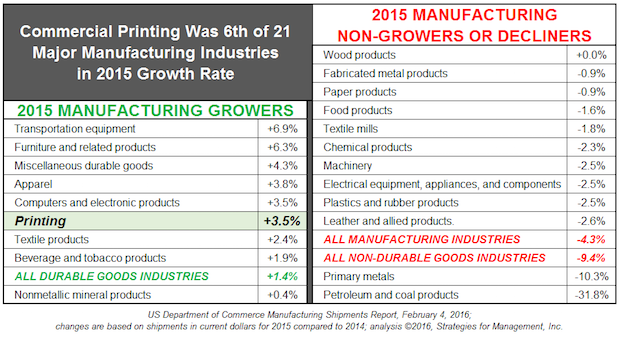
Printing Was 1 of 8 Major Manufacturing Industries with Positive Growth in 2015
Published: February 11, 2016
Part of print's good 2015 was how well it did compared to other industries. Of 21 major manufacturing industries, nine had positive years in current dollars, with commercial printing as sixth highest. Precipitous decreases in commodities prices caused manufacturing in metals and energy to have such a bad year that the entire manufacturing sector declined -4.3%. For the year, current dollar GDP growth was +2.9%. For the first time in twenty years, commercial printing growth exceeded GDP. Full Analysis
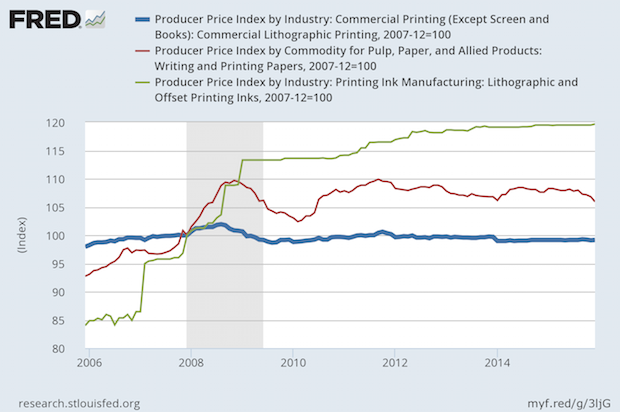
Commercial Printing Prices Less Than December 2007; Paper and Ink Higher
Published: February 4, 2016
Since December 2007, the CPI is up by +12.6%. How have the PPI for commercial printing, ink, and paper changed? Commercial printing prices are lower, -0.8%. This means that a commercial printing business has to increase its productivity and profitability to reward its owners and employees to make up for the loss of purchasing power they have in their paychecks. Full Analysis
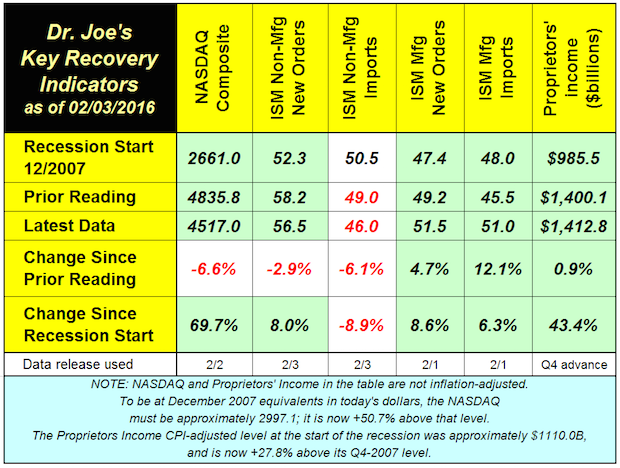
Recovery Indicators Show Economic Slowdown Underway
Published: February 4, 2016
The monthly recovery indicators were uneven again. The NASDAQ fell almost -7% in the last month, and ISM non-manufacturing new orders and imports also declined. Full Analysis
4Q-2015 GDP Disappoints at +0.7%; 2015 GDP +1.8%
Published: February 1, 2016
Real Gross Domestic Product (RGDP) for the US increased by an annual rate of +0.7% in the fourth quarter of 2015. On a year-to-year basis, RGDP was up +1.8%. Full Analysis
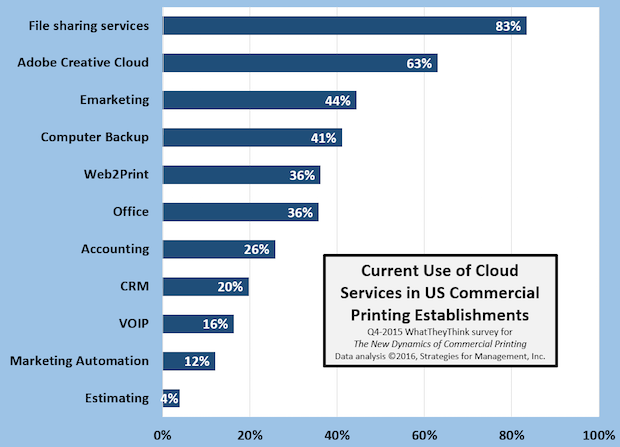
Cloud Product Usage in the Printing Industry
Published: January 28, 2016
The chart shows the percentage of US commercial printing establishments of all sizes and their responses to the question about the cloud-based services they use today. The question did not ask them their frequency or intensity of use, just whether or not they use it today. Some of the “non-users” may not even be aware that they are using cloud services, since some services run transparently in the background, such as backup services like Carbonite and others. Others may not be aware that they are using a VOIP phone system. Some cloud services such as Dropbox allow customers to brand their service so it looks like a company file sharing site. Generally, larger printers are using more cloud services than others, but the disparity is narrow. Full Analysis
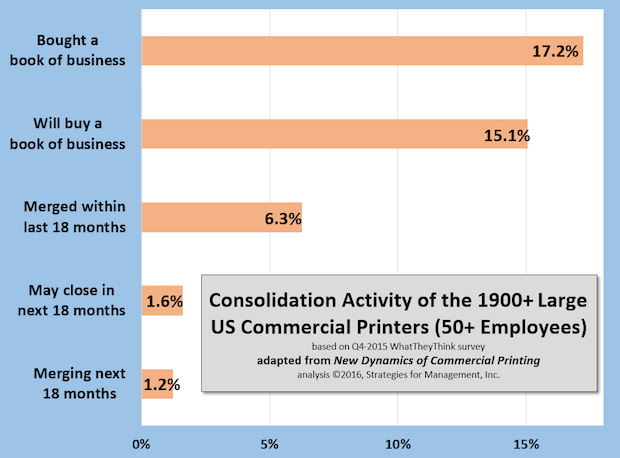
Consolidation is Somewhat Different Than Industry Common Wisdom
Published: January 21, 2016
Here are data from our survey at the end of 2015 where we asked respondents to identify the status of their companies in terms of consolidation. Generally, formal consolidations are executed by the largest print businesses, and small businesses close their respective shops and reopen a new business with new partners. Full Analysis
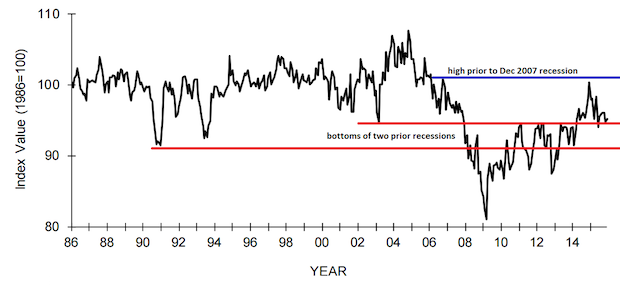
NFIB Small Business Index Still Shows Weak Small Business
Published: January 14, 2016
The latest survey of NFIB shows their index bouncing along the level of the early 2000s recession low, and down from the high prior to the December 2007 recession. Passing that level on the way up would have indicated a completed recovery of this sector but it just couldn't make it that far and break through. Using this indicator that means that small business did not emerge from the recession yet. Big business and the stock markets dominate the headlines, but small business remains the front line of the economy, and its difficulties are often hidden from view as being un-newsworthy. Its breakout above the bottom of the early 2000s recession took some time, and the recent trend in the chart looks like it's getting ready to fall below that again. It dipped below that level briefly a few months ago and climbed back out. Will it climb out again? It's worth watching. Full Analysis
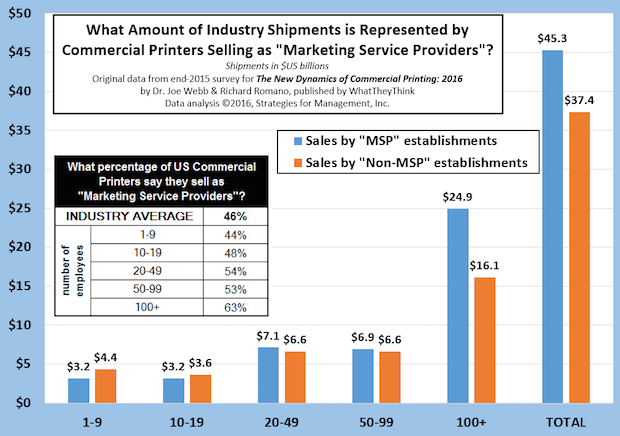
What Share of Shipments is Sold by “Marketing Service Providers”?
Published: January 7, 2016
For about a decade, many print businesses have marketed themselves as “marketing services providers” with varying degrees of success. Our recent survey showed less than half of print businesses market themselves in this or a similar manner. Full Analysis
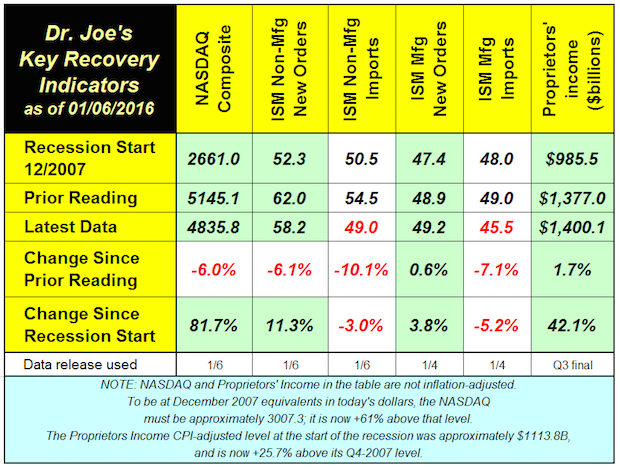
Recovery Indicators Look More Like Recession Indicators – Are They?
Published: January 6, 2016
Are the recovery indicators becoming recession indicators There's enough negative news of late to be wary about the state of the economy, and a lengthening list of geopolitical issues, for sure. Full Analysis
Eighteen Months of Industry Growth, Beating the Economy, Too
Published: January 6, 2016
US commercial printing industry shipments are up for 18 consecutive months in current dollars compared to the corresponding month of the prior year. Full Analysis
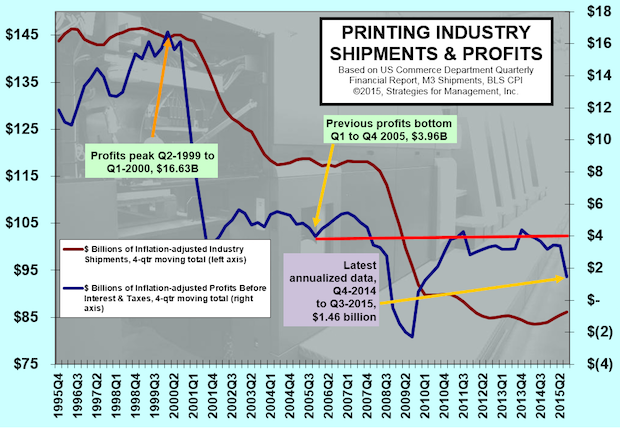
Printing Profits Dive as Large Printers Have Massive Writedowns
Published: December 22, 2015
The third quarter of 2015 marked a huge divergence in the performance of the industry, according to the Department of Commerce Quarterly Financial Report. Printers with more than $25 million in assets wrote down assets amounting to nearly -15% of revenues. This sent the quarterly moving total of inflation-adjusted profits before taxes to +$1.46 billion. Full Analysis
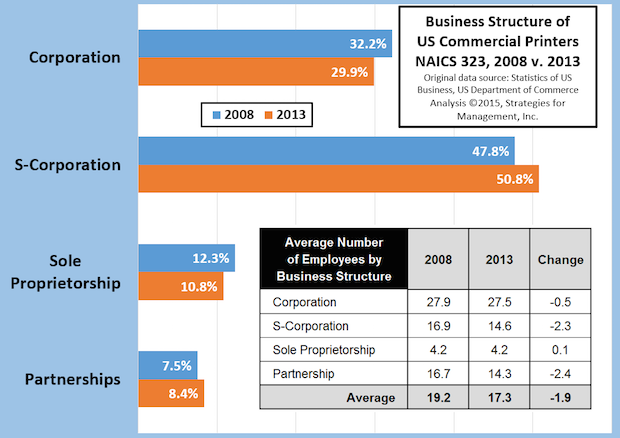
How the Business Structure of Commercial Printers Changed from 2008 to 2013
Published: December 17, 2015
The recession started just before 2008 was beginning and the latest data from the County Business Patterns report shows how the business formats of the industry changed by 2013. Full Analysis
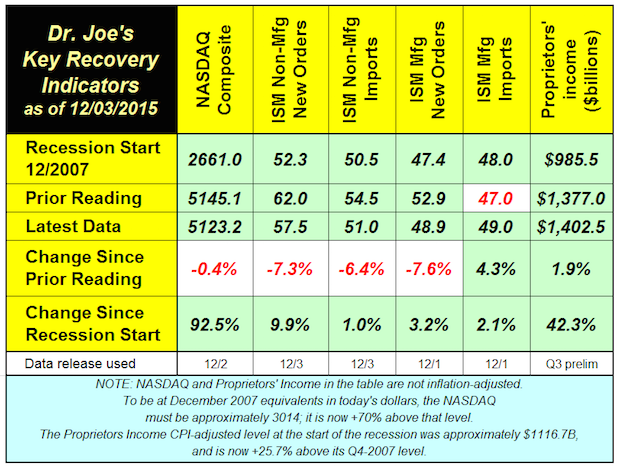
Recovery Indicators Cause Concern
Published: December 3, 2015
The recovery indicators turned in a mixed performance that warrants some caution, concern but not worry, yet. Some outside economic analysts starting to raise concerns about the economy in 2016. Citibank analysts peg the chances of recession in 2016 at 65%, the first such prognostication of a major investment firm that we have seen. Full Analysis
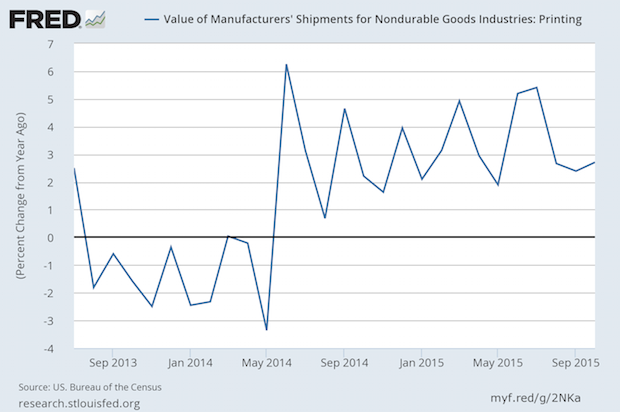
US Commercial Printing Shipments Have a Strong October, +$204 Million
Published: December 3, 2015
For 17 consecutive months the US commercial printing industry has scored increased shipments compared to the same month of the prior year. In current dollars, the Commerce Department reported that shipments were $7.729 billion. That meant that October 2016's shipments were +$204 million compared to 2015, a +2.7% performance. For the year through October, shipments are +3.3% on a current dollar basis. Full Analysis
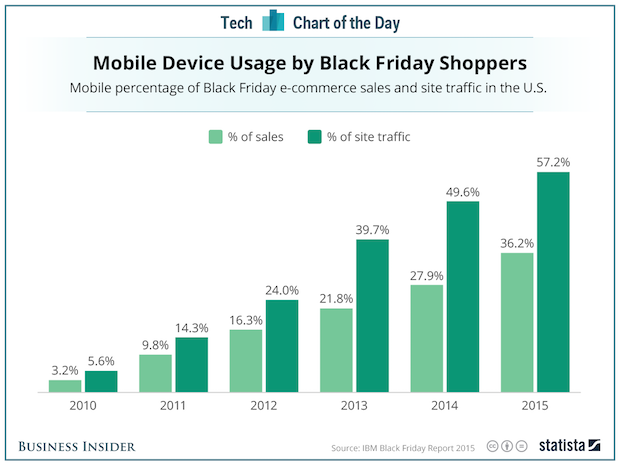
Mobile Plays Big Role in Black Friday
Published: December 3, 2015
The rise of mobile marketing has been long expected, and it looks like Black Friday 2015 is key milestone: mobile was more than half of web site traffic for e-commerce sites. Black Friday “brick-and-mortar” traffic was disappointing, but retailers were aggressively pushing sales online because it reduces the risks of riot-like runs for bargains as stores open. Target Stores had so much online traffic for CyberMonday its servers could not handle the volume. It wasn't the first time that Target misforecast demand for online sales. Some of Black Friday shopping may have been “window shopping” for mobile ordering. IBM, which still has a big business in systems for retailers issued a free download report about what was learned on Black Friday. In that report is the chart we highlight this week. If you sell to retailers or to businesses that sell to retailers, the report is worth reading. Full Analysis
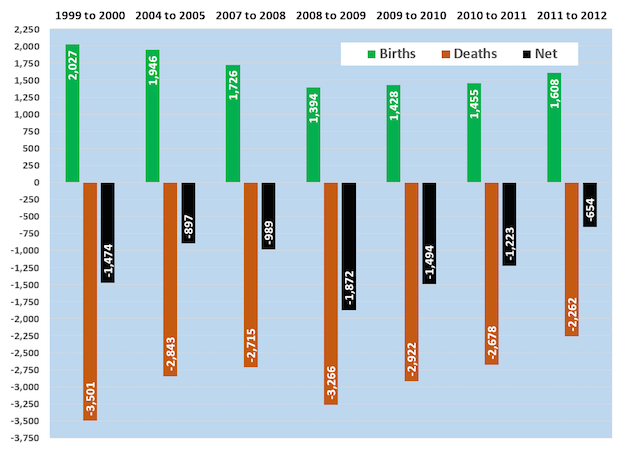
Printing's Birth-Death Data Show Improving Industry Health
Published: November 19, 2015
Even the usual industry dynamics are dynamic. The latest commercial printing industry birth-death data comparing 2012 to 2011 show a rising birth rate and a declining death rate. The +1608 births and -2262 deaths in 2012 were recent lows, as was the net change of only -654 establishments. Full Analysis
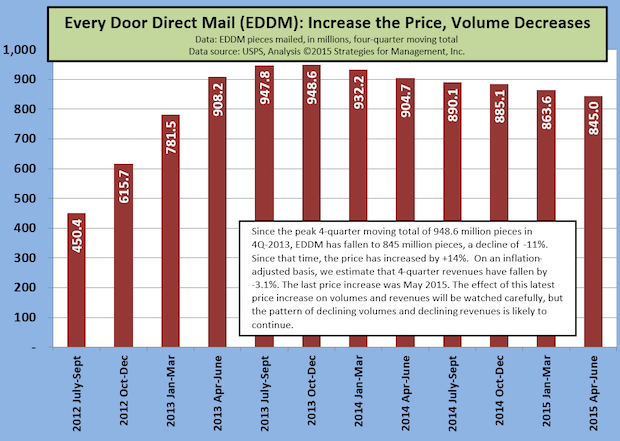
USPS EDDM Volume Decline Continues
Published: November 13, 2015
What could be an important product for local retailers to make their baby steps into direct mail, keeps declining as the USPS raises prices on the Every Door Direct Mail (EDDM) service. Full Analysis
Recovery Indicators Bounce Back
Published: November 9, 2015
The recovery indicators had a better month than last. Five of the six indicators increased and one fell below the level of the start of the recession. New orders for manufacturing and non-manufacturing were impressive in their increases, in stark contrast to government reports about September's durable goods and factory orders. Full Analysis
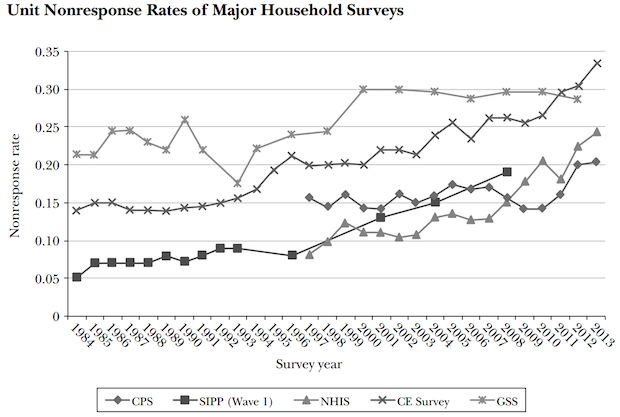
Can We Trust Government Data?
Published: November 5, 2015
A recent academic paper published in the Journal of Economic Perspectives (Volume 29, Number 4, Fall 2015), “Household Surveys in Crisis,” illustrates the problems of government surveys that are used to make multibillion dollar and multiyear decisions of government and business. Full Analysis
Third Quarter US Commercial Printing Shipments Have Highest Growth Rate Since 1996
Published: November 4, 2015
The US Commerce Department reported that commercial printing industry shipments are up for 16 consecutive months in current dollars compared to the same month of 2014. Full Analysis
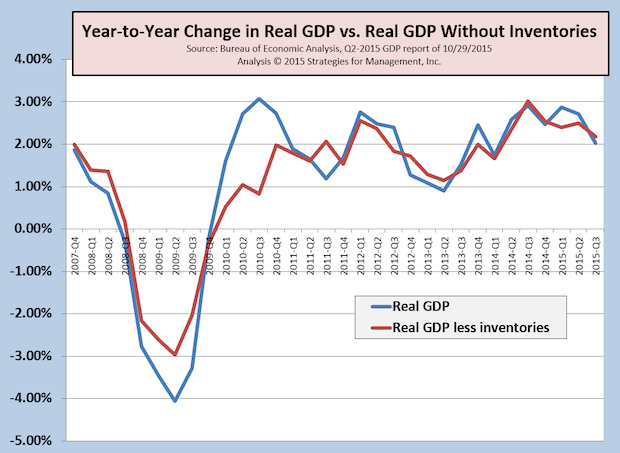
Third Quarter GDP Not Good, but Better Under the Surface
Published: October 29, 2015
The advance estimate of third quarter 2015 real GDP is +1.5%. We much prefer the year-to-year comparison, and also without the fluctuations of inventories. Those figures, also indicated in the chart, are +2.03% and +2.18% respectively. Net inventories have been running very high, but in the third quarter were $56.8 billion. This figure was cut in half from Q2, and is close to the 2010 to 2014 average. Full Analysis
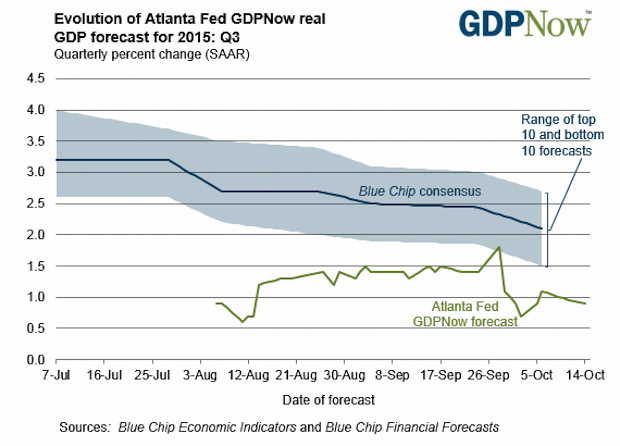
Recession Coming? Third Quarter GDP Looks Weaker than Experts Forecasted
Published: October 22, 2015
The latest estimate (October 20) by the Atlanta Fed's GDPNow model indicates that third quarter GDP will be +0.9%. That is, until the next data for their model comes in.
Full Analysis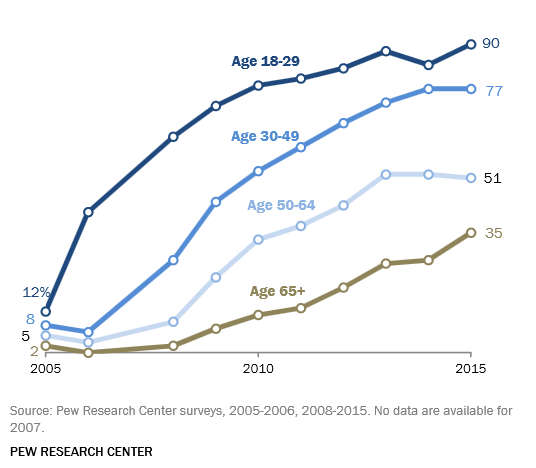
Pew Internet Survey Shows Social Media Use Up, Way Up, in Last Ten Years
Published: October 15, 2015
The Pew Internet Survey has released their latest survey (free download) of social media use and the long term trends are striking. The organization started tracking use in 2005 when social media use was by just 7% of the US population. Now, 65% of adults use social networking sites. Our chart shows the increases by age group.
Ninety percent of those between 18 and 29 use social media, which is not a surprise. Those social media users who are 65+ has more than tripled from 11% in 2010 to 35% in 2015. The report includes data about social media use by various demographics including income, race, gender, community, and education.
Full Analysis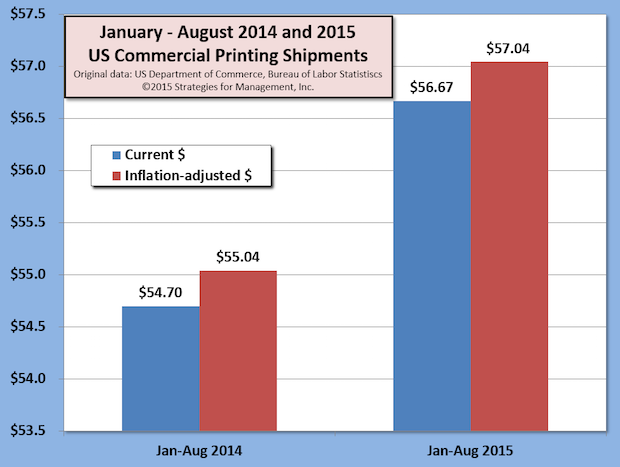
Commercial Printing Shipments in Uptrend: 15 Consecutive Months of Growth, Best Growth Rate Since 1996
Published: October 14, 2015
US commercial printing industry shipments are up for 15 consecutive months compared to the same month of the prior year. Full Analysis
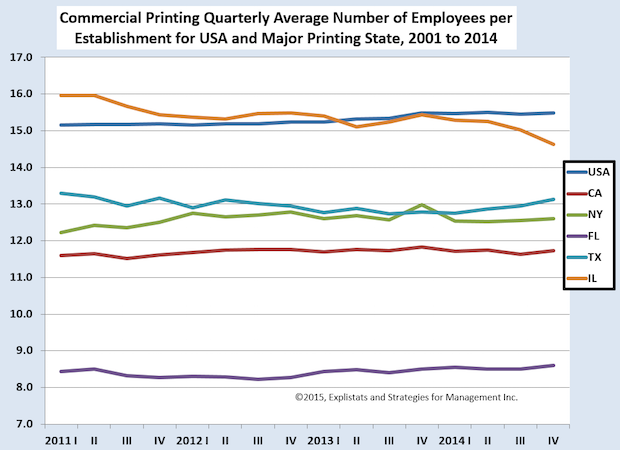
Changes in Commercial Printing Employment by State
Published: October 8, 2015
The chart shows the changes in the average number of employees per establishment in the US and large printing states. The average size of printing businesses in an area offers clues to the kinds of printing produced there and the history of the industry in that area. Full Analysis
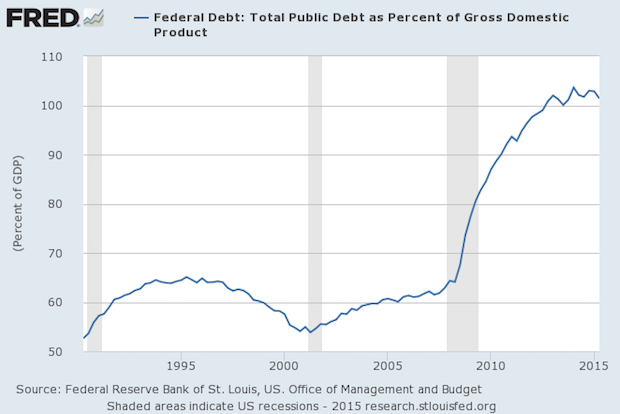
Debt as a Percentage of GDP
Published: October 2, 2015
Many people confuse debt and deficit when they see it as part of the Federal government's annual budget. Deficit is the annual shortfall between a government's spending and its revenues. Debt is the accumulation of all of the deficits and surpluses of the prior years in that government's history. Full Analysis
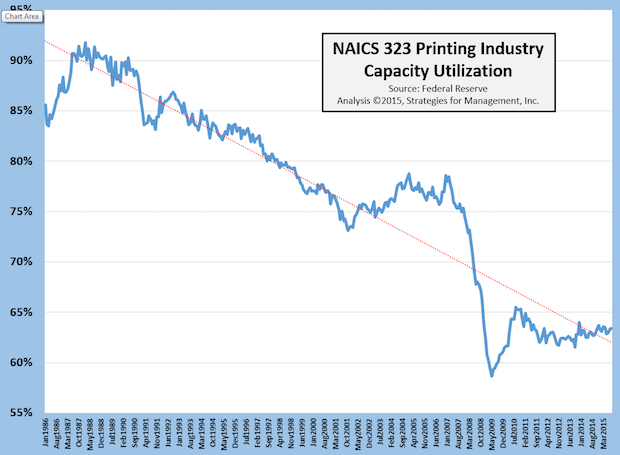
Updated Printing Industry Capacity Utilization Data – Not What Everyone Thinks It Is
Published: October 1, 2015
Even in the industry's most profitable and growing years, the mantra “there's too much capacity in the industry” was always heard. It's been a misplaced and inaccurate portrayal of the business, yet it persists. Full Analysis
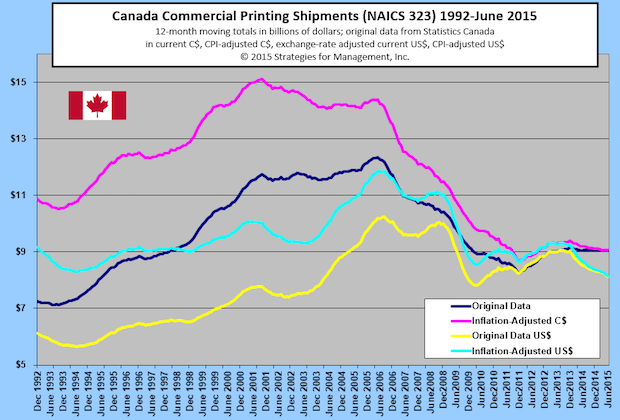
Canada's Commercial Printing Shipments
Published: September 17, 2015
Canada's commercial printing industry had a small rebound more than three years ago, before that of the US, and has been on a somewhat steady course since. In US dollars, however, Canada's gains market have been erased recently with the stronger dollar. Full Analysis
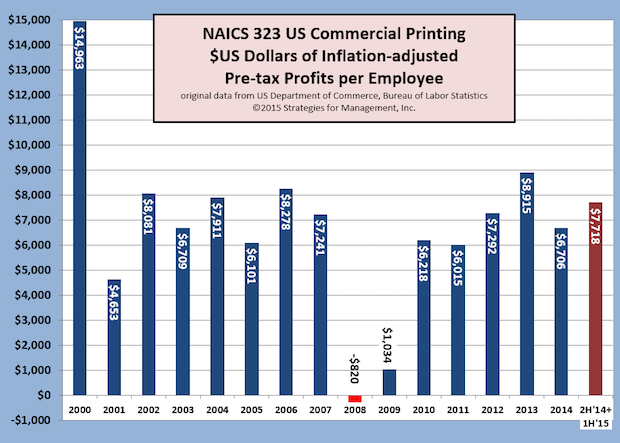
Profits Per Employee Increase
Published: September 10, 2015
The nearly $15,000 profit per employee of 2000 may not be in the cards for the US commercial printing business any time soon, but it looks like this measure is headed to its second best performance since the end of the recession. Using the latest data for the second quarter of 2015, and adding the previous three quarters to create a full year, profits per employee seem to be headed to $7,700, a thousand dollars more than the level of 2014. Full Analysis
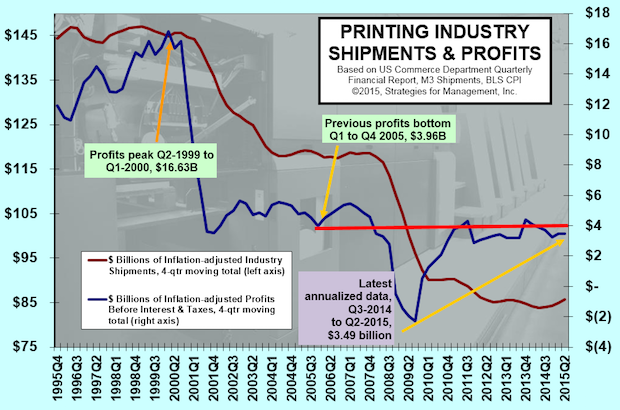
Improvement in Industry Shipments, Profits Improvement Elusive
Published: September 9, 2015
The 4-quarter moving total of inflation-adjusted US commercial printing shipments have been increasing, but unfortunately profits have not. Q2-2015 four-quarter shipments are up +2.3%, but profits are unfortunately down for the last four quarters -10.8%. Full Analysis
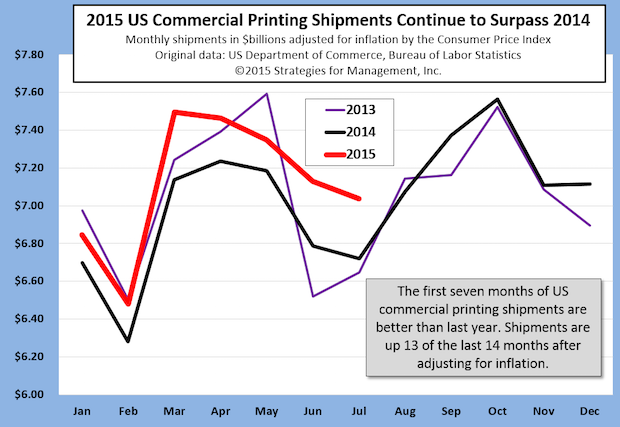
Latest Printing Shipments Reflect Rebound
Published: September 3, 2015
July's inflation-adjusted US commercial printing shipments continued to outshine prior year shipment levels. This was the best July since 2008 on a current dollar basis and since 2010 on an inflation-adjusted basis. On average, monthly industry shipments have been about $200 million higher than the year before. They are also tracking closer to GDP growth rates, a feat the industry has not done for almost two decades. Full Analysis
Recovery Indicators Mixed with Slight Downward Bias; Sluggish Economy Remains
Published: September 2, 2015
Four of the six recovery indicators fell last month, but the non-manufacturing new orders indicator remained very strong. World markets had a rocky month, and the NASDAQ fell -7% since the last indicators. Full Analysis
US Commercial Printing Shipments Up for 14 Consecutive Months
Published: September 2, 2015
US commercial printing shipments were nearly $7.04 billion in July, a $392 million increase (+4.9%) on a current dollar basis compared to 2014. This was the strongest July since 2008. Full Analysis
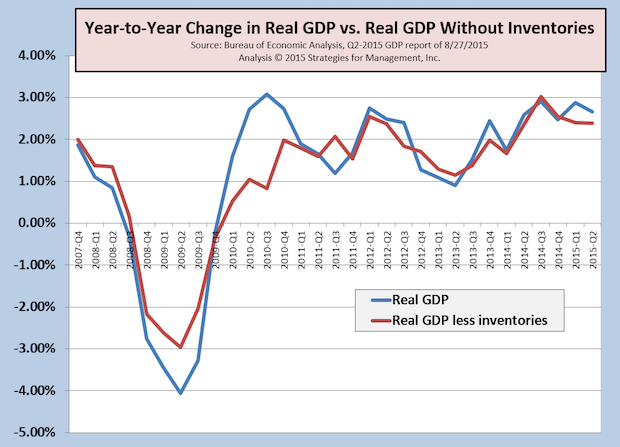
Q2 GDP Revised Up, Bigger Rebound from Q1... But What's Ahead?
Published: August 27, 2015
The first report of Q2-2015 real GDP was +2.3%, and now it's been raised to +3.7%, well ahead of forecaster expectations. On a longer-term year-to-year basis, the growth rate is +2.5%, still almost a full percentage point below post-WW2 average.
Longer term rate +2.5%. The effects of inventory increases is still a major factor in the growth, but there were other positives in the report implying that Q2 was broadly better than originally thought. There are concerns among professional forecasters that the inventory buildup will result in slower growth as those stockpiles are reduced. Considering that two thirds of the third quarter is almost complete, we know that international trade is being disrupted by currency and solvency issues in China and other countries. The Federal Reserve Bank of Atlanta GDPNow estimates that third quarter GDP will be at +1.4%. Please also note a recent chart where we showed important key indicators that have yet to surpass their recession levels from Q4-2007.
Full Analysis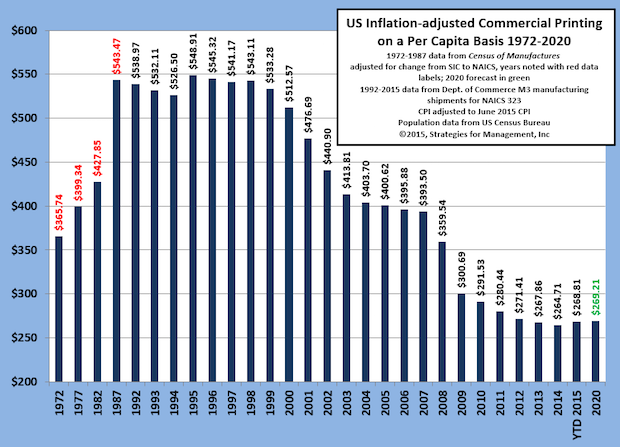
Per Capita Commercial Printing Shipments Stabilize; Forecast Models Project Levels to Continue
Published: August 20, 2015
The per capita value of US commercial printing shipments has stabilized at nearly $270, and the recent change in the direction of shipments in the last year or so has changed the forecasts. Forecast models place heavy weight on recent history, and that fact has changed the forecast for 2020 to remain at current levels. It was not long ago that the models forecast 2020 consumption at near zero, an unlikely outcome, but one worth pondering. Will shipments stay at these levels? That's unlikely, too, as media formats and loyalties are still changing.
Full Analysis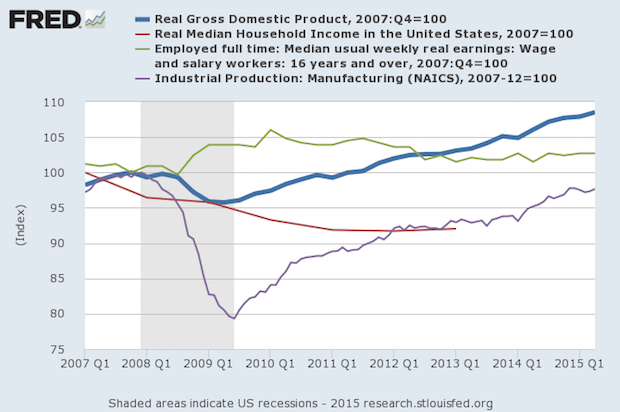
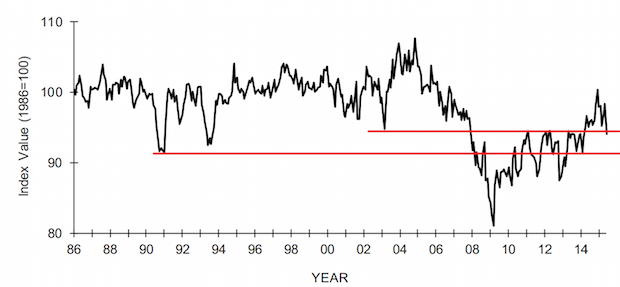
Key Indicators that Have Not Improved Since the Recession and Recovery
Published: August 14, 2015
There are numerous data series that explain that the economy has never recovered from the recession. These are not obscure data series, but mainstream ones. Gross Domestic Product should be the standard for determining the status of an economy (thick blue line). Movements in GDP should be confirmed by other measures. This week's chart uses the start of the recession, December 2007, as the base, which is 100. Full Analysis
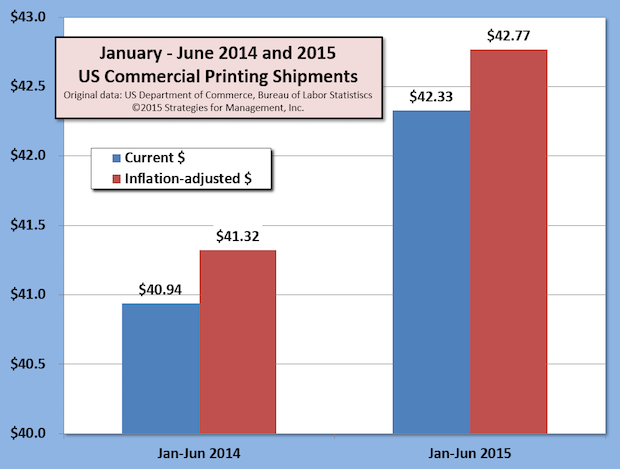
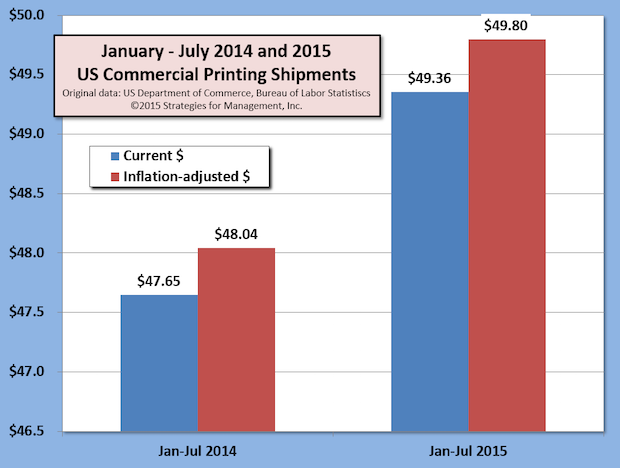
US Commercial Printing Shipments +3.5% for First Half of 2015, Exceeding Real GDP Growth
Published: August 6, 2015
US commercial printing shipments are up about +3.5% for January to June compared to the same period in 2014. The industry has been restructuring, as employment continues to decline. Usually employment and shipment levels move together in a tight range if not almost in lockstep. Full Analysis
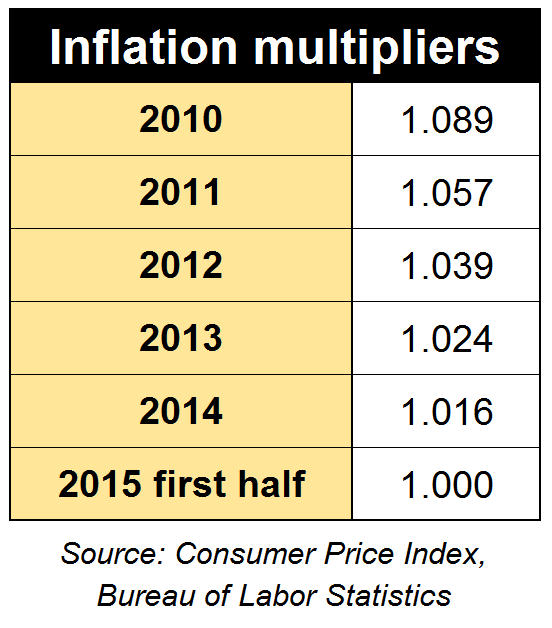
Inflation Multipliers Updated
Published: July 30, 2015
Inflation is supposedly tame, but if you're making comparisons of current year financial data to prior years, you still need to adjust for the years when inflation was not. The chart was created from Consumer Price Index data for each of the years specified. When looking at your company history, multiply your data for each year by the multiplier specified. This will give you an approximation for the effects of inflation on your business, and make your historical analysis, especially in the process of budgeting, to be more realistic. Adjusting your data, even in periods of claimed low inflation, creates a sense of more urgent action. Inflation means that to stay at the same level you actually need more dollars. Staying the same is actually a cut. Full Analysis
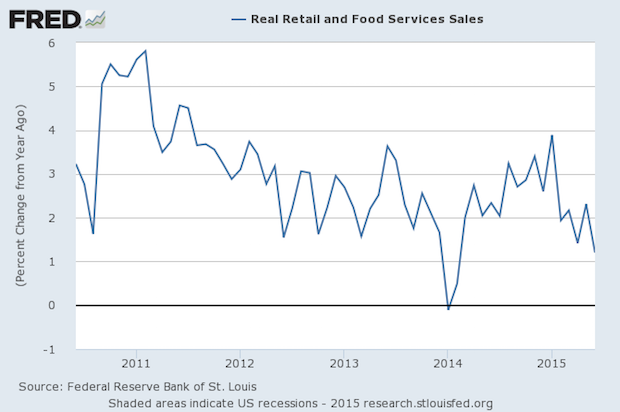
Year-to-Year Real Retail Sales Peaked in January, and Are Weaker Since
Published: July 23, 2015
June retail sales adjusted for inflation fell -0.6% compared to May. Month-to-month changes are somewhat volatile, so it's better to look at the comparisons to the prior year. The chart shows that June retail sales were +1.2% compared to last year, the worst comparison since March 2014. There are signs that the economy is slowing again. In the first quarter, real retail sales were +2.6% compared to the prior year, but this second quarter is only +1.6%. The economy always has conflicting positive and negative data, but this downturn in a key sector of the economy is likely to raise some eyebrows among economists and policymakers. Full Analysis
Is Small Business Slowing Down Again?
Published: July 22, 2015
The NFIB Small Business Index was released this week, “The weakness was substantial across the board, showing no signs of a growth spurt in the near future,” according to Bill Dunkelberg, NFIB Chief Economist. “Declines in spending plans accounted for 30 percent of the Index decline, and weaker expectations for real sales and business conditions another 20 percent. The deterioration in earnings trends accounted for about a quarter of the decline.” Full Analysis
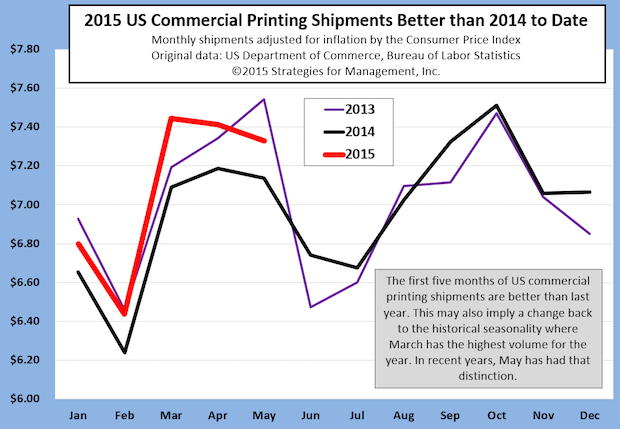
Inflation-adjusted US Commercial Printing Shipments Better than 2014
Published: July 10, 2015
Commercial printing shipments have been much higher than they are in today's market, but the bounce off the lows of 2014 this year have been notable. The comparisons toward the end of 2015 will be harder to top since the industry started to show this bounceback at the end of 2014. The transformation of commercial printing businesses has been an arduous one, with volume declines of many mainstream products, but a rise in specialty applications. Those new applications are often based in digital printing, such as wide format specialties. There's also a new generation of print business managers who are not burdened by the myopia of history, where print was paramount. These executives and owners have grown up with computers and gadgets and have a better sense of print's new role in media communications Full Analysis
This is the Last Page


![]()
- The Future of AI In Packaging
- Inkjet Integrator Profiles: DJM
- Spring Inkjet Update – Webinar
- Security Ink Technologies for Anti-Counterfeiting Measures
- Komori unveils B2 UV Inkjet
- Keeping Nozzles Fresh with Flow
- Komori to Unveil the J-throne 29 Next Generation Digital Press at drupa 2024
- Inkjet drives convergence of transactional and graphic arts applications

WhatTheyThink is the official show daily media partner of drupa 2024. More info about drupa programs
© 2024 WhatTheyThink. All Rights Reserved.