Data Analysis
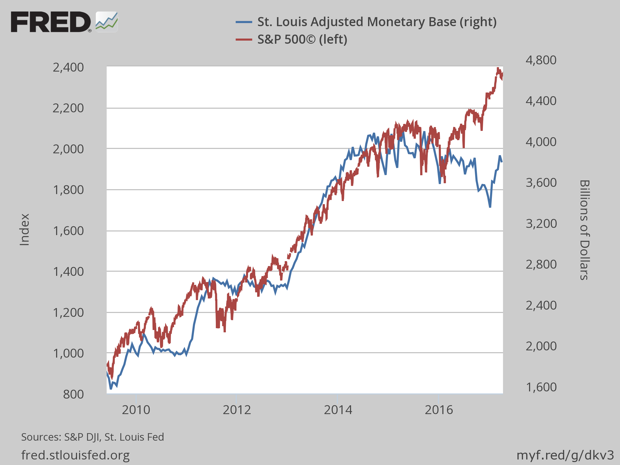
The Fed’s Balance Sheet and the S&P 500
Published: April 13, 2017
The financial markets were rattled a little bit by the recent minutes of the Fed meeting where they discussed the unwinding of their interventions and the ballooning of their balance sheet. The data are reflected in the St. Louis Fed Adjusted Monetary Base. The chart shows how the run-up in the S&P 500 stock index relates to the Fed’s quantitative easings Full Analysis
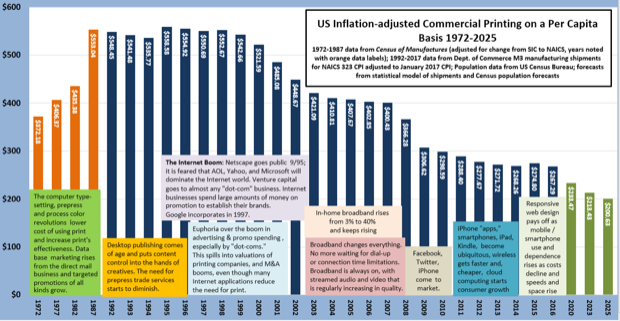
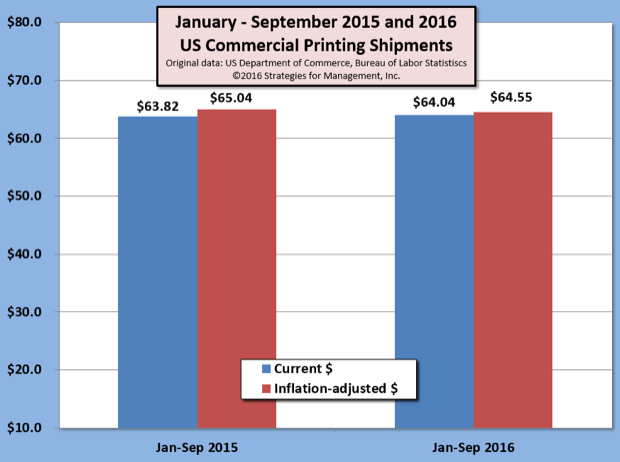
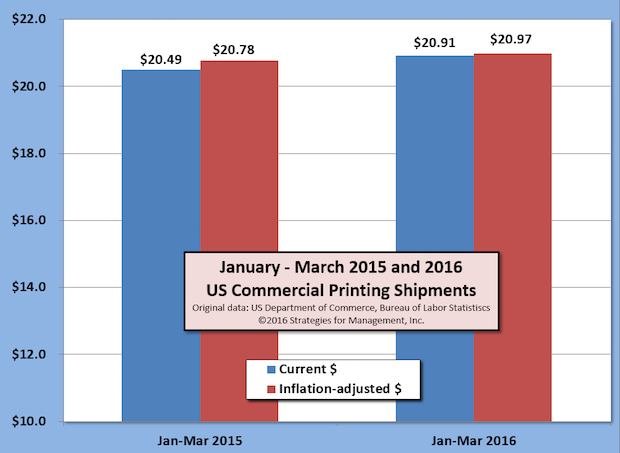
US Commercial Printing Shipments on a Per Capita Basis
Published: March 30, 2017
Yes, that sounds boring, but the data have been made interesting by including details about the last forty years or so of industry history and technological change. We added some statistical forecasts from our models that take the data out to 2025. When we started this chart almost ten years ago, those outlying years were near zero. They’re not any more (whew!). The data are inflation adjusted and based on the population data and forecasts of the US Census Bureau. It’s interesting how there are periods of relative stability, a change, followed by another period of stability. Technological change has been a much bigger factor affecting consumption than general economic conditions. Full Analysis
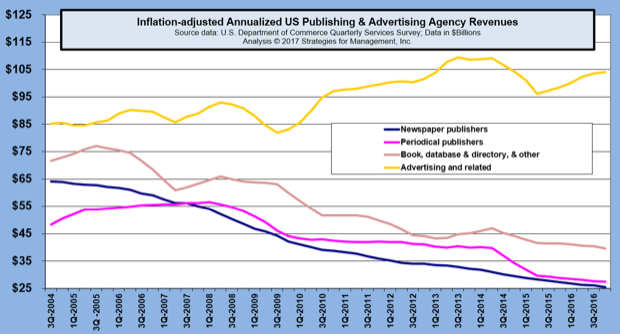
Ad Agency and Publisher Revenues
Published: March 23, 2017
Advertising agency revenues are having a slow rebound from their pullback in 2015. Publisher revenues are still having problems as ad pages and circulation are contracting. Clearly, agencies are finding other areas to garner revenues, especially in managing digital initiatives. Mobile communications are where their latest opportunities are, especially with website redesigns, creating the look and feel of content marketing for their clients, and assisting clients as they sort through the analytics that marketing automation offers. Full Analysis
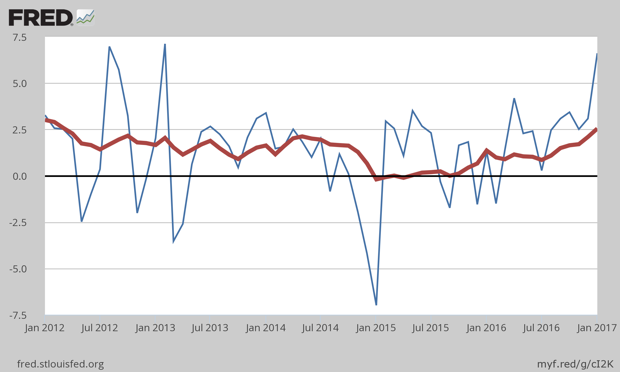
Consumer Inflation for 2016 at +2.5%, Giving Fed Reason to Increase Rates
Published: February 23, 2017
Consumer inflation for 2016 was increasing, with December’s reading +2.5% higher than 2015. December’s rate alone was at a +6.6% annualized rate. The chart shows the monthly comparisons as the blue line and the year-to-year comparisons as the heavier red line. Full Analysis
Employment Stalls; Printing Shipments Fall Sharply in December
Published: February 6, 2017
The national employment data may have had a headline of +227,000 payroll jobs, but the household survey did not indicate the same. Every year, the report released in February includes revisions to the prior year. The press release from the Bureau of Labor Statistics said that employment was “little changed.” Full Analysis
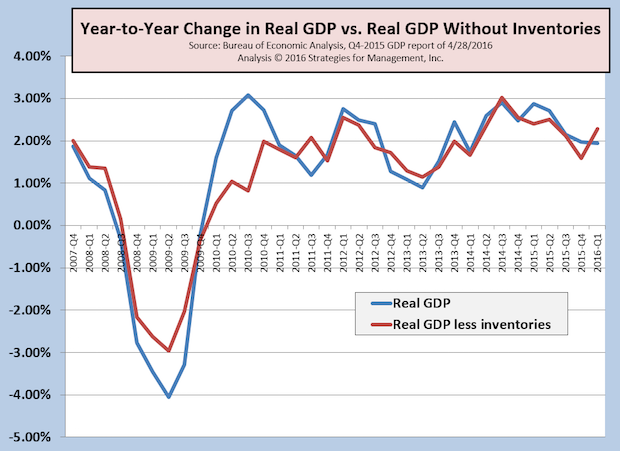
4Q-2016 GDP Slows to +1.9%, +0.9% Less Inventory Build-Up
Published: January 30, 2017
The fourth quarter of 2016 ended quiently, with a growth rate of +1.9% compared to the third quarter. That brought 2016 to an overall growth rate of +1.6%. Full Analysis
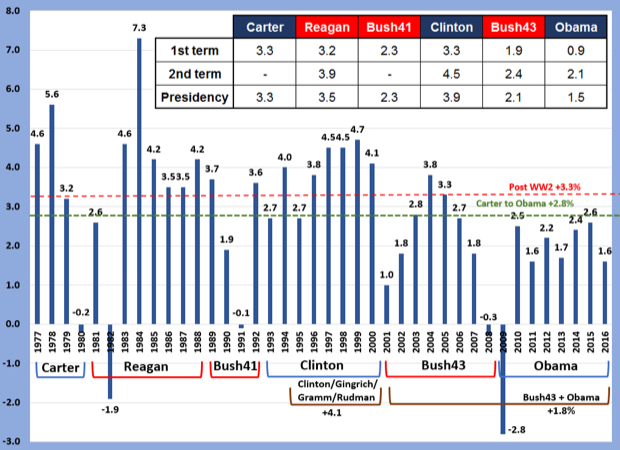
Real GDP for Six Presidential Administrations
Published: January 26, 2017
A new administration is in Washington, so we created a chart that looks back at general economic conditions of the prior six administrations. Full Analysis
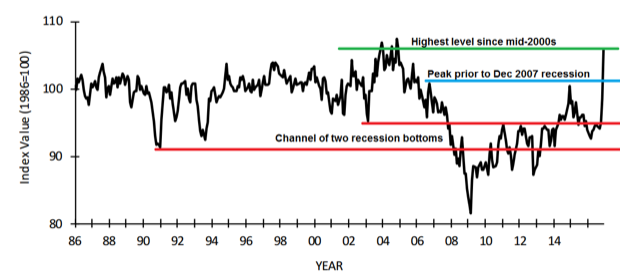
Small Business Index Rockets Up to Mid-2000s Level
Published: January 12, 2017
The NFIB's small business index came in at 105.8. It has had two months near-vertical increase, now at levels not seen since December 2004 when it was 106.1. It's sheer optimism that small business concerns about taxes, regulation, and the economy will improve. There are many reports about improved confidence, especially among consumers, but it seems like it's too much too soon. While the new administration might be able to provide some regulatory relief in its early days, most of its desired actions require acts of Congress. Those can sometimes take forever... or longer. Full Analysis
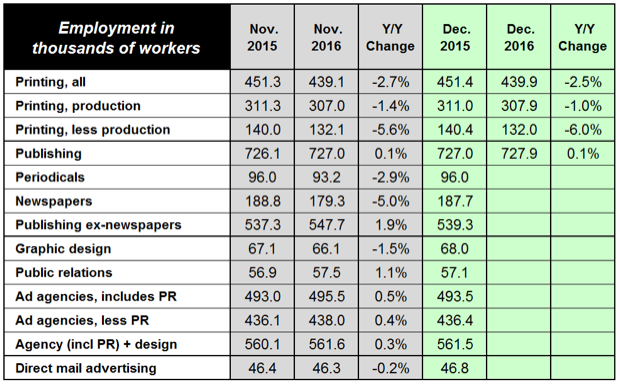
US Commercial Printing Industry Employment Finishes -2.5%; Consolidation Effects Evident
Published: January 11, 2017
The US commercial printing industry finished the year with 439,900 employees, down -11,200 compared to 2015. The number of production employees was down -3,100, a -1.0% decrease. Non-production employees represented the biggest change, down -8,400 (-6.0%). Full Analysis
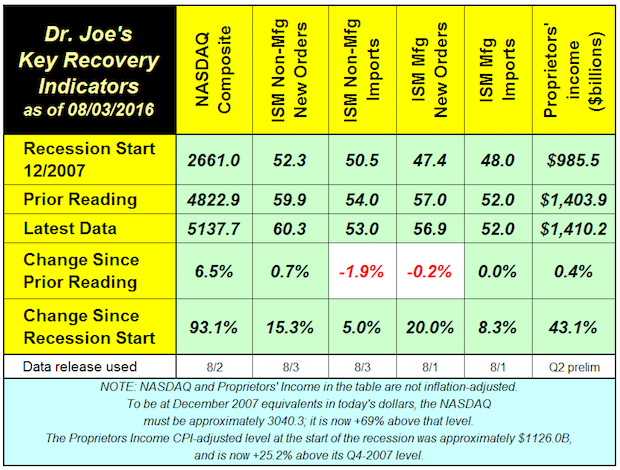
Recovery Indicators January 2017
Published: January 9, 2017
With the Dow Jones and S&P 500 at all-time inflation-adjusted highs. The recovery indicators are stronger than they have been in a while, with very bullish increases in new orders for manufacturing and non-manufacturing sectors, and a strong reading of the NASDAQ stock index. Full Analysis
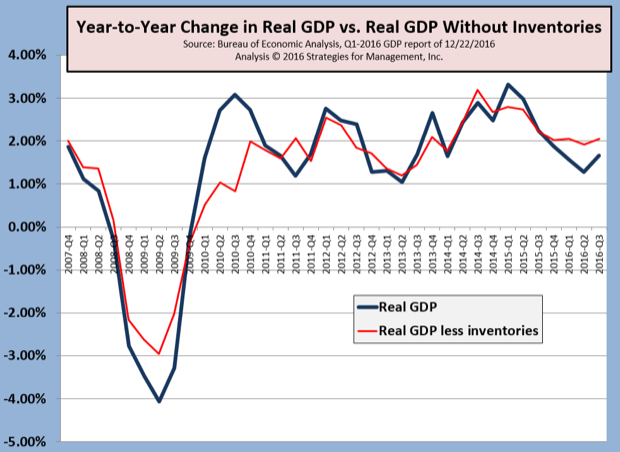
3Q-2016 Real GDP Revised Up Again; Did US Just Emerge from an Unrecognized Recession?
Published: December 22, 2016
The Bureau of Economic Analysis released its third report of real Gross Domestic Product, at an annualized +3.5% over the second quarter. This is considered the final report, revising the advance report of +2.9% two months ago, and +3.2% in last month's preliminary report. This is important because each release of GDP data is based on increasing amounts of actual reported data. The advance report relies the most on estimates and models. Full Analysis
Commercial Printing Inflation-Adjusted Shipments Per Employee
Published: December 16, 2016
The effects of consolidation, a challenging pricing environment, cost controls and productivity measures have sent shipments per employee to unprecendented levels. The prior peak was just before the recession began. The industry is more efficient in many ways, especially with the exit of weak and marginal establishments. But is it more profitable? In the December 15 webinar and in the new Forecast 2017 report, industry profit levels are discussed. Despite reaching new levels of sales per employee, profit levels have become tepid, a sign of tightening market conditions. In the webinar we discussed the possibility that another wave of media change is underway. The last major one was the rise of social media ten years ago, and now the growing impact of mobile media, especially this year. Full Analysis
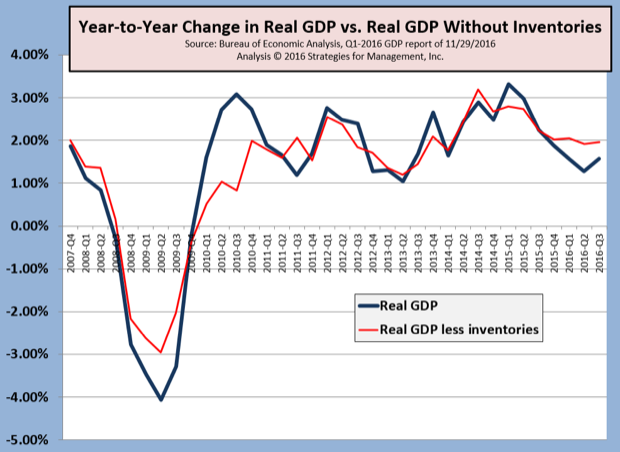
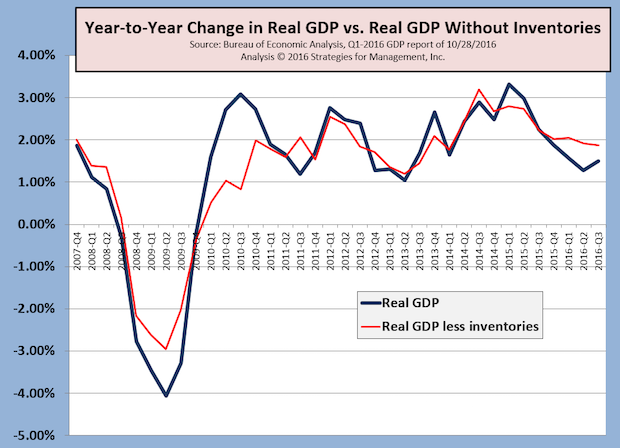
Q3-2016 Real GDP Revised Up from +2.9% to +3.2%; Little Change in Yearly Comparison
Published: December 1, 2016
The Bureau of Economic Analysis issued its second estimate of real gross domestic product, raising it to +3.2%. Real GDP for 2Q-2016 was +1.4%. Each advance release of GDP data is revised monthly as “more complete source data” is used rather than estimates. We prefer comparing GDP data to the same quarter as the prior year, which helps minimize the variation and possible distortions of seasonal adjustments. Compared to last year, Q3-2016 was +1.6%. Because inventory changes can distort GDP estimates, we also look at the data less inventories, and it shows the economy still hovering around a +2.0% growth rate. Lately, the inventory adjustments have been small. Theoretically, they should be zero in the long run, and for these last two quarters that has nearly been the case. In 2015, it averaged +$82 billion per quarter. Some of 2016's sluggish performance has been an inventory adjustment in the overall economy. The Atlanta Fed's GDPNow estimate for the current Q4 is running at +2.4%. Full Analysis
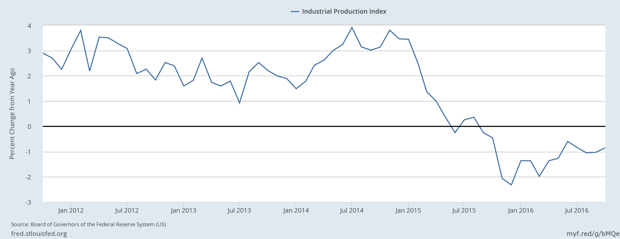
Fed's Industrial Production Index Down for 13 Consecutive Months: A Recession on Inauguration Day?
Published: November 17, 2016
Will the newly inaugurated President Trump be dealing with a recession like his predecessor did? In December 2008, a recession was declared, and the experts said it started almost a year before then. Several economic indicators, like durable goods orders and factory orders, have been negative compared to the prior year's level for almost two years. The Federal Reserve's Industrial Production Index released on November 16 marked its thirteenth consecutive negative comparison to the prior year. The only sector that is holding up in the GDP reports is the consumer side of that bookkeeping. That can't hold up for long unless the production and investment side of the GDP ledgers start to perk up. There is optimism in the markets about a Trump recovery, but it must be noted that there are many legislative hurdles ahead, and most economic plans take about 18 months to develop notable impact. Full Analysis
US Commercial Printing Shipments in Mild Downturn; Employment Consolidation Continues
Published: November 7, 2016
US commercial printing shipments for September 2016 were down -$8 million compared to the prior year (-0.1%). On an inflation-adjusted basis, shipments were down by -$118 million. Interestingly, inflation-adjusted August shipments were up by +$118 million, making the net change for the two months zero. Full Analysis
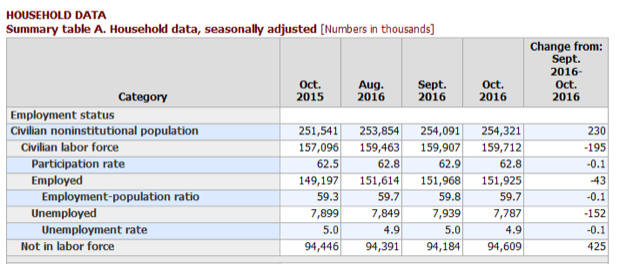
US Employments Report: Not What the Headlines Said
Published: November 7, 2016
The business headlines about the October employment report may have said “unemployment rate falls to 4.9%; payrolls grow +161,000,” but the details of the overall employment picture deteriorated. Full Analysis
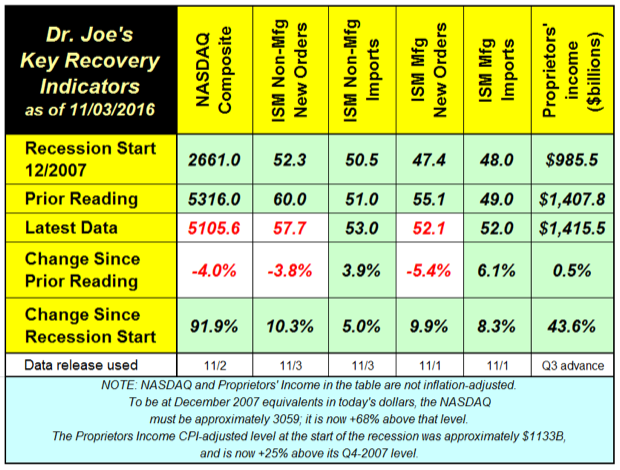
Recovery Indicators Mixed Again
Published: November 4, 2016
Last month's recovery indicators bounced back big from a dreadful report, but this month's have moderated. The ISM manufacturing and non-manufacturing new orders decreased, but they are still above the 50 breakeven level, showing growth. The non-manufacturing side is still strongly on the growth side of the line. Full Analysis
Q3 Real GDP +2.9%; Soybeans Lead the Charge?
Published: November 1, 2016
Prior to the release of Q3's advance estimate of real GDP, the Atlanta Fed's GDPNow forecast was +2.1%. The official figure came in much better, at +2.9%. It is likely to be revised down slightly, but it was a much better showing than recent data. Full Analysis
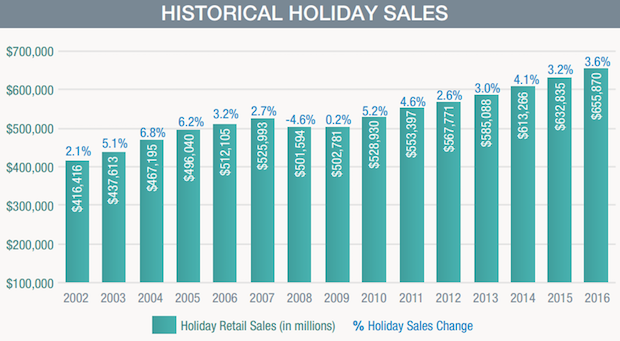
National Retail Federation Forecasts +3.6% in Holiday Retail Sales
Published: October 29, 2016
The National Retail Federation issued its forecast of holiday retail sales. It expects a +3.6% increase compared to 2015. But what's the real increase? After deducting for inflation, that's about +1.5%. If real GDP comes in at +2% in the October 28, 2016 advance report for Q3, holiday retail sales growth will be in line with the growth rate of +1.4% for the year. In some ways, this can be a good year compared to recent history. Holiday retail sales have averaged +2.46% since 2007, with a net after inflation of only +0.64%. On a per person basis, that's actually a decline in that period. Full Analysis
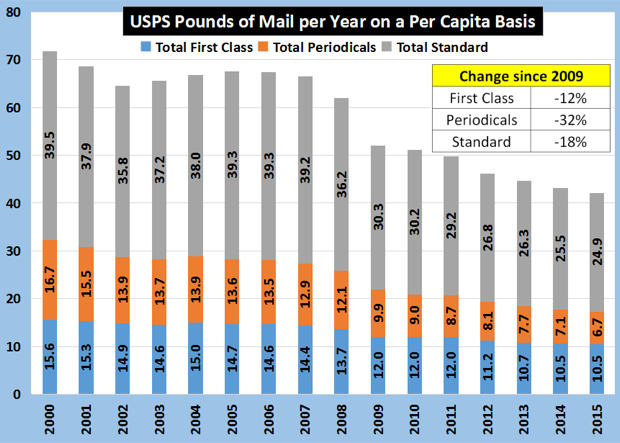
Per Capita Pounds of Mail
Published: October 13, 2016
Since the beginning of the economic recovery in 2009, first class mail is down by -12%, standard mail (discounted bulk mail) down by -18%, and periodicals down a whopping -32%. Full Analysis
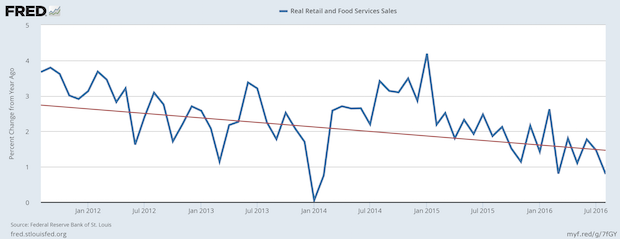
Manufacturing May Be Declining, but Real Retail Sales are Still Positive
Published: September 22, 2016
Data about manufacturing from the ISM and the Commerce Department have show a contraction compared to the prior year. In some cases that slowdown and contraction has been in process for 18 or more months. Retail sales and consumer spending have been the brighter spots of the economy. The inflation-adjusted growth rate of retail sales has been slowing since the beginning of 2015. Full Analysis
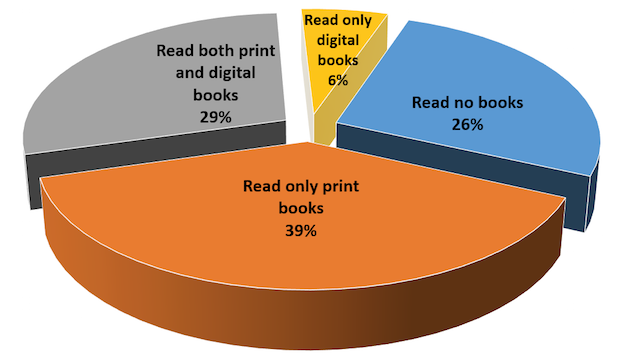
Pew Offers Essential Insights into Book Readership
Published: September 15, 2016
The Pew Research Center's recent report about book reading gives us a peek at the relationship of print and digital media. The report says “A growing share of Americans are reading e-books on tablets and smartphones rather than dedicated e-readers, but print books remain much more popular than books in digital formats.” The chart shows what formats their respondents used in the year prior to the survey. Only 6% were digital-only readers. The report states that 26% read no book in the last year; they may have read other things, but not books. Contrary to many reports about the “demise” of e-books, that has risen from 17% to 28%. It's been stuck there for three years. Print-only readers were 39% (remember: that used to be the entire market of book readers). Print and digital readers are now at 29%. Add the 6% digital-only, and you're at 35%. Content needs to be available in multiple media. Media selection is based on many factors, such as time, convenience, price, income, education, age, and others. Pew also offers insights into the use of audiobooks. The report is free can be downloaded from the Pew Research Center. One other note: when you hear that tablet sales are down or that e-book reader sales are down, keep in mind the versatile use of smartphones and their growing role in content engagement. Among readers 18-29 years old, 22% of them are reading books on their smartphones, 4x more than read them on e-book readers. Full Analysis
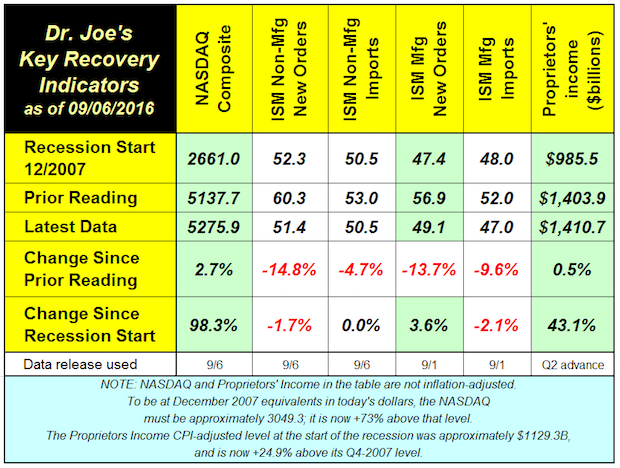
Four of Six Recovery Indicators Fall, Two Now Below Levels of Last Recession
Published: September 8, 2016
The recovery indicators were hit hard last month last month, with two of them falling below the levels at the start of the last recession. Those levels were the readings of these indicators for December 2007. Full Analysis
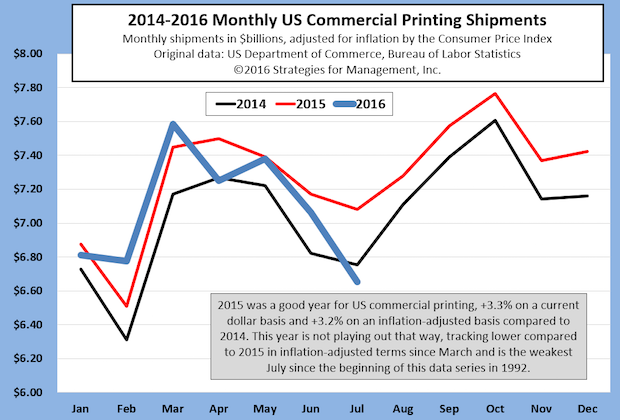
US Commercial Printing Shipments Have Rough July
Published: September 7, 2016
The reversal in trend for US commercial printing shipments went from somewhat benign to significant in July's data. Last year, the industry was relatively stronger than 2014, but shipments have been on a downturn for the last four months of reporting. Full Analysis
Real GDP for Q2 Revised Down Slightly to +1.1%; Durable Goods Orders Still Contracting
Published: August 29, 2016
The latest revision of real US GDP for Q2-2016 dropped from +1.2% to +1.1%. The estimate for Q3 from the Atlanta Fed is above +3%. Full Analysis
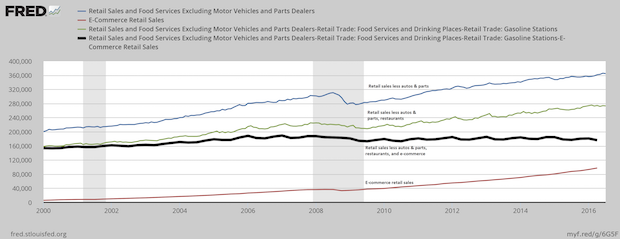
E-Commerce and US Retail Sales
Published: August 25, 2016
E-commerce has been running at the rate of 15% annual growth for many years, but is just 8% of retail sales. That seems tiny in relation to what we've seen happen to print promotions like catalogs and direct mail, and the rise of zombie or troubled shopping malls. The problem is that big ticket items, like autos, raise the size of retail sales. Those items may be researched online, but their actual purchase is not made until it is transacted at a car dealer. Restaurant purchases are also a distorting issue in the data. This chart explains it a little better. E-commerce sales is at the bottom (red line). In the second quarter, it was just short of $100 billion. The blue line is retail sales less vehicles and parts. The green line has food service sales deducted. The black line had e-commerce sales deducted, and shows retail sales through traditional channels. Those sales through older channels are lower than they were at the start of the recession. All of the growth in non-auto and non-restaurant retail for the last decade has occurred in e-commerce channels. Full Analysis
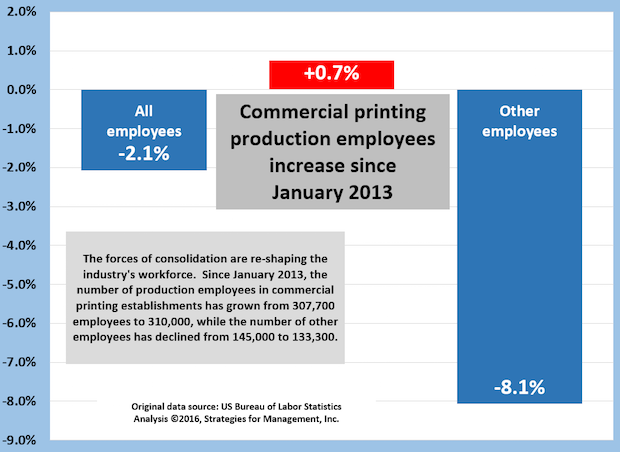
Commercial Printing Employment: Production Employees Up +0.7%, Administrative Down -8.1%
Published: August 11, 2016
Since January 2013, the number of production employees in commercial printing establishments has grown slightly, and is up +0.7%, from 307,700 employees to 310,000. Other employees, which are mainly administrative including sales, are down -8.1%, from 145,000 to 133,300. Full Analysis
US Commercial Printing Shipments for First Half of 2016 Up +1%; Q2 Shipments Decline
Published: August 5, 2016
In data released by the US Department of Commerce, commercial printing shipments for June 2016 were down -$58 million compared to last year (-0.8%). On an inflation-adjusted basis, shipments were down -$130 million (-1.8%). Full Analysis
Recovery Indicators: 3 Up, 2 Down, 1 Unchanged
Published: August 4, 2016
The NASDAQ had a good month, rebounding by 6.5% last month. Compared to last year at this time, the NASDAQ is up +0.6%, which is a negative return compared to inflation (less inflation it is -0.5% because the CPI is +1.1%). Full Analysis
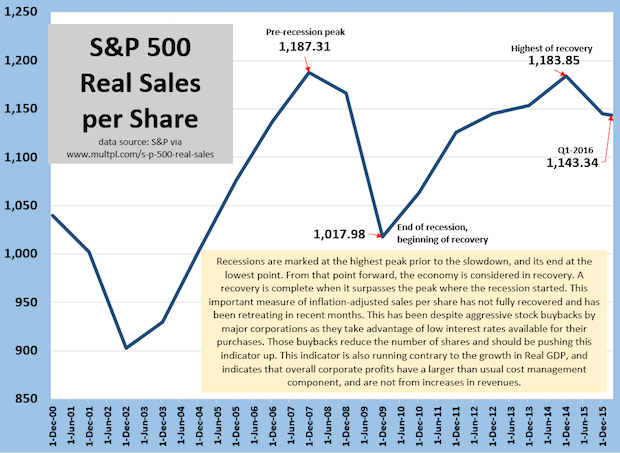
S&P 500 Real Sales per Share Reflects Struggling Economy
Published: July 28, 2016
A way of judging the health of the economy is to calculate the inflation-adjusted sales of all of the companies in the S&P 500 and divide it by the total number of public shares. This index should have a natural upward bias. S&P 500 companies are very large, and acquire or merge with other companies, many of which are outside of the 500 companies. Buybacks of stock, which has been a trend of note these last five or so years, reduce the number of shares, or slow the growth in shares, reduce the denominator, again, giving it an upward bias. Instead, this measure has suffered. It peaked in 2007, and has yet to surpass that level. This means that corporate profits, which have generally been good (though slowing lately) have been managed by refinancing of debt to lower interest rates and reductions in costs and expenses. Those better profits are not the result of increased revenues. Slow, sluggish economic growth is reflected in these figures, and is a reminder that one should not look only to GDP as an indicator of the true health of the private sector. Full Analysis
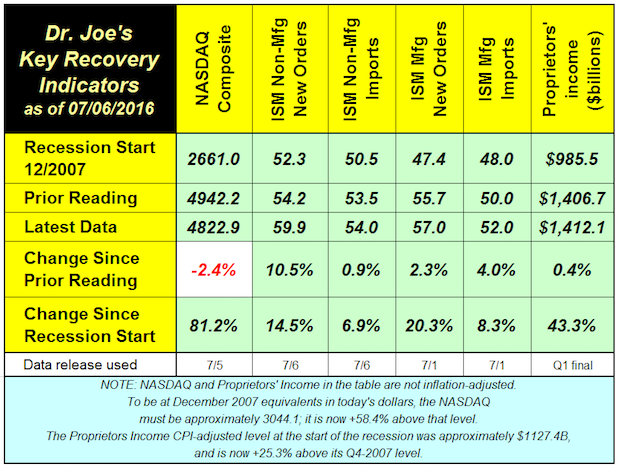
Recovery Indicators Better than Recent Economic News
Published: July 7, 2016
The recovery indicators showed better economic activity in June. This ended the second quarter in a manner that seemed contrary to many recent economic data. Full Analysis
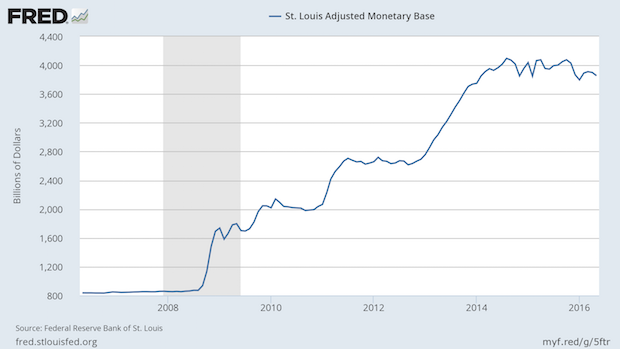
Are We Headed to QE4?
Published: July 7, 2016
This chart shows the Fed's balance sheet in the format known as the St. Louis Adjusted Monetary Base. Prior to the doubling of that balance sheet, it was growing at the annual rate of 6%, which was basically comprised of the long term rates of 1% for population growth, 2% for inflation, and 3% for economic growth. Full Analysis
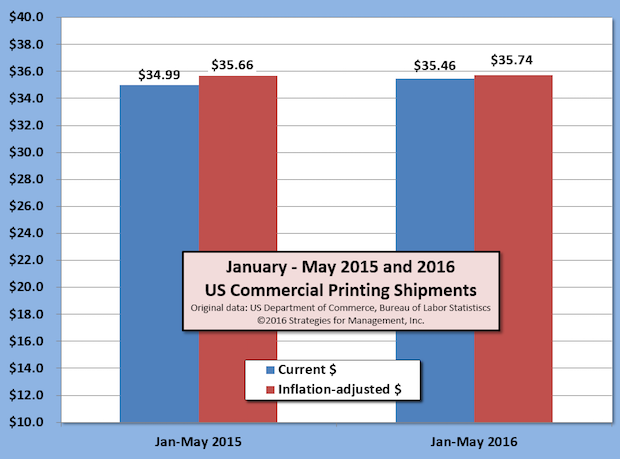
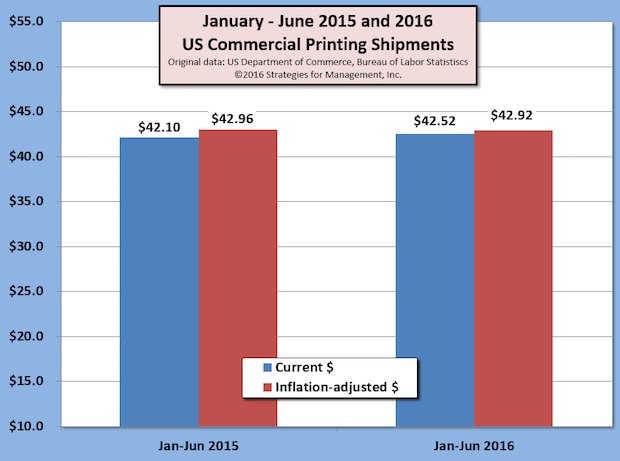
May Printing Shipments Up +1.2% Versus 2015; Trend is Flattening
Published: July 6, 2016
US commercial printing shipments for May16 were $7.37 billion, the highest level in current dollars for the month since 2013. For the first five months of 2016, shipments are up approximately +$476 million in current dollars (+1.4%) and up +$79 billion after inflation (+0.2%) Full Analysis
US Q1-2016 GDP Revised to +1.1%
Published: June 30, 2016
US real GDP for Q1-2016 had its third and final revision in this reporting cycle, and was +1.1% on an annualized basis compared to Q4-2015. Q1 had been reported as +0.5% in its advance report, +0.8% in the preliminary report, and now as +1.1%. Real GDP remains very low compared to the post-WW2 +3.3% rate. Full Analysis
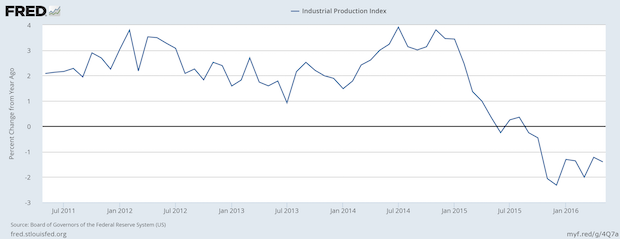
Industrial Production Continues its Negative Turn
Published: June 23, 2016
The Fed’s own data probably caused them to have a more dour outlook about the economy. The chart shows that US industrial production started slowing at the end of 2014 and has been in outright contraction since Fall 2015. Full Analysis
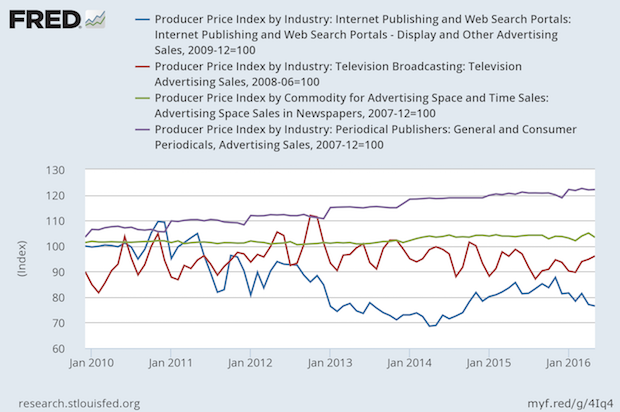
Prices for Advertising Rise for Magazines, Stable for TV and Newspapers, Down for Digital
Published: June 16, 2016
The chart shows that magazine advertising has gone up by more than 20% since 2010, but it's hard to know how much might have been bundled in those prices. Pricing reports sent to the Bureau of Labor Statistics are supposed to be in constant units, but it's hard to determine those in service environments, and it's hard to quantify a wink or a nod in an advertising agreement. Full Analysis
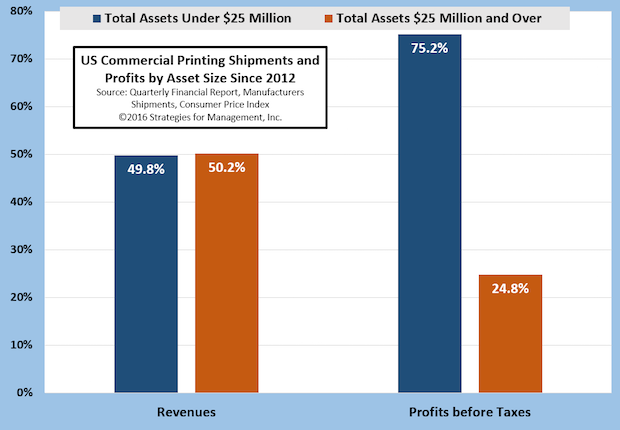
Smaller Printers Are Giants in Profits
Published: June 9, 2016
The changes in the media markets led to the declines in magazines, catalogs, newspaper inserts, and many of the products produced by large printing organizations. For years, these companies were giants in the industry, but recently this sector has been restructuring through consolidations. Writedowns in goodwill and for closed plants have cut the profits of these organizations. Full Analysis
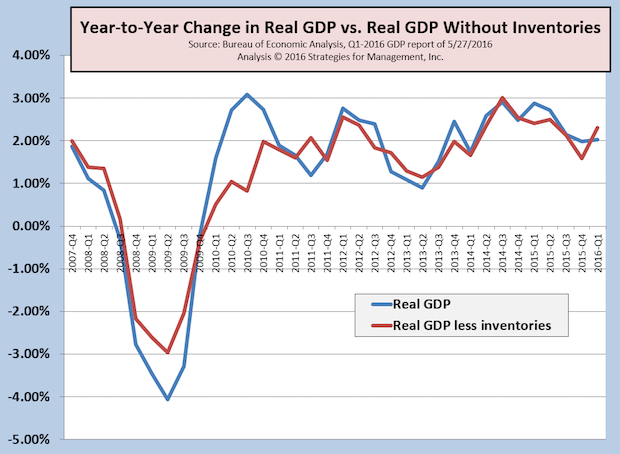
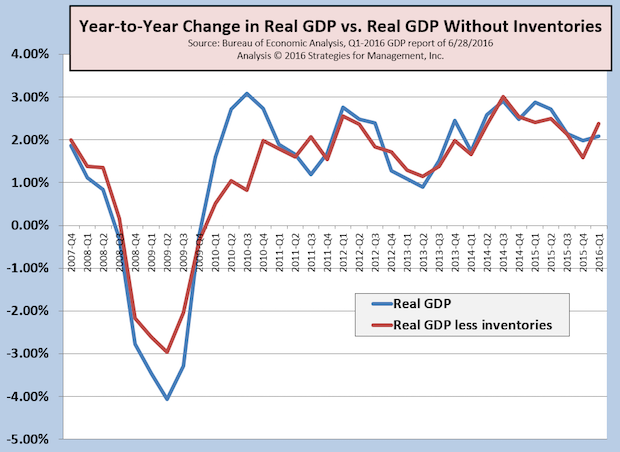
Q1-2016 Real GDP Revised Up to +0.8%; Economy Already Recovering from Mini-Recession
Published: June 2, 2016
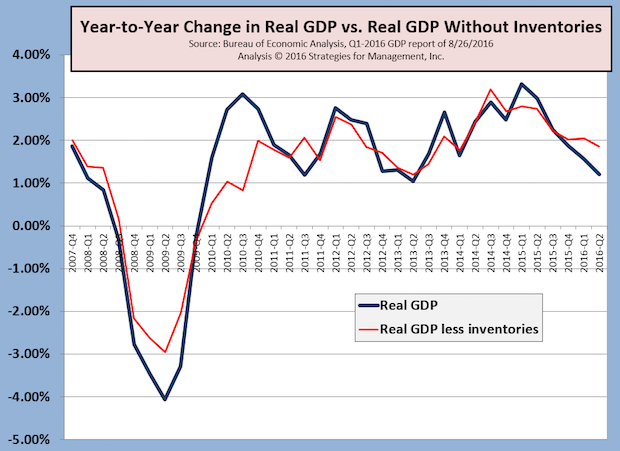
The first estimate of Q1-2016 GDP was +0.5%, and that was revised up slightly to +0.8%. The concerns about recession are being reduced lately with some better economic news that show the economy on its sluggish pattern of sub-par growth in the +2% range, well below the post-WW2 average of +3.3%. As noted many times, there are numerous economic indicators that have yet to reach their pre-recession levels. Since this pattern has been so long in duration, even non-money denominated statistics, such as employment, have to be adjusted by population growth to discern true underlying levels. The chart shows Real GDP on a more conservative year-to-year basis as reported and with the volatile effects of inventory changes removed. The economy still seems to be digesting some long-term inventory rebalancing, some of which is related to global currency and other economic issues. The slowdown of the first quarter still seems to be limited to the first six weeks of the year. At the time of this writing, the Atlanta Fed's GDPNow estimate of Q2-2016 is at +2.5%. While that is a disappointing level, it is consistent within the lackluster level of economic growth that has come to be known these past years as “new normal.” Since 2011, real GDP has averaged only 2%. The difference in the average may not seem a lot, but a 2% annual growth rate will result in an economy doubling in size in 39 years; at 3.3%, it doubles almost 16 years sooner.
Full Analysis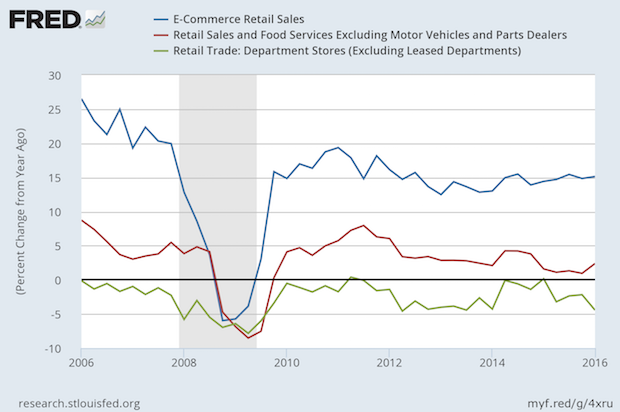
Retail Sales Growth Rates Reflect Changes in Competition and Consumer Preferences
Published: May 26, 2016
Department stores are still having problems. Their year/year growth rate has been negative for more than a decade. E-commerce sales are maintaining a 15% growth rate. At that rate, they double every five years. The last peak in growth for retail sales excluding motor vehicles was in late 2011, and that rate, unadjusted for inflation, has slowed to the 2% range. Retail sales are a function of household income, and their costs, and they remain sluggish as median household income has still not reached the level it was at the beginning of the recession. In the meantime, shopping malls, the department stores that anchor them, and mall owners are having problems. A Weekly Standard article about Amazon has some insights into it. The downslide of brick and mortar retail stores and malls can create collection problems for printers who sell to them, but there are changes underway that might hold some opportunities for those printers who seek them. Developers are using mall complexes for new buildings that include office space and even hospitals and hockey rinks. There are also new efforts to treat the shopping experience not just as a matter of location, but holistically to include all digital touchpoints inside and outside the mall. How will much of this be communicated? It will often require signage, working closely with store owners and local mall management. Those printers, attuned to the nature of communications logistics and data management, can find opportunities there.
Full Analysis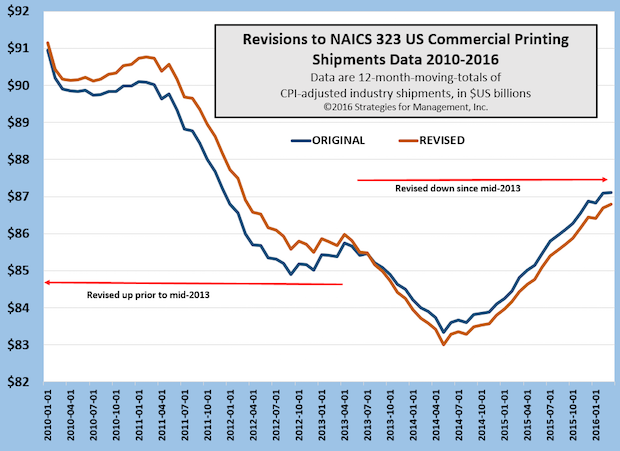
Printing Industry Shipments Revised from 2007 to 2016, with Minor Changes Since 2009
Published: May 19, 2016
The years 2008 through 2013 had slight revisions higher; the end of 2013 to present had slight revisions lower. The Commerce Department's revisions to all manufacturing data are leading up to a multi-year revision of GDP data at the end of July. Full Analysis
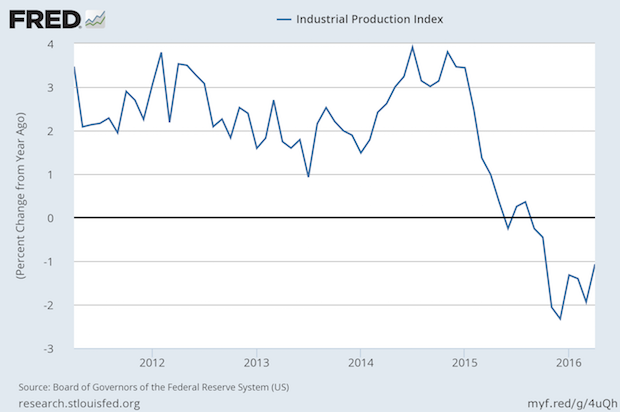
Manufacturing Still in Contraction
Published: May 19, 2016
The latest Federal Reserve industrial production index showed a slowdown since late 2014 and an outright contraction since mid-2015 is still in process. The business press focused on the comparison to the prior month, which looked like an improvement. The chart, however, compares to the prior year. Recent consumer retail data have been more optimistic, and the premise that we had a “micro-recession” at the beginning of the first quarter seems to be justified. There is growing pressure to weaken the US dollar to make manufacturing exports less expensive to international customers. The Atlanta Fed's GDPNow estimate for Q2 GDP is now +2.5%. At that rate, it would be a rebound from Q1's +0.5%. Full Analysis
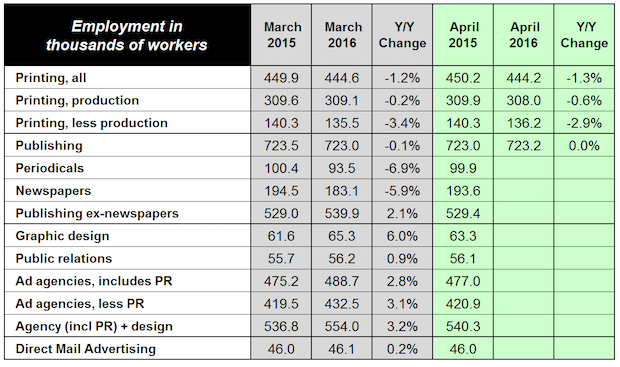
Graphic Design Employment Up +6%, Agencies up +2.8%
Published: May 12, 2016
Content creation is in a strong uptrend based on the latest employment data. Graphic design employment is up +6%, and has taken over from public relations employment as the surging area of hiring. Full Analysis
19 Consecutive Months of Improved US Commercial Printing Shipments
Published: May 5, 2016
US commercial printing shipments have increased compared to the prior year for 19 consecutive months. March 2016 shipments were up +$85 million (+1.1%) in current dollars compared to 2015, and +$22 million (+0.3%) after adjusting for inflation. February 2016 shipments were revised up by $2 million. Full Analysis
Recovery Indicators Better than the Recent General Economic News
Published: May 5, 2016
The recovery indicators are more positive than the general economic news. One of our indicators, the NASDAQ, is down -1.7% since last month. It's been on a rocky road for the last three quarters. Its recent peak was 5218.86 in July, and it has not gotten really close since. Stock market concerns have focused on a decline in the rate of corporate profits, and Apple's recent financial report did not really help matters. There was a bullish rise in non-manufacturing orders. Manufacturing new orders index might look like a decline, but it is still indicate moderate growth. Proprietors income, a measure of the health of small business, was up only slightly. Other reports of small business health have not been good, especially the recent NFIB Small Business report. This month's recovery indicators don't indicate recession, a word that is bandied about with greater frequency lately, but support the continuing unsatisfying levels of slow but positive growth. Full Analysis
Q1-2016 GDP +0.5%; Inventory Correction Finally Arrives
Published: April 29, 2016
US real GDP for Q1-2016 was reported at annual growth of only +0.5% compared to Q4-2015. On a year-to-year basis, the growth rate was +1.95%. The inventory adjustment that the economy has needed finally came, with the lowest net inventories in two years. Real GDP growth less inventories was +2.3% on a year-to-year basis. Full Analysis
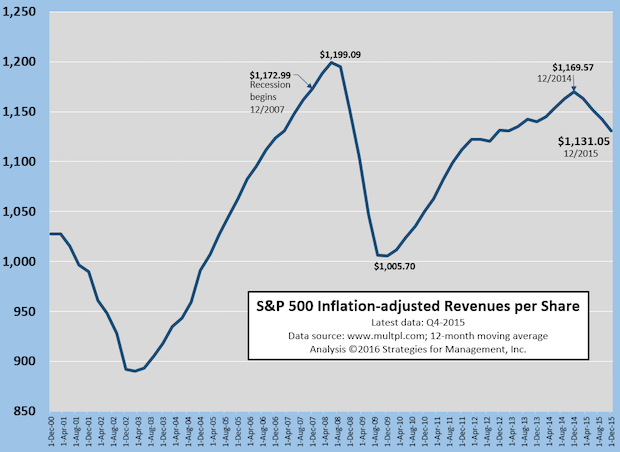
S&P 500 Revenue Per Share Still Lags Economy
Published: April 28, 2016
Everyone knows that the stock market is up from its lows at the bottom of the recession,but one obscure but key measure underscores how sluggish the economy has been. The S&P 500 should have a bias of steadily increasing revenues. It has most of the best companies in the world, with international presence in the globe's growing markets and a foundation in the established ones. It is rare for companies to be dismissed from the S&P 500, but companies are added all the time. When S&P companies merge, they create a new entity of combined revenues, and another company is added with new revenues to add to the index. The other upward bias should be the high level of stock buybacks buy these large companies, as they borrow money at low interest rates and create “shareholder value” by reducing the number of shares and increasing the value of each share of stock. We've called this cowardly, as it increases earnings per share (EPS) without needing to increase total profits. So this revenue per share should be steadily increasing with a growing economy in a recovery that started in mid-2009. It seems that companies have done a much better job of financial engineering than they have in creating revenues. Full Analysis
NFIB Small Business Index: A New Recession for Main Street?
Published: April 21, 2016
Economic data have been conflicting of late, but there is one consensus in the data that is clear: the small business economy did not recover from recession, and looks like it’s back in recession territory. There are many indicators we use for small business but one that is watched often is that of the NFIB. It is published monthly and has a long history. US government data focuses attention on the largest businesses because they represent big chunks of the economy and report some kind of data, especially payroll data, with great frequency. Think of it as counting whales rather than minnows. Their recent analysis said “The small business sector... is underperforming, doing little more than operating in maintenance mode. Slow economic growth is now just a result of population growth, more haircuts, retail customers, health care patients, etc. But there is no exuberance, no optimism and not much hope, the numbers make it clear.” Economies stuck in +2% growth mode tend to do that. Full Analysis
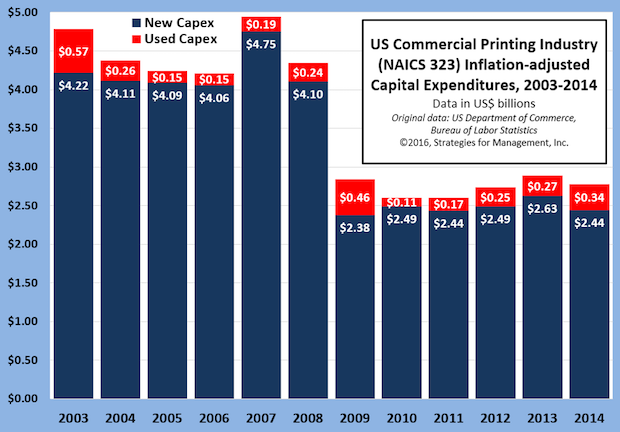
2014 US Commercial Printing Capital Expenditures: New Purchases Down, Used Purchases Up
Published: April 19, 2016
The US Department of Commerce recently released its Annual Survey of Manufactures Capital Expenditures report, issuing data for 2014. Full Analysis
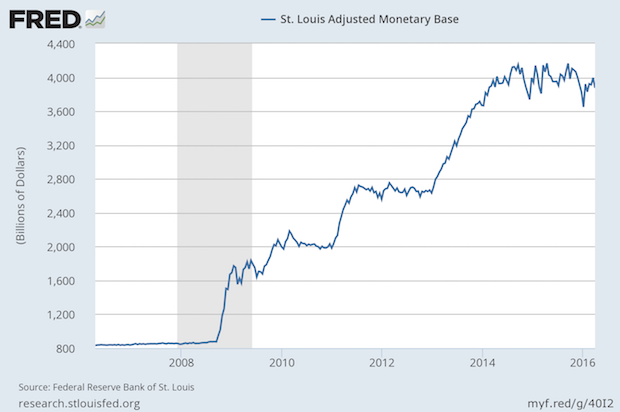
The Fed Never Really Stopped QE3
Published: April 14, 2016
This week’s chart shows the aggressive actions of the Federal Reserve after the housing bubble. For decades, the Fed’s balance sheet increased by about 6% per year, averaging about half inflation and half economic growth. The rocket-like rise when the bubble burst is clear, and then the three steps up of each of the quantitative easings are plainly seen. The Fed has wanted to raise rates for some time, but they have also wanted to stop the buying of government instruments that characterized the QE programs. They create shortages of publicly traded bonds which increases their prices, which makes the effective interest rates low. Rather than ending their purchases, the Fed has been replacing matured obligations. In effect, this keeps QE3 going. Can the Fed ever end it? They may hold on and hope that over time that economic growth and inflation catches up to them in time, but that can take forever, or perhaps longer. It will be difficult for the Fed to end its policy without robust economic growth that will give them the flexibility and opportunities to unwind their holdings. Should a recession begin, or a new financial crisis emerge (even an internationally) the Fed might need to create an additional QE effort. Full Analysis
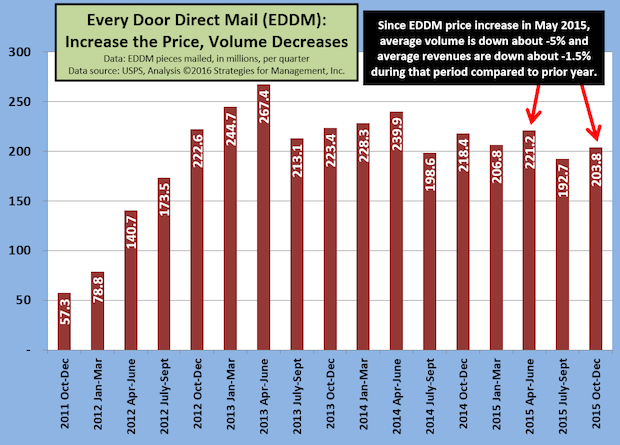
Can USPS Price Increase Rollback Get EDDM Moving Again?
Published: April 7, 2016
The USPS is always in the news, and last month's Annual Compliance Determination report was not particularly positive. “The majority of products failed to meet service performance targets for FY 2015” read the Postal Regulatory Commission press release. The PRC directed “the Postal Service to improve service performance and provide a comprehensive plan within 90 days.” Full Analysis


![]()

WhatTheyThink is the official show daily media partner of drupa 2024. More info about drupa programs
© 2024 WhatTheyThink. All Rights Reserved.