The U.S. Census Bureau officially designates NAICS 32312 as “Support Activities For Printing,” identifying these businesses as “establishments primarily engaged in performing prepress and postpress services in support of printing activities. Prepress services may include such things as platemaking, typesetting, trade binding, and sample mounting. Postpress services include such things as book or paper bronzing, die cutting, edging, embossing, folding, gilding, gluing, and indexing.”
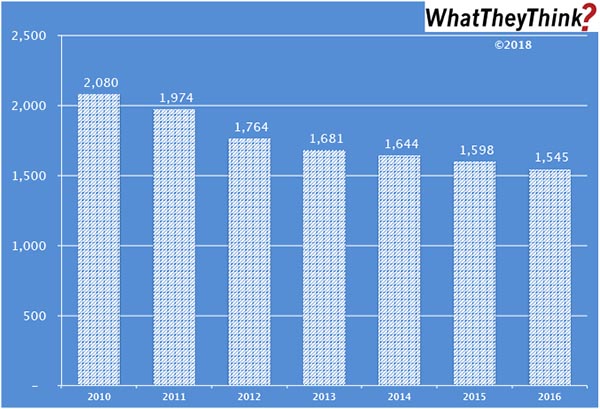
In 2010, there were 2,080 of these establishments; by 2016, the most recent year for which we have data, that number had dropped to 1,545. It’s not difficult to understand why the number of these establishments has been dropping and, actually, it’s kind of surprising that it hasn’t declined more than it has: prepress is more and more simply being absorbed into the printing process itself. Especially in digital printing workflows, prepress is little more than what happens in the digital front end. (This is not a new story; remember when “color separators” were a large and thriving business category? That entire industry was basically replaced by a command in Photoshop. So it goes.)
Finishing is a different kettle of fish. Yes, a lot of print businesses have been adding in-house binding and finishing; after all, who has time these days of fast turnarounds to send a job out for finishing? Still, dedicated bindery services businesses still abound, and they have shifted a lot of their focus to higher-end finishing services, such as the so-called “embellishments” (be they digital or not), and the kinds of services that print businesses may not want to add in-house. After all, one print shop can’t add everyfinishing process under the sun, despite the growing prevalence if all-in-one machines.
(For those playing along at home, if you’re wondering how many of these establishments are prepress and how many are postpress, before 2012, County Business Patternsbroke them out separately, and in 2011, the balance was 56% prepress and 44% postpress.)
The data in this chart is gleaned from our Commercial Printing Establishments, which complements and supplements our regular tracking of printing industry shipments and other industry data. Based on data from the Census Bureau’s County Business Patterns, we present—in spreadsheet form—U.S. commercial printing establishments from 2010 to 2016, including establishment counts for six commercial printing business classifications (based on NAICS, the North American Industrial Classification System):
- 323 (Printing and Related Support Activities)
- 32311 (Printing)
- 323111 (Commercial Printing, except Screen and Books)
- 323113 (Commercial Screen Printing)
- 323117 (Books Printing)
- 32312 (Support Activities for Printing—aka prepress and postpress services)
We further break these counts down by establishment size:
- 1–4 employees
- 5–9 employees
- 10–19 employees
- 20–49 employees
- 50–99 employees
- 100–249 employees
- 250–499 employees
- 500–999 employees
- 1000 employees
These data, and the overarching year-to-year trends, like other demographic data, can be used not only for business planning and forecasting, but also sales and marketing resource allocation.
Every other week, we will be breaking these establishment data down in different ways. Over time, we will be adding additional data from the County Business Patterns, such as number of employees, payroll, and similar information for additional business classification of relevance to the graphic communications industry.


