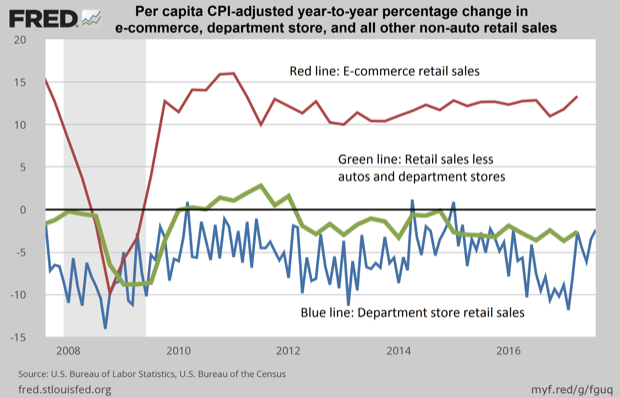
Inflation and population changes often distort the analysis of economic trends. This chart shows the changing nature of retail sales on a per capita (per person) and inflation-adjusted (using the Consumer Price Index) basis by the percentage change compared to the same period of the prior year.
Everyone knows that e-commerce is growing (red line), but does anyone remember how the high growth rates were always attributed to being “on a small base of sales”? It’s 10+% growth rate persists, undeterred.
Speaking of undeterred, the decline in department store sales (blue line) is much older than this chart indicates. It’s been more than two decades since department stores produced a string of positive results; store closures are proceeding in wrong kind of undeterred momentum.
Finally, retail sales less autos and e-commerce and department stores (green line) shows a net retail level that is contracting, especially over the last five years. Write it up to a sluggish and stagnant economy where the shining star is the growth of e-commerce facilitated by always faster and cheaper devices and connectivity, and consumers are rewarded by price competition and convenience. What’s funny about this? The superior personal service of retail stores was supposed to limit of e-commerce growth. Instead, it’s the traditional retailers that have had trouble keeping up with the rapid turnaround, deeper and wider availability of product selection, and aggressive customer support and generous return policies of many e-retailers.