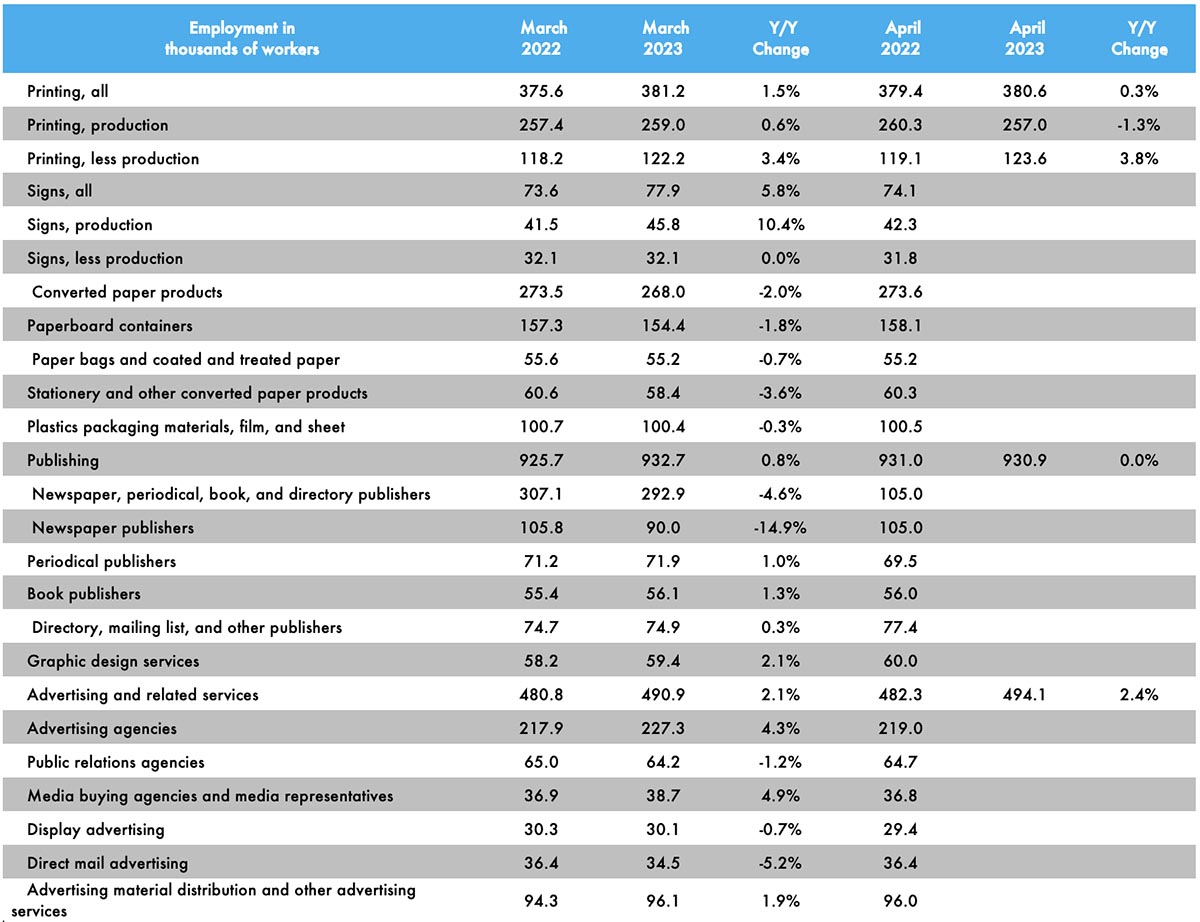
Over the winter, the employment situation flattened out and has remained fairly flat on average as we moved into spring, although we are starting to see a greater disparity between production and non-production employment. Overall printing employment in April 2023 was down -0.2% from March and drilling into carpeted/non-carpeted areas, production employment was down -0.8% while non-production employment was up 1.1%. (For those who have asked, the Bureau of Labor Statistics doesn’t drill very far down into these classifications—they identify only “All Employees” and “Production and Nonsupervisory” so, historically, we have backed out production and nonsupervisory from all employees to get “non-production employees.” It’s a bit of a blunt instrument approach, but it’s the best we can do with the data resources we have available. Would that we had more…)
In terms of publishing, overall publishing employment was down -0.2% from March to April, while advertising and related services were up 0.7%.
Earlier this year, we started adding a number of other business categories to our employment table, the reporting of which, as you may recall from our tracking of the publishing and creative markets, lags a month.
For example, overall employment in the signage industry was down -0.5% from February to March, with sign production employment down -0.4%.
Converted paper products employment was down -0.1% from February to March, with paperboard container employment down -0.3% and paper bags and coated and treated paper employment up 1.1%.
Looking at some specific publishing and creative segments, from February to March, periodical publishing employment was up 0.4%, while newspaper publishing employment was down -1.4% and book publishing up 0.9%. Graphic design employment was down -1.2%, ad agency employment was up 0.2%, and PR agencies were down -1.2%. Direct mail advertising employment was down -2.5%.
As for April employment in general, the BLS reported on May 5 that total nonfarm payroll employment increased by 253,000 in April, and the unemployment rate was unchanged at 3.4%—the lowest in more than 50 years. Meanwhile, February employment was revised down by 78,000 and March employment was revised down by 71,000, for a total downward revision in February/March of 149,000.
The U-6 rate (the so-called “real” unemployment rate which includes not just those currently unemployed but also those who are underemployed, marginally attached to the workforce, and have given up looking for work) ticked up from 6.7% to 6.6%.
The labor force participation rate was unchanged from March to April at 62.6% and the employment-to-population ratio was unchanged at 60.4%. The labor force participation rate for 24–54-year-olds also ticked up from 83.1% to 83.3%—above the pre-pandemic level.
Although not a dynamite employment report, it was still generally above expectations.