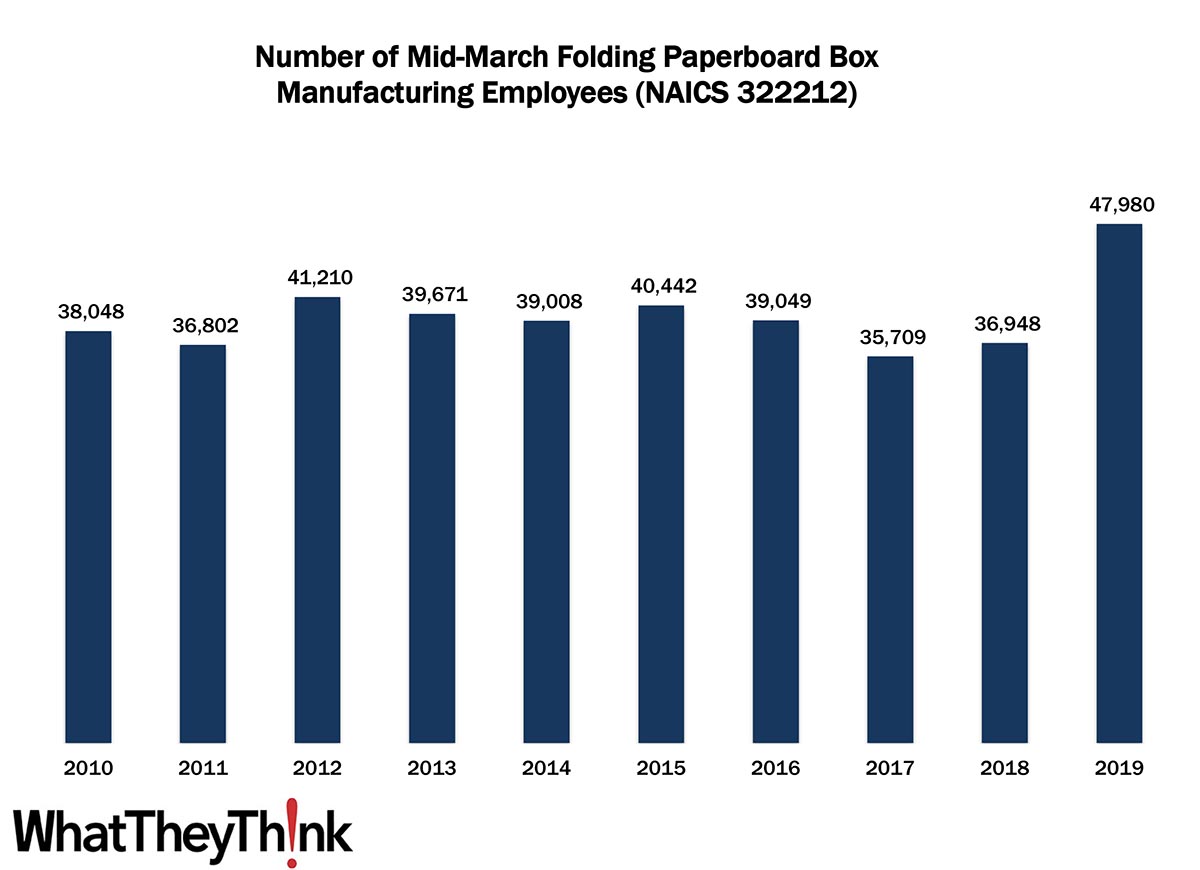
in 2010, there were 30,048 employees in NAICS 322212 (Folding Paperboard Box Manufacturing establishments). Employment in this category stayed fairly steady throughout the decade, then spiked in 2019 to 47,980 employees. Some of the factors driving this market segment include:
- Increased digital printing of cartons to handle shorter runs.
- Ecommerce driving the demand for different kinds of cartons with different graphic requirements (i.e., less emphasis on packaging needing to stand out on a retail shelf).
- “Smart packaging” incorporates electronic functionality (such as temperature change sensors for foods and pharmaceuticals) or interactive elements such as QR codes for inventory tracking.
- Specialty enhancements such as 3D, lenticular imaging, or digital embellishments for retail-ready cartons are appearing on cartons with greater frequency.
The 3222 four-digit NAICS comprises a variety of different converted packaging types, and over the next several months, we will be looking at them in turn, including:
- 322219 Other Paperboard Container Manufacturing
- 32222 Paper Bag and Coated and Treated Paper Manufacturing
- 32223 Stationery Product Manufacturing
- 32229 Other Converted Paper Product Manufacturing
- 322291 Sanitary Paper Product Manufacturing
- 322299 All Other Converted Paper Product Manufacturing
These counts are based on data from the Census Bureau’s County Business Patterns. Every other week, we update these data series with the latest figures. You may have noticed that the latest edition of County Business Patterns was released last month, which now includes 2019 data. Once we have finished with the Converting NAICS, we will circle back to the beginning and update establishment and other counts in the printing, publishing, and creative NAICS.
These data, and the overarching year-to-year trends, like other demographic data, can be used not only for business planning and forecasting, but also sales and marketing resource allocation.
This Macro Moment
Our October print issue has an automotive theme, so for this week’s “Macro Moment,” we thought we would look at vehicle sales. Wards Auto is the source for vehicle sales tracking data and their estimate of light vehicle sales for September 2021 came in at 12.18 million (seasonally adjusted annual rate), a decline of -6.7% from the August sales rate, and -25.2% from September 2020 (the consensus estimate had been 13.4 million). Auto sales had crashed (as it were) in April 2020, with sales just around 9 million. Auto sales had rebounded and peaked a year later in April 2021 at more than 18 million, but there had been a steady decline since, largely due to supply issues. Q3 light vehicle sales ended up at a “dismal” 13.3 million and Wards’ analysts are not bullish on Q4.
J.D. Power’s estimates show: “Retail sales of new vehicles this month are expected to reach 888,900 units, a 24.8% decrease compared with September 2020, and a 19.8% decrease compared with September 2019 when adjusted for selling days….New-vehicle retail sales in Q3 2021 are projected to reach 2,990,500 units, a 14.3% decrease from Q3 2020 and an 18.8% decrease from Q3 2019 when adjusted for selling days.”
They point out that demand far exceeds production, and dealerships are turning vehicles around as soon as they arrive on the lot. The other big consequence is increased prices for new cars—which translates into record profits. “For retailers, the record profit per unit, despite the big drop in volumes will result in September 2021 being the most profitable September ever. Total aggregate retailer profits from new-vehicle sales will be $4.2 billion, the highest ever for the month of September and up an amazing 203% from September 2019.”
When life gives you lemons, make lemonade—although maybe “lemon” is not the best analogy to use when discussing cars.


