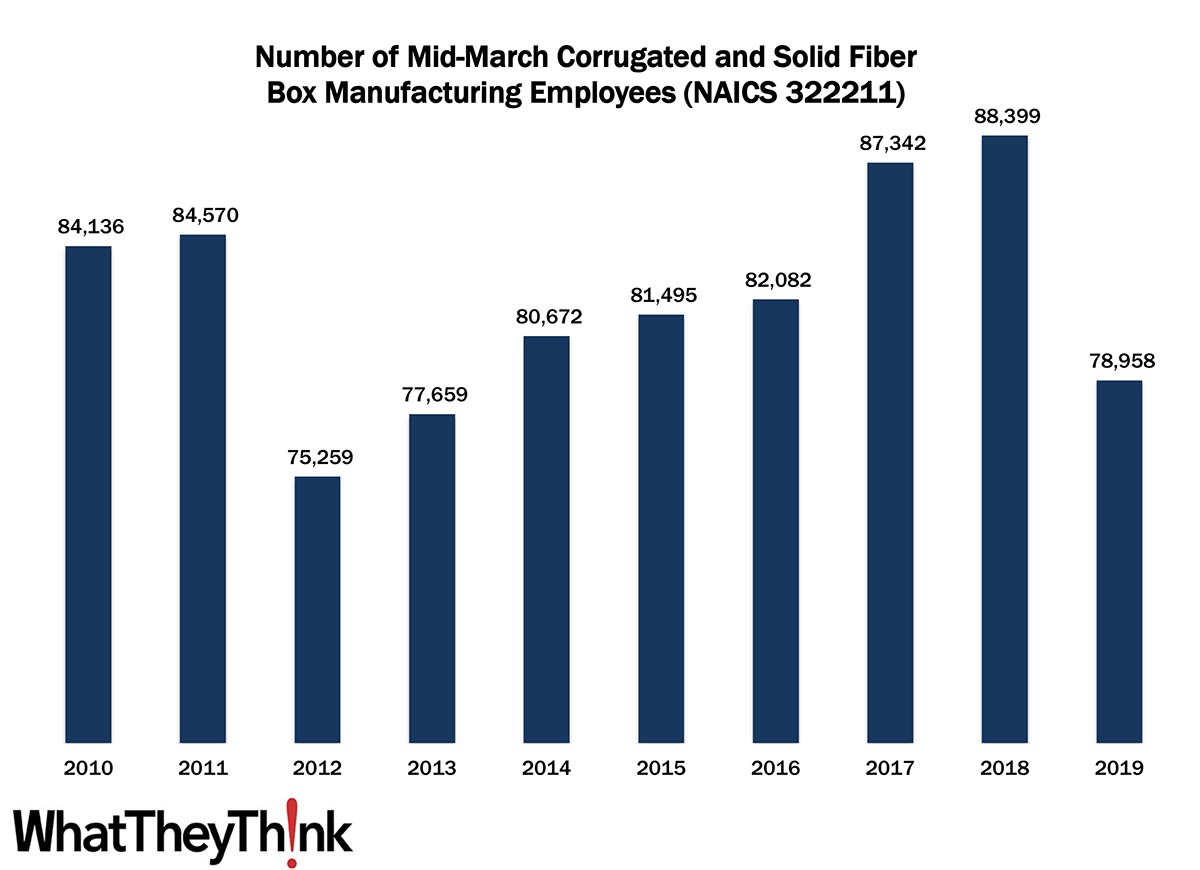
In 2010, there were 84,136 employees in NAICS 32221 (Corrugated and Solid Fiber Box Manufacturing establishments). Employment in this category dropped abruptly in 2012, then continued to rise over the course of the decade, peaking in 2018 at 88,399 before dropping again in 2019 to 78,958. After the effects of the Great Recession wore off, ecommerce continued driving demand for more and newer types of corrugated boxes, with a change in demand for different sizes—shipped to consumer vs. shipped to retailer, for example. As of 2019, we started to see the early indications of consolidation that began to hit this segment.
The 3222 four-digit NAICS comprises a variety of different converted packaging types, and over the next several months, we will be looking at them in turn, including:
- 322212 Folding Paperboard Box Manufacturing
- 322219 Other Paperboard Container Manufacturing
- 32222 Paper Bag and Coated and Treated Paper Manufacturing
- 32223 Stationery Product Manufacturing
- 32229 Other Converted Paper Product Manufacturing
- 322291 Sanitary Paper Product Manufacturing
- 322299 All Other Converted Paper Product Manufacturing
These counts are based on data from the Census Bureau’s County Business Patterns. Every other week, we update these data series with the latest figures. You may have noticed that the latest edition of County Business Patterns was released last month, which now includes 2019 data. Once we have finished with the Converting NAICS, we will circle back to the beginning and update establishment and other counts in the printing, publishing, and creative NAICS.
These data, and the overarching year-to-year trends, like other demographic data, can be used not only for business planning and forecasting, but also sales and marketing resource allocation.
This Macro Moment
If you have been tracking the various projections for Q3 GDP (and one could hardly blame you if you have not), you may know that they have been fluctuating wildly, thanks to the persistence of COVID and the Delta variant. Via Calculated Risk, the roiling forecasts have settled down somewhat, with the expectation being somewhere between 3.6% and 4.5%.
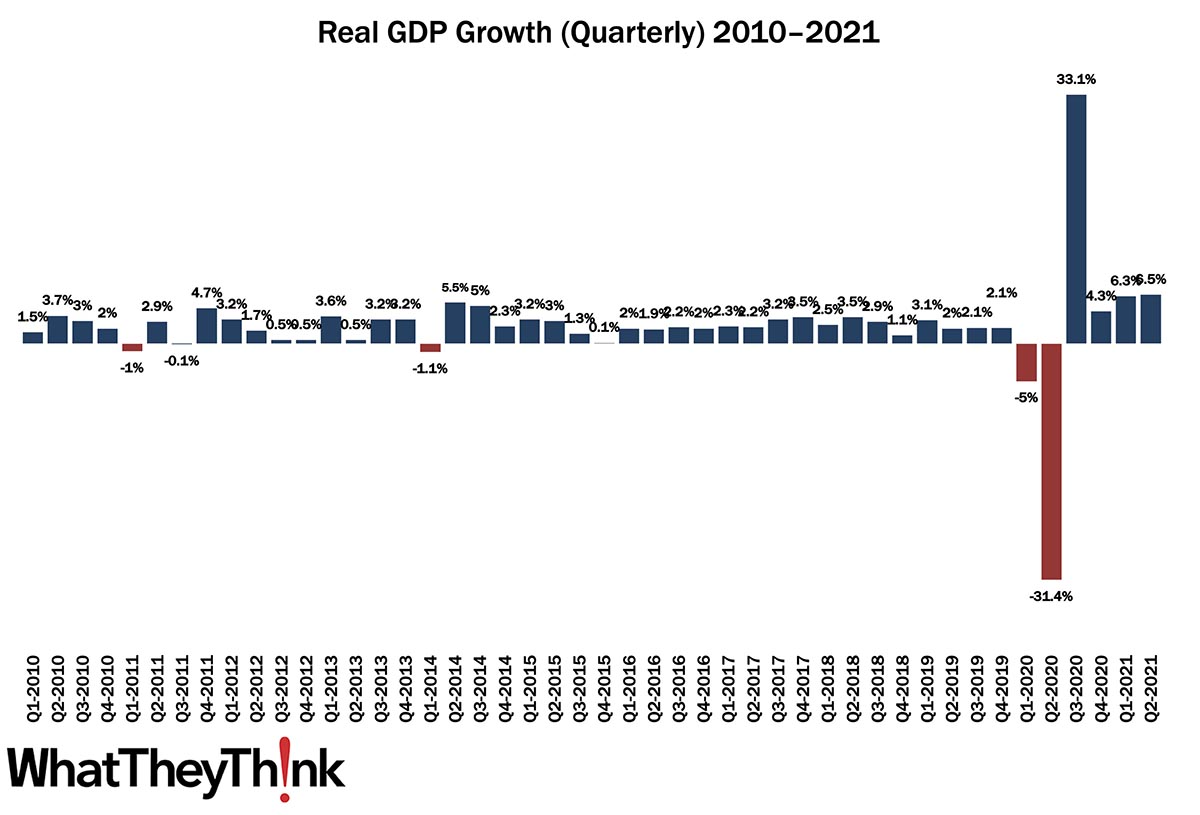
BofA Merrill Lynch was far more bullish back in July, predicting 7.0% Q3 GDP growth. They have since downgraded to 4.5% in September, saying “We continue to track 4.5% qoq saar for 3Q GDP following the retail sales data as our forecast was far above consensus.” Goldman Sachs was even more ebullient over the summer, forecasting 9.0% Q3 GDP growth. Now…not so much. On September 10, they lowered their expectations to 3.5% (a bit of a downgrade!), but thanks to a strong retail sales report, last week upped the expectation to 4.5%. And the Atlanta Fed’s GDP Now dropped their expectation from 6.1% in July to 3.6%, coming in as the most bearish of the three. (By the way, real GDP increased at an annual rate of 6.5% in Q2 2021 and 6.3% in Q1.)
The current and expected growth are still above pre-pandemic levels, as we continue to recover from 2020. Of course, the recovery could be better if we could only get the virus under control, which we seem to be unwilling to do.