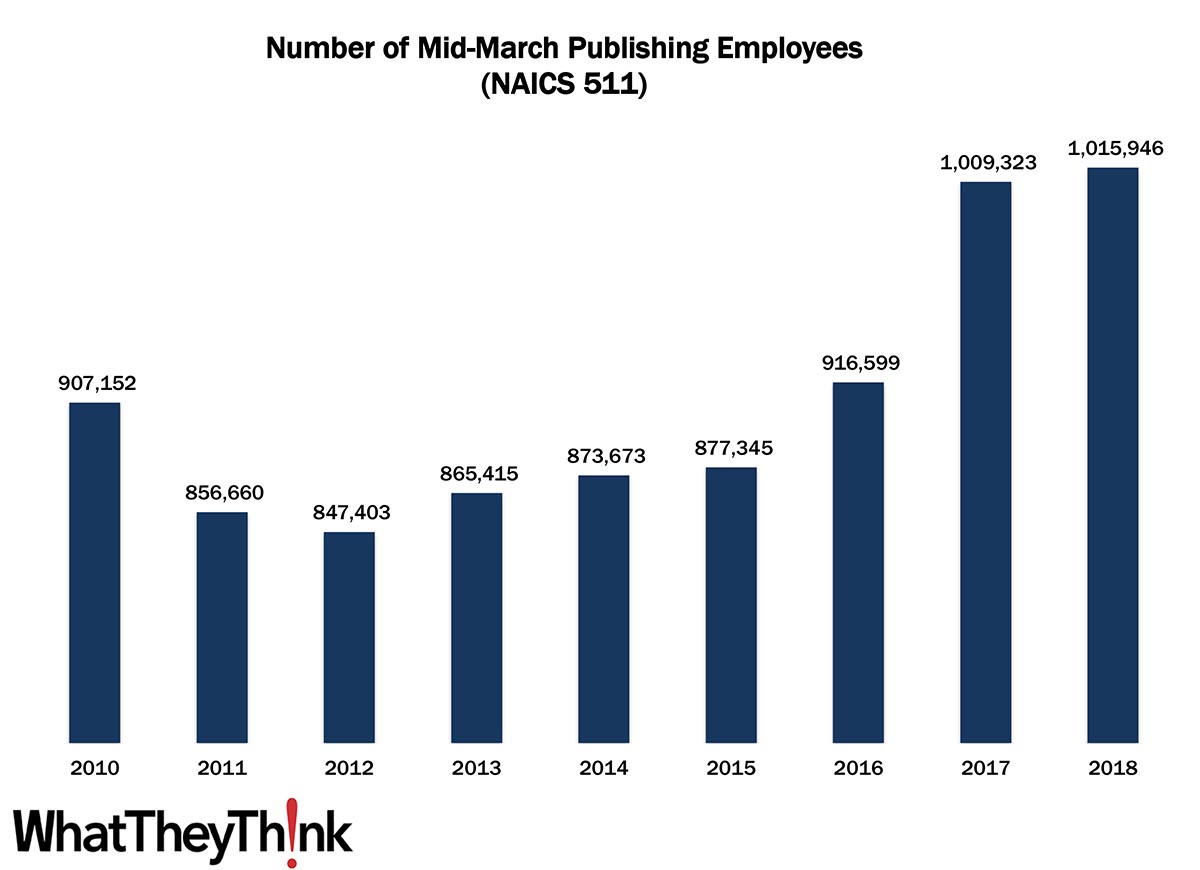
The U.S. Census Bureau officially designates NAICS 511 as “Publishing Industries (except Internet).” In 2010, there were 907,152 employees in U.S. publishing establishments. As you can see, there was a drop during the Great Recession, but publishing as a whole rebounded in the 2010s to where we saw large increases toward the end of the decade, culminating in 1.02 million in 2018. We will probably see a drop in employees once County Business Patterns gets to 2020 data.
We’ll have more to say when we dive into the specific publishing NAICS categories, as “Publishing” here refers to everything from books, magazines, and newspapers to greeting cards, to mailing lists and directories, and the catchall “other publishing” which can include maps and other specialty publishing products. Generally, though, the growth in employment here is due to two basic factors: economic growth following the Recession, as well as lowered barriers to entry for small or self publishers thanks to digital printing (enabling short-run on-demand publishing) and the Internet/ecommerce (easing distribution, which was always a challenge in the pre-Internet days).
These counts are based on data from the Census Bureau’s County Business Patterns. Every other week, we update these data series with the latest figures. These counts are broken down by printing business classification (based on NAICS, the North American Industrial Classification System). We will continue to look at employment in the publishing categories:
- 5111 Newspaper, Periodical, Book, and Directory Publishers
- 51111 Newspaper Publishers
- 51112 Periodical Publishers
- 51113 Book Publishers
- 51114 Directory and Mailing List Publishers
- 51119 Other Publishers
- 511191 Greeting Card Publishers
- 511199 All Other Publishers
For some of these categories, we will also supplement County Business Patterns data with Nonemployer Statistics, which counts freelancers.
These data, and the overarching year-to-year trends, like other demographic data, can be used not only for business planning and forecasting, but also sales and marketing resource allocation.
This Macro Moment
In some good news, retail sales for March were up +9.8% from February. Says the Census Bureau:
Advance estimates of U.S. retail and food services sales for March 2021, adjusted for seasonal variation and holiday and trading-day differences, but not for price changes, were $619.1 billion, an increase of 9.8 percent (±0.5 percent) from the previous month, and 27.7 percent (±0.7 percent) above March 2020. Total sales for the January 2021 through March 2021 period were up 14.3 percent (±0.5 percent) from the same period a year ago.
March sales were above expectations, and the Census Bureau also revised January and February retail sales up from last month’s report.
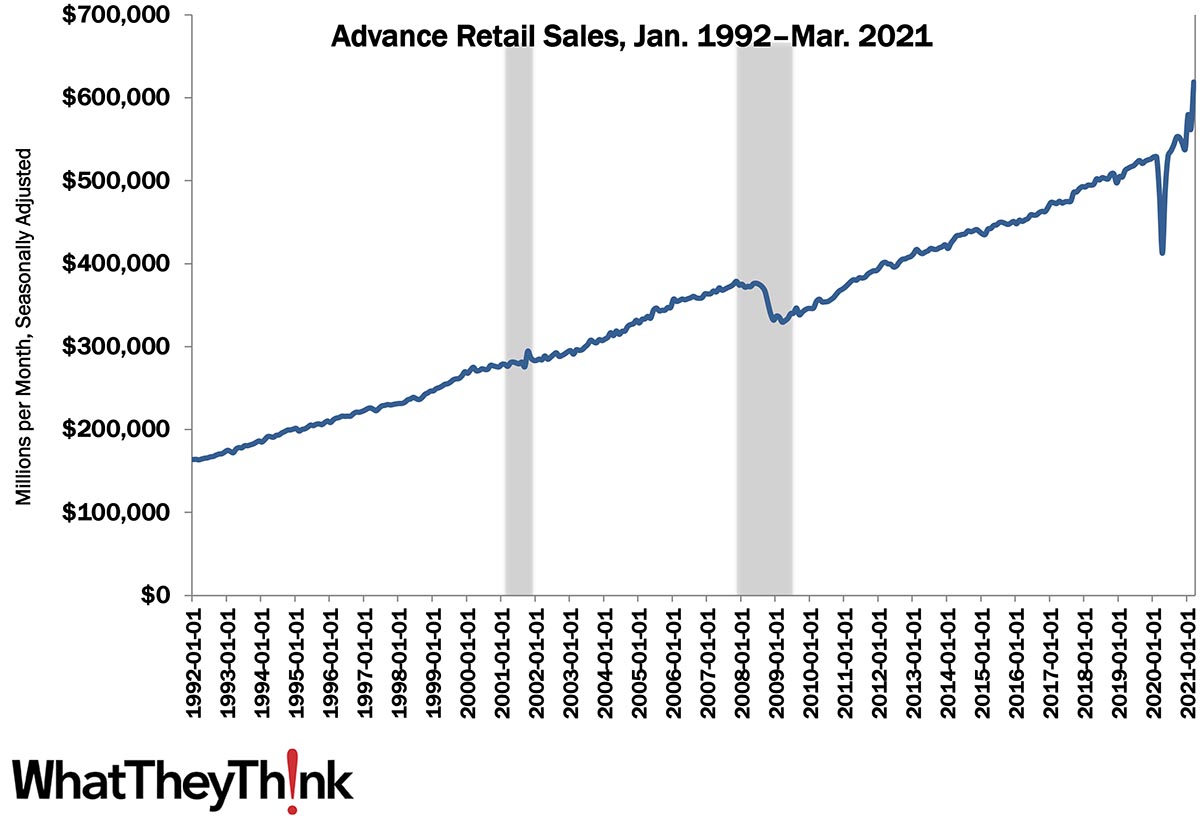
As more businesses open up as vaccinations continue, and warmer weather allows more outdoor dining, we will likely see retail sales continue to rise over the next few months. The scuttlebutt on the street is that, as a substantial portion of the population gets vaccinated, summer 2021 travel is going to be insanely busy (for those who hate crowds, another round of quarantining may be in order), which will also be good for retail as well as many other parts of the economy, including printing. The ghost of Dr. Doom still haunts these premises, but we are cautiously optimistic about the second half of the year.