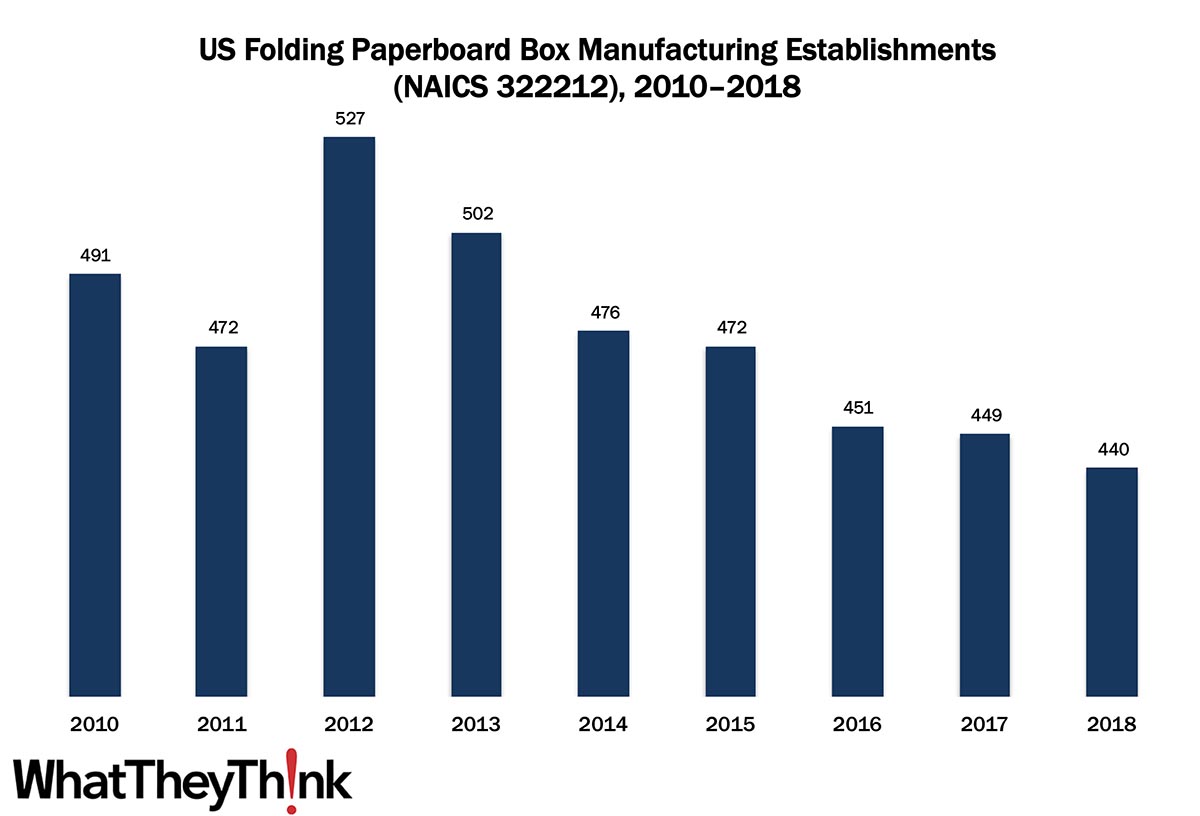
In our ongoing, semi-weekly look at establishment and employee counts of graphic arts businesses, we have turned to packaging/paper converting establishments. In 2010, there were 491 establishments in NAICS 322212 (Folding Paperboard Box Manufacturing), but by 2018, that number had declined to 440, despite a brief growth spurt in the early 2010s, culminating in a peak of 527 establishments in 2012.
The Bureau of the Census definition for this business classification:
This U.S. industry comprises establishments primarily engaged in converting paperboard (except corrugated) into folding paperboard boxes without manufacturing paper and paperboard.
In this category, digital printing of folding cartons is becoming common, accompanied by laser die-cutting to handle shorter runs. The growth of small boutique and craft businesses—such as microbreweries—has been fueling demand for high-quality, shorter-run packaging materials, especially folding cartons. At the same time, ecommerce driving demand for more and newer types of cartons, and is changing demand for different sizes—for example, cartons that are shipped to consumer vs. shipped to retailer. We are also starting to see “smart packaging,” which incorporates some kind of (often) electronic functionality for tracking or security purposes.
The four-digit NAICS 3222 comprises a variety of different converted packaging types, and we have been looking at them in turn. Upcoming categories are:
- 322219 Other Paperboard Container Manufacturing
- 32222 Paper Bag and Coated and Treated Paper Manufacturing
- 32223 Stationery Product Manufacturing
These counts are based on data from the Census Bureau’s County Business Patterns. Every other week, we update these data series with the latest figures. Census Bureau reports include other data, as well, such as number of employees, payroll, etc. These counts are broken down by publishing business classification (based on NAICS, the North American Industrial Classification System).
These data, and the overarching year-to-year trends, like other demographic data, can be used not only for business planning and forecasting, but also sales and marketing resource allocation.
Over time, we will be adding additional data from County Business Patterns, such as number of employees, payroll, and similar information for additional business classification of relevance to the graphic communications industry.
This Macro Moment
Last week, the Bureau of Economic Analysis (BEA) released its advance estimate of 3Q GDP and, increasing +33.1% (annual rate), was about what economists were expecting. Now, before everyone gets too excited by such a massively huge number remember that Q2 GDP decreased by -31.4%, so the +33.1% represents a climbing out of the hole. Calculated Risk calculates that all told, GDP is about 3.5% below the previous peak. Other highlights from the advance report are that personal consumption expenditures increased +40.7% (up from a -33.2% decrease in Q2), residential investment increased +59.3%, equipment investment increased +70.1%, and investment in non-residential structures—ouch—decreased -14.6%.
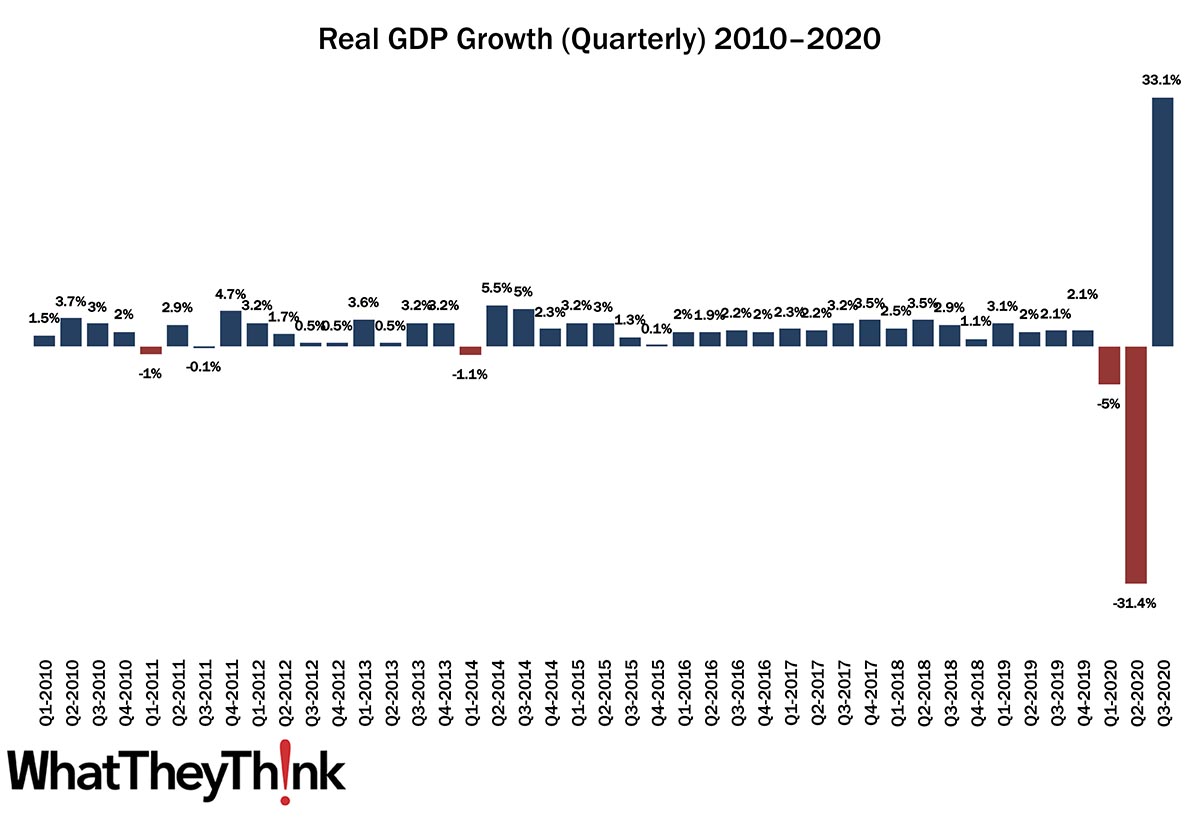
Are economists forecasting Q4 GDP yet? Of course they are! Via Calculated Risk, Merrill Lynch expects growth to slow to +3%; Goldman Sachs expects +4.5%; the NY Fed Nowcasting Report anticipates +3.2%; and the Atlanta Fed’s GDPNow is looking at+3.4%. This sounds good, but remember that it still represents some deep hole-climbing-out-of.
The next BEA estimate of Q3 GDP will be released on November 25.