Data Analysis
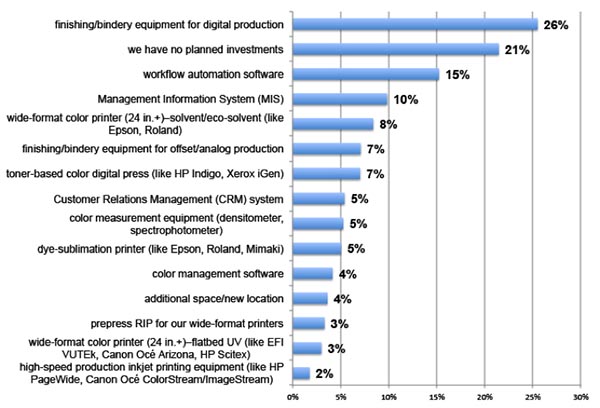
Print Business Outlook Survey: Which of the following investment items have you budgeted for and plan to acquire in the next 12 months?
Published: February 20, 2018
WhatTheyThink surveyed printing business owners and executives: "Which of the following investment items have you budgeted for and plan to acquire in the next 12 months?" Full Analysis
Consumer Durable Goods Still Struggle to Reach Recession Levels
Published: February 16, 2018
CPI-adjusted consumer durable goods manufacturing remains well below its pre-recession level—one of the reasons that GDP has been so lackluster. Full Analysis
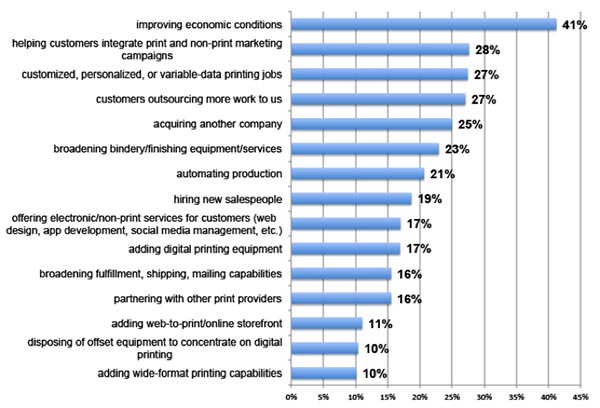
Print Business Outlook Survey: In the next 12 months, which of the following will be your biggest business opportunities?
Published: February 15, 2018
WhatTheyThink surveyed printing business owners and executives: "In the next 12 months, which of the following will be your biggest business opportunities?" Full Analysis
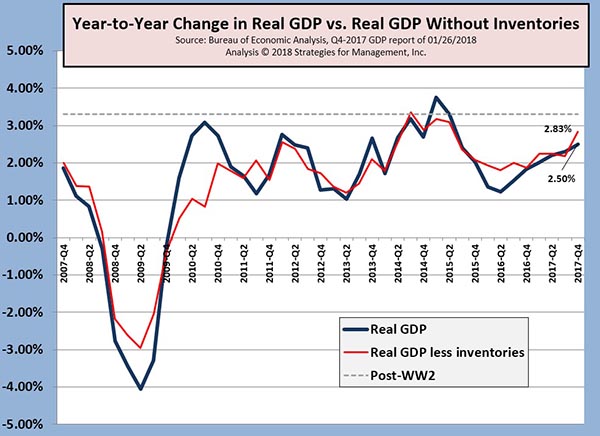
Q4-2018 GDP +2.6%, But +3.2% Excluding Inventory Effects
Published: February 9, 2018
The first report of fourth quarter GDP was a disappointing +2.6%. Sources such as the Atlanta Federal Reserve’s GDPNow and the New York Fed’s Nowcast were for a stronger reading. Inventories are a major factor in the volatility of GDP data, and excluding that data, the economy neared those estimates, producing a much better +3.2% rate compared to Q3. Full Analysis
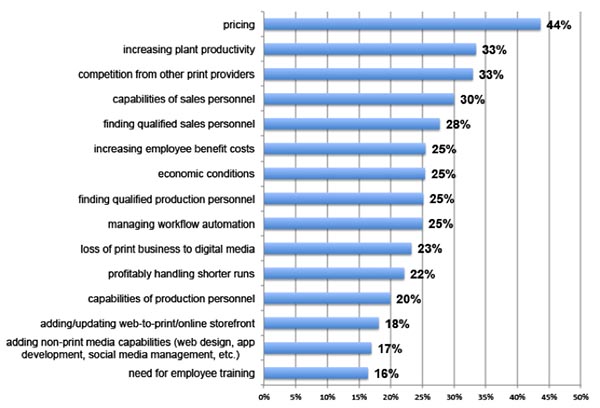
Print Business Outlook Survey: In the next 12 months, which of the following will be your biggest business challenges?
Published: February 5, 2018
WhatTheyThink surveyed printing business owners and executives: "In the next 12 months, which of the following will be your biggest business challenges?" Full Analysis
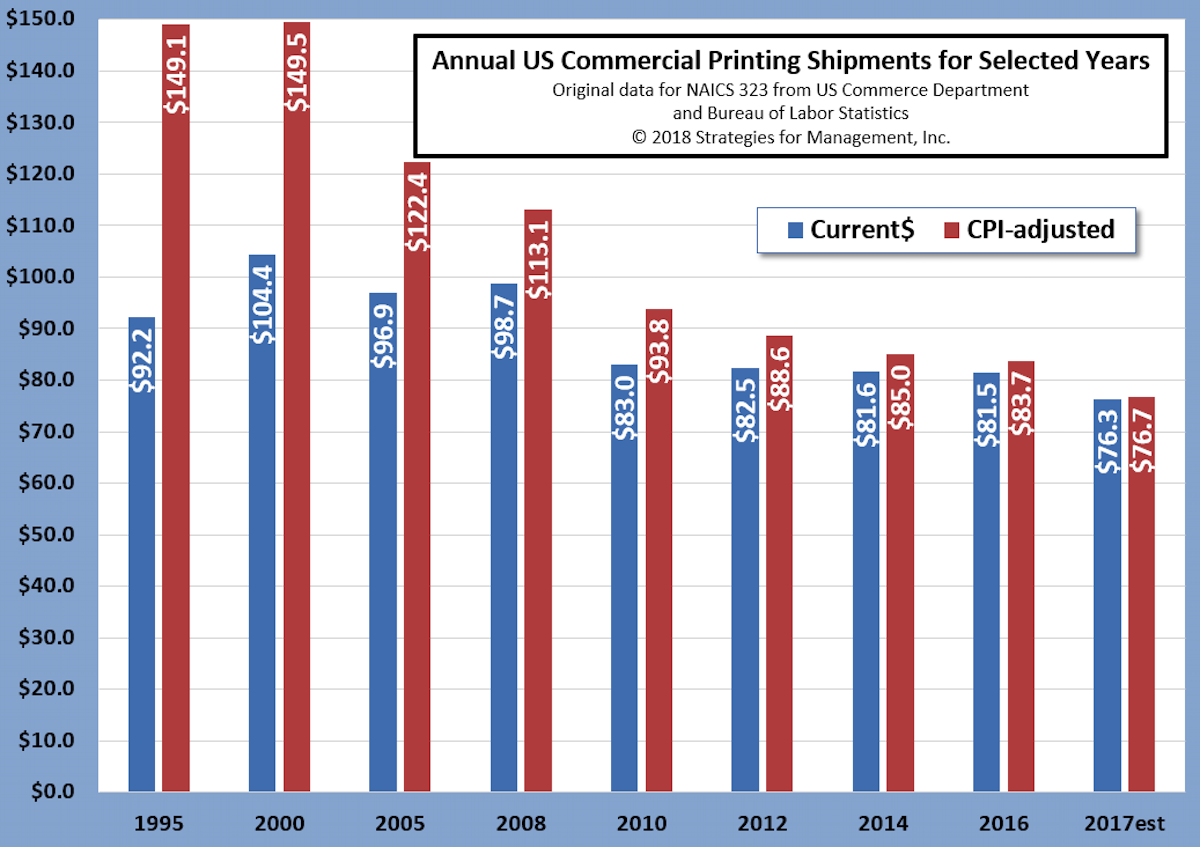
2017 NAICS 323 US Commercial Printing Industry Shipments
Published: February 2, 2018
The US Commerce Department has released data for November 2017, and this is the first look at the full year by making an estimate for December. Based on shipment and employment trends, it appears that 2017 came in at $76.3 in current dollars. That's a -6.4% decrease in current dollars compared to 2016, and a -8.4% decrease on an inflation-adjusted basis. The chart includes selected prior years starting at 1995. December data will be released at the beginning of February, and will be revised in March. In May, the Commerce Department will revise the last three years of data, plus minor revisions to the years prior to that. Full Analysis
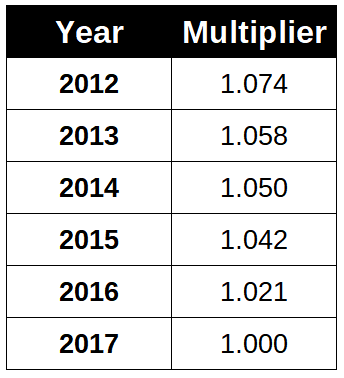
Latest Inflation Adjustment Multipliers
Published: January 29, 2018
Inflation distorts our interpretation of history and clouds business decisions. All dollars may look alike, but what a dollar bought in 1950 is a lot different than a dollar in 2017. Unfortunately, commercial printing prices have not kept up with inflation, but the costs of running a printing business usually have. This means that it's harder to keep earnings and payrolls up to this level. If past dollars had greater value, this chart can be used to adjust past financial statements to bring those data to current value. This is especially important in budgeting processes where looking for trends in prior years is one way of assessing performance and goals. Full Analysis
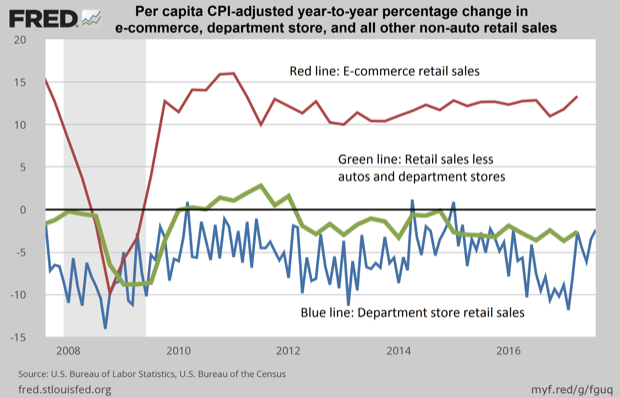
E-commerce is the only reason retail is growing
Published: October 5, 2017
Inflation and population changes often distort the analysis of economic trends. This chart shows the changing nature of retail sales on a per capita (per person) and inflation-adjusted (using the Consumer Price Index) basis by the percentage change compared to the same period of the prior year. Full Analysis
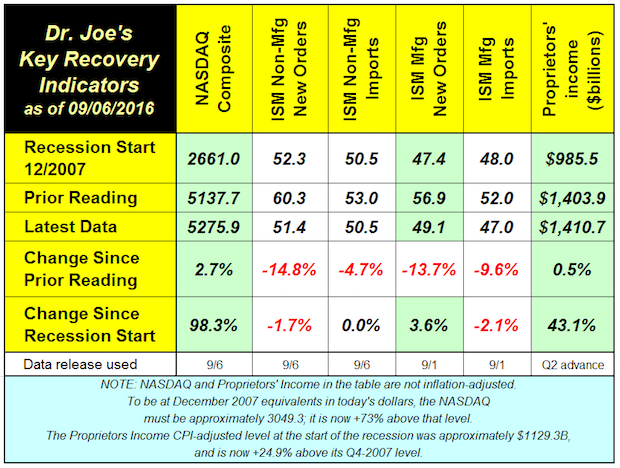
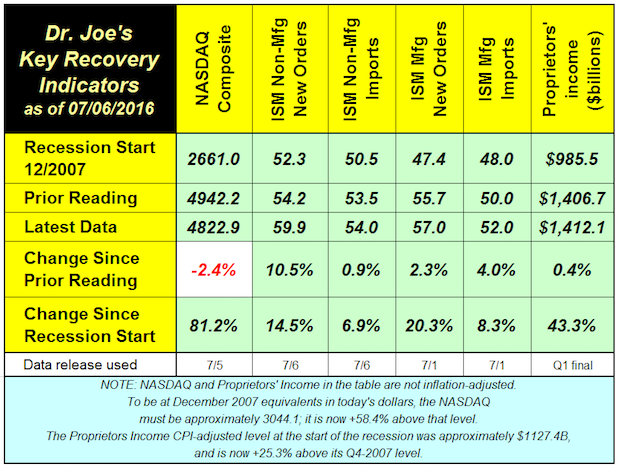
Dr. Joe's Key Recovery Indicators
Published: September 11, 2017
The recovery indicators (when we started these we thought they’d be around for about a year or so) had four of its six factors turn negative, with one of those falling back to its recession level of December 2007. Yes, that’s when the recession started. That long ago. Full Analysis
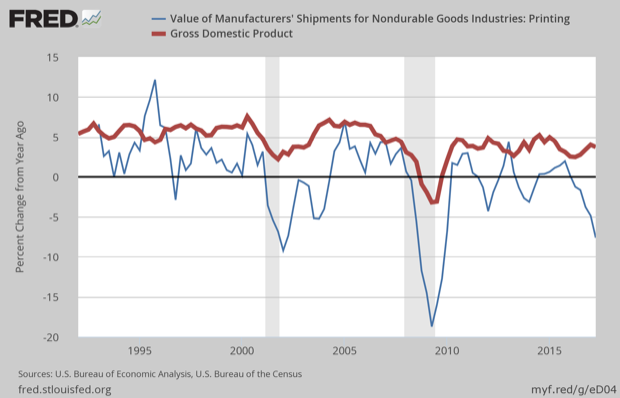
Updated Commercial Printing and New GDP Data
Published: August 17, 2017
The Bureau of Economic Analysis released the Q2-2017 GDP data and revisions to historical data beginning with 2014. Back in mid-May, the Commerce Department updated historical commercial printing shipments (NAICS 323) as part of its manufacturing shipments revisions. This week’s chart shows an updated view of both data series in current dollars (sometimes called “nominal;” both terms mean that data are not adjusted for inflation). The red line is year-to-year growth rate in GDP, and the blue line is year-to-year change in quarterly shipments. Since around 1997 printing shipments have not met GDP growth except for a moment between 2010 and 2015. The most recent printing shipments trend at the right of the chart are remarkable for their direction. A discussion of the GDP revisions and the current status of printing shipments can be found in the column of August 7.
Full Analysis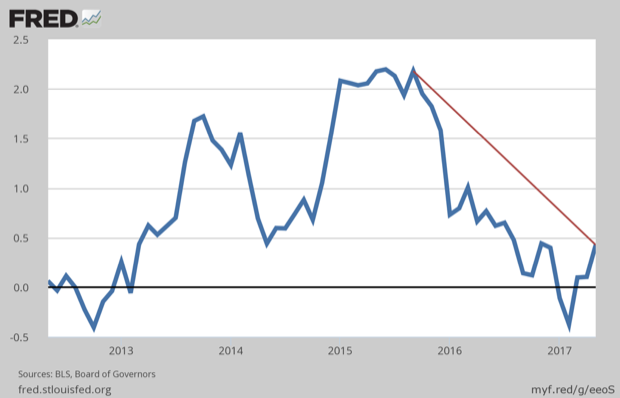
Did You Know Interest Rates Have Been Falling?
Published: July 6, 2017
The Fed has been so reticent about raising rates, and in the process, rates for the 10-year US Treasury actually were negative in February. No, that’s not market rates, that’s the 10-year rate less the year-to-year Consumer Price Index. Since that time, the rate calculated in this manner has moved up 80 basis points. The rate peaked in September 2015 and it’s been down since then. The Fed is having problems making the decision to raise rates, and often announced more rates in a future period but increasing rates at a slower pace. They have a target inflation rate of 2% (which means you lose about 25% of your savings over 10 years on a compounded basis). If you believe that the inflation rate is calculated in a manner that makes it seem lower than it actually is, then the Fed’s desire to see inflation at the 2% rate before they start pushing interest rates higher may be be difficult to reach or sustain. That means long term rates will stay artificially low (on purpose) for a longer period of time than most experts expect. Full Analysis
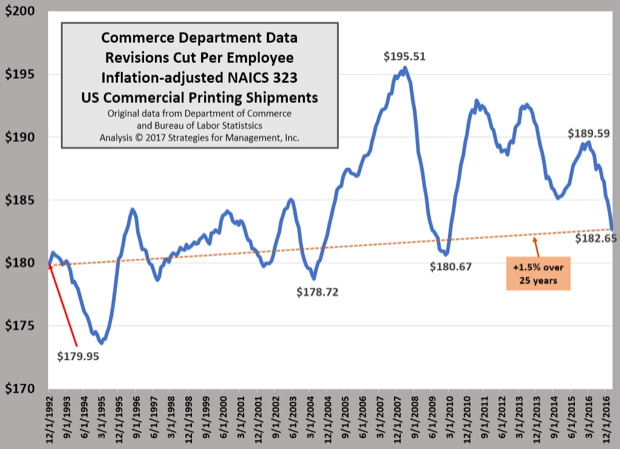
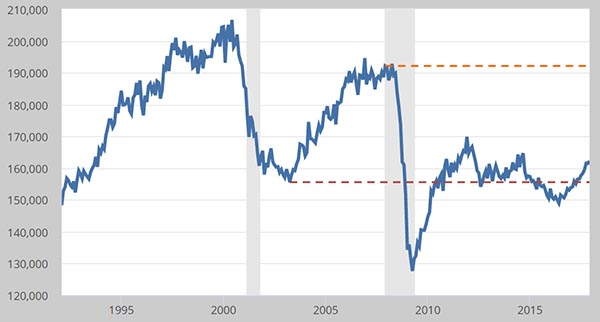
Inflation-adjusted Shipments per Employee
Published: May 25, 2017
The Commerce Department’s revisions to industry shipments show a much different picture of a key metric for the industry, sales per employee. The chart was created using 12-month moving totals of inflation-adjusted shipments and the 12 month moving average of total industry employment. The latest reading through March 2017 is $182.65 per employee, a meager +1.5% higher than it was at the end of 1992. It fell from a peak of $195.51 which was just before the burst of the housing bubble, the rise of social media platforms, tablets, and smartphones. The fall in this calculation has some interesting characteristics. Historically, large printing businesses focused on magazines, catalogs, and newspaper inserts, had sales per employee that were significantly higher than the industry averages, anywhere from 30% to 50% higher. Full Analysis
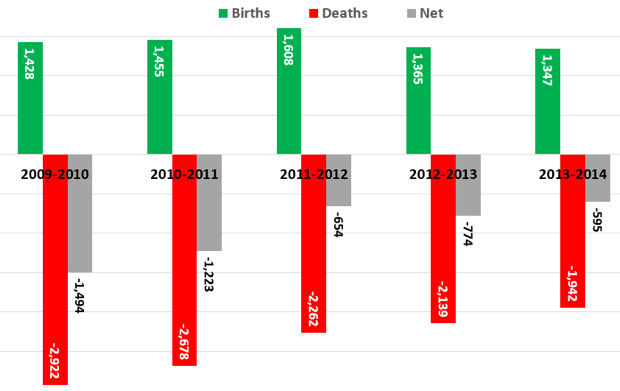
Births and Deaths of Commercial Printing Establishments, 2010 to 2014
Published: May 11, 2017
The Commerce Department tracks the number of business establishments by industry, and among he more interesting reports is the calculation of new and closed businesses. The data take a while to be released, and these new data about 2014 were recently made available. There’s a word of caution here. If someone was a corporation and decides to become a partnership or a proprietorship, that counts as one business closed and one business opened. And then there’s “poor man’s mergers” where two business owners decide to close their two businesses and open one new one. Same people, same equipment, no real change except to the tax authorities and government statisticians. The most important number is the net change of births less deaths. In the worst of the recession, the net number was 6% of establishments. For 2014, that had fallen to a little more than 2%. Full Analysis
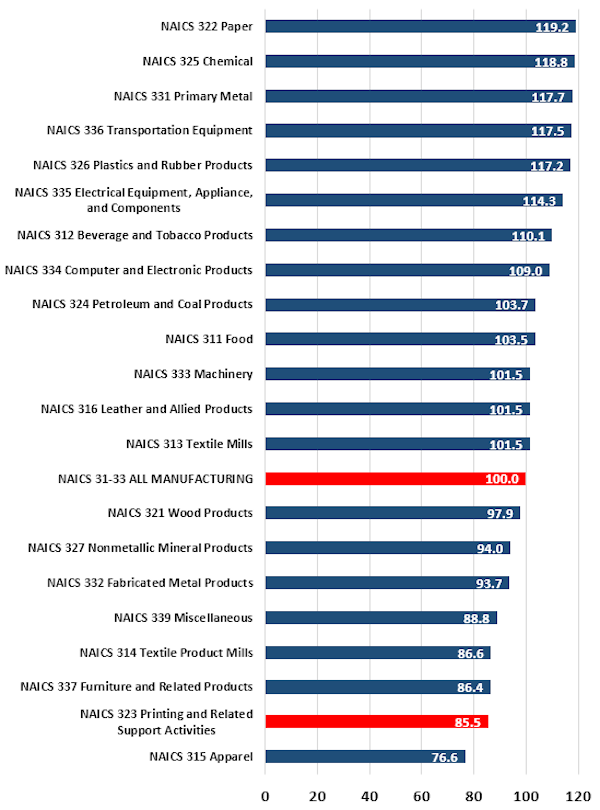
Printing Industry Lags Other Manufacturers in Defined Management Processes
Published: April 27, 2017
In what is not a surprise to many, the job shop operational structure of many printing businesses put the industry near the bottom of all manufacturing industries in terms of its management processes. Full Analysis
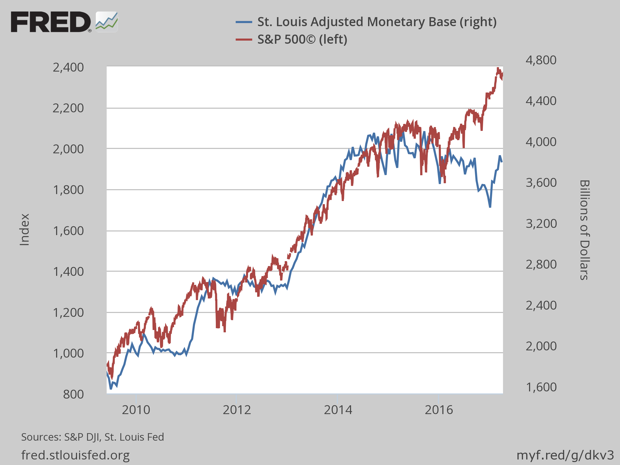
The Fed’s Balance Sheet and the S&P 500
Published: April 13, 2017
The financial markets were rattled a little bit by the recent minutes of the Fed meeting where they discussed the unwinding of their interventions and the ballooning of their balance sheet. The data are reflected in the St. Louis Fed Adjusted Monetary Base. The chart shows how the run-up in the S&P 500 stock index relates to the Fed’s quantitative easings Full Analysis
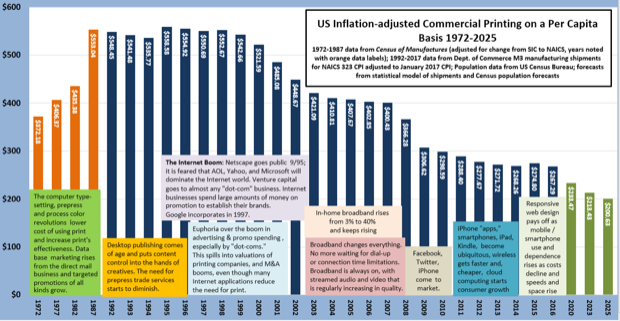
US Commercial Printing Shipments on a Per Capita Basis
Published: March 30, 2017
Yes, that sounds boring, but the data have been made interesting by including details about the last forty years or so of industry history and technological change. We added some statistical forecasts from our models that take the data out to 2025. When we started this chart almost ten years ago, those outlying years were near zero. They’re not any more (whew!). The data are inflation adjusted and based on the population data and forecasts of the US Census Bureau. It’s interesting how there are periods of relative stability, a change, followed by another period of stability. Technological change has been a much bigger factor affecting consumption than general economic conditions. Full Analysis
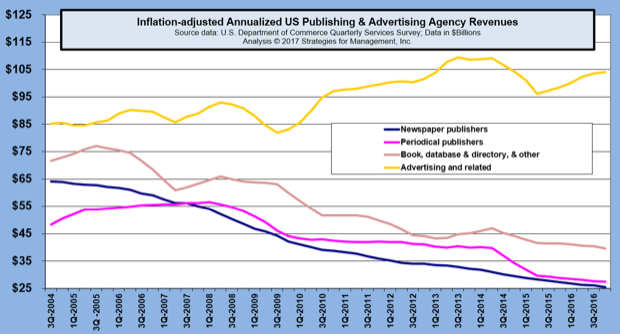
Ad Agency and Publisher Revenues
Published: March 23, 2017
Advertising agency revenues are having a slow rebound from their pullback in 2015. Publisher revenues are still having problems as ad pages and circulation are contracting. Clearly, agencies are finding other areas to garner revenues, especially in managing digital initiatives. Mobile communications are where their latest opportunities are, especially with website redesigns, creating the look and feel of content marketing for their clients, and assisting clients as they sort through the analytics that marketing automation offers. Full Analysis
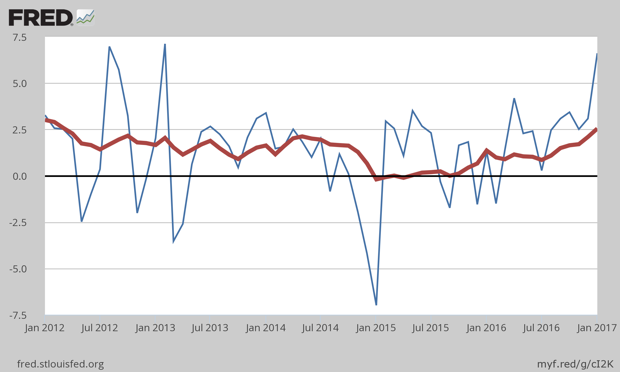
Consumer Inflation for 2016 at +2.5%, Giving Fed Reason to Increase Rates
Published: February 23, 2017
Consumer inflation for 2016 was increasing, with December’s reading +2.5% higher than 2015. December’s rate alone was at a +6.6% annualized rate. The chart shows the monthly comparisons as the blue line and the year-to-year comparisons as the heavier red line. Full Analysis
Employment Stalls; Printing Shipments Fall Sharply in December
Published: February 6, 2017
The national employment data may have had a headline of +227,000 payroll jobs, but the household survey did not indicate the same. Every year, the report released in February includes revisions to the prior year. The press release from the Bureau of Labor Statistics said that employment was “little changed.” Full Analysis
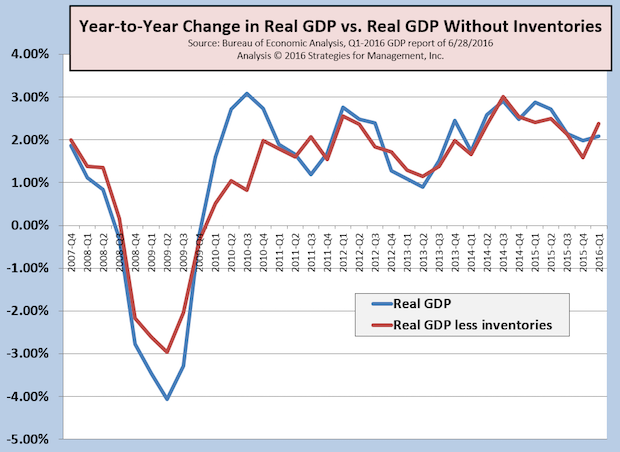
4Q-2016 GDP Slows to +1.9%, +0.9% Less Inventory Build-Up
Published: January 30, 2017
The fourth quarter of 2016 ended quiently, with a growth rate of +1.9% compared to the third quarter. That brought 2016 to an overall growth rate of +1.6%. Full Analysis
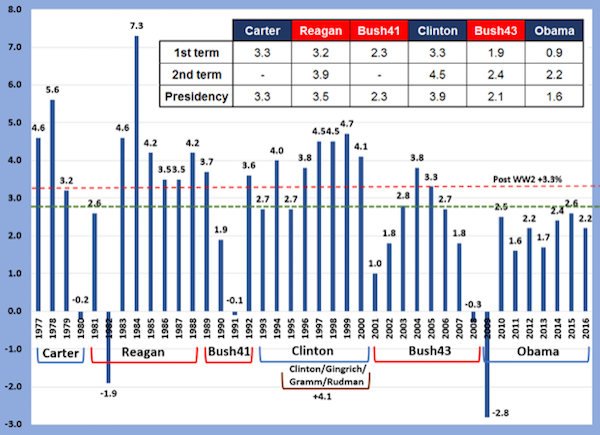
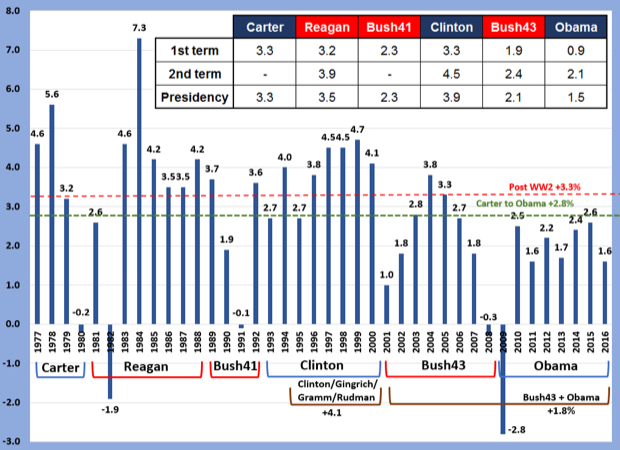
Real GDP for Six Presidential Administrations
Published: January 26, 2017
A new administration is in Washington, so we created a chart that looks back at general economic conditions of the prior six administrations. Full Analysis
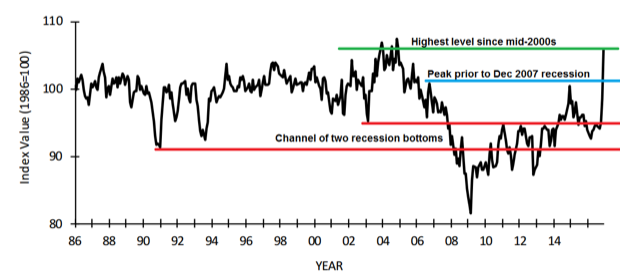
Small Business Index Rockets Up to Mid-2000s Level
Published: January 12, 2017
The NFIB's small business index came in at 105.8. It has had two months near-vertical increase, now at levels not seen since December 2004 when it was 106.1. It's sheer optimism that small business concerns about taxes, regulation, and the economy will improve. There are many reports about improved confidence, especially among consumers, but it seems like it's too much too soon. While the new administration might be able to provide some regulatory relief in its early days, most of its desired actions require acts of Congress. Those can sometimes take forever... or longer. Full Analysis
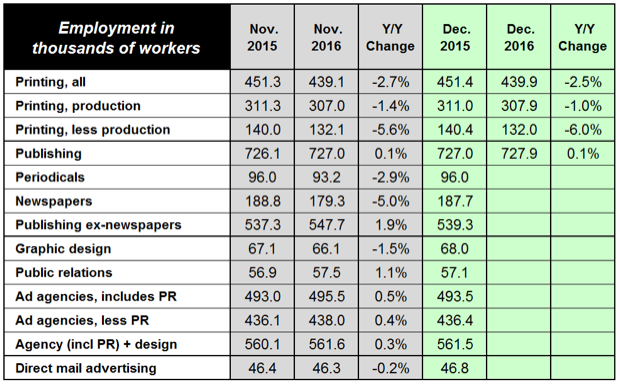
US Commercial Printing Industry Employment Finishes -2.5%; Consolidation Effects Evident
Published: January 11, 2017
The US commercial printing industry finished the year with 439,900 employees, down -11,200 compared to 2015. The number of production employees was down -3,100, a -1.0% decrease. Non-production employees represented the biggest change, down -8,400 (-6.0%). Full Analysis
Recovery Indicators January 2017
Published: January 9, 2017
With the Dow Jones and S&P 500 at all-time inflation-adjusted highs. The recovery indicators are stronger than they have been in a while, with very bullish increases in new orders for manufacturing and non-manufacturing sectors, and a strong reading of the NASDAQ stock index. Full Analysis
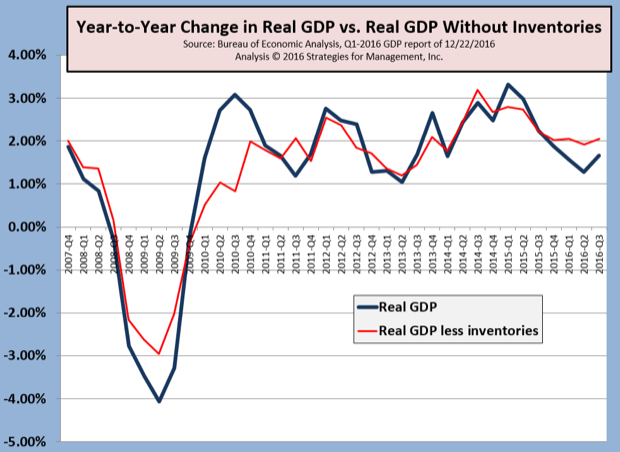
3Q-2016 Real GDP Revised Up Again; Did US Just Emerge from an Unrecognized Recession?
Published: December 22, 2016
The Bureau of Economic Analysis released its third report of real Gross Domestic Product, at an annualized +3.5% over the second quarter. This is considered the final report, revising the advance report of +2.9% two months ago, and +3.2% in last month's preliminary report. This is important because each release of GDP data is based on increasing amounts of actual reported data. The advance report relies the most on estimates and models. Full Analysis
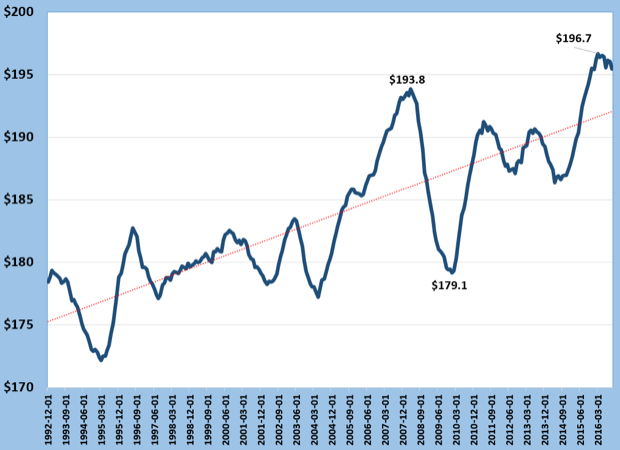
Commercial Printing Inflation-Adjusted Shipments Per Employee
Published: December 16, 2016
The effects of consolidation, a challenging pricing environment, cost controls and productivity measures have sent shipments per employee to unprecendented levels. The prior peak was just before the recession began. The industry is more efficient in many ways, especially with the exit of weak and marginal establishments. But is it more profitable? In the December 15 webinar and in the new Forecast 2017 report, industry profit levels are discussed. Despite reaching new levels of sales per employee, profit levels have become tepid, a sign of tightening market conditions. In the webinar we discussed the possibility that another wave of media change is underway. The last major one was the rise of social media ten years ago, and now the growing impact of mobile media, especially this year. Full Analysis
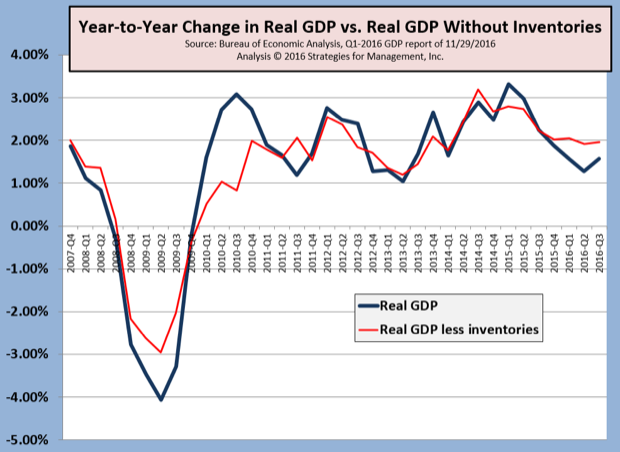
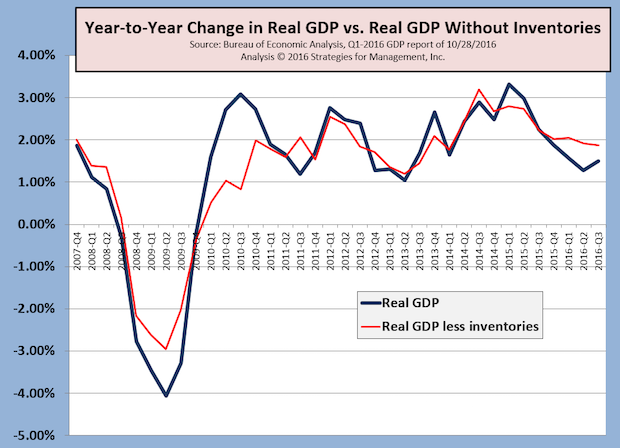
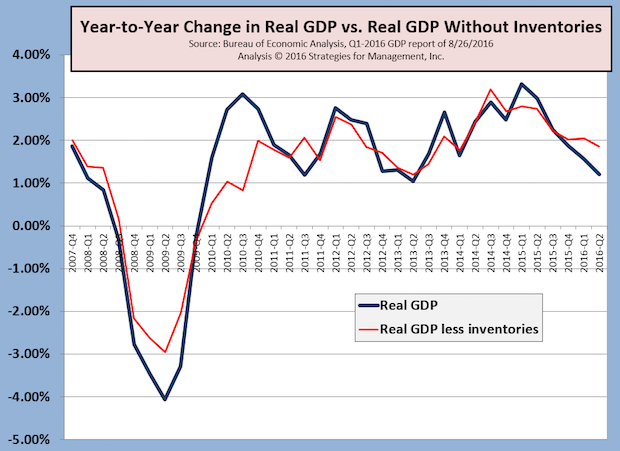
Q3-2016 Real GDP Revised Up from +2.9% to +3.2%; Little Change in Yearly Comparison
Published: December 1, 2016
The Bureau of Economic Analysis issued its second estimate of real gross domestic product, raising it to +3.2%. Real GDP for 2Q-2016 was +1.4%. Each advance release of GDP data is revised monthly as “more complete source data” is used rather than estimates. We prefer comparing GDP data to the same quarter as the prior year, which helps minimize the variation and possible distortions of seasonal adjustments. Compared to last year, Q3-2016 was +1.6%. Because inventory changes can distort GDP estimates, we also look at the data less inventories, and it shows the economy still hovering around a +2.0% growth rate. Lately, the inventory adjustments have been small. Theoretically, they should be zero in the long run, and for these last two quarters that has nearly been the case. In 2015, it averaged +$82 billion per quarter. Some of 2016's sluggish performance has been an inventory adjustment in the overall economy. The Atlanta Fed's GDPNow estimate for the current Q4 is running at +2.4%. Full Analysis
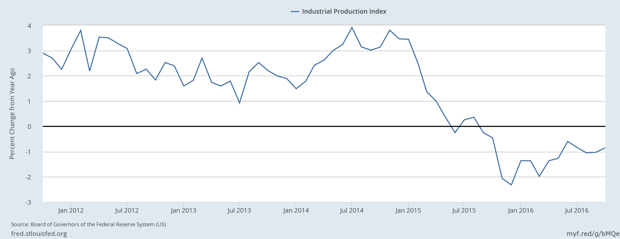
Fed's Industrial Production Index Down for 13 Consecutive Months: A Recession on Inauguration Day?
Published: November 17, 2016
Will the newly inaugurated President Trump be dealing with a recession like his predecessor did? In December 2008, a recession was declared, and the experts said it started almost a year before then. Several economic indicators, like durable goods orders and factory orders, have been negative compared to the prior year's level for almost two years. The Federal Reserve's Industrial Production Index released on November 16 marked its thirteenth consecutive negative comparison to the prior year. The only sector that is holding up in the GDP reports is the consumer side of that bookkeeping. That can't hold up for long unless the production and investment side of the GDP ledgers start to perk up. There is optimism in the markets about a Trump recovery, but it must be noted that there are many legislative hurdles ahead, and most economic plans take about 18 months to develop notable impact. Full Analysis
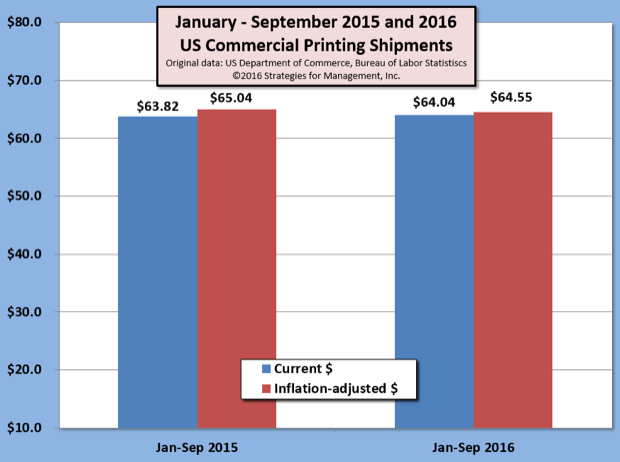
US Commercial Printing Shipments in Mild Downturn; Employment Consolidation Continues
Published: November 7, 2016
US commercial printing shipments for September 2016 were down -$8 million compared to the prior year (-0.1%). On an inflation-adjusted basis, shipments were down by -$118 million. Interestingly, inflation-adjusted August shipments were up by +$118 million, making the net change for the two months zero. Full Analysis
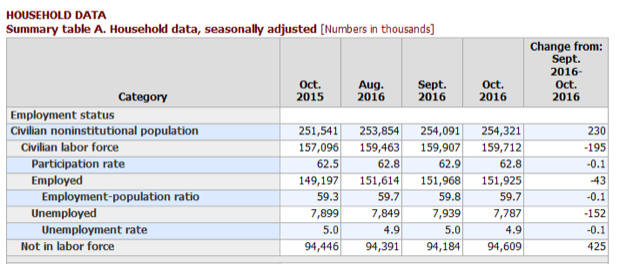
US Employments Report: Not What the Headlines Said
Published: November 7, 2016
The business headlines about the October employment report may have said “unemployment rate falls to 4.9%; payrolls grow +161,000,” but the details of the overall employment picture deteriorated. Full Analysis
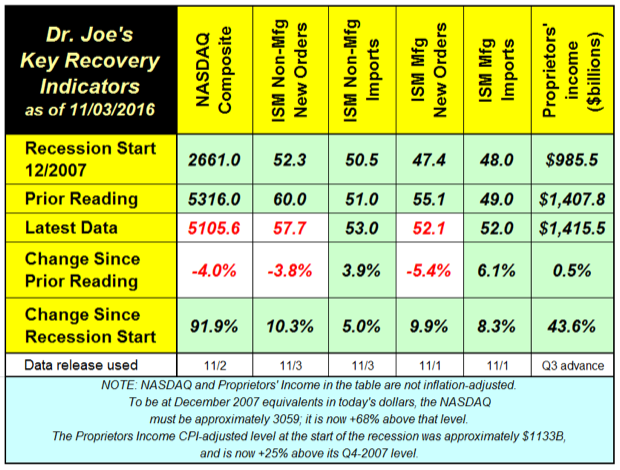
Recovery Indicators Mixed Again
Published: November 4, 2016
Last month's recovery indicators bounced back big from a dreadful report, but this month's have moderated. The ISM manufacturing and non-manufacturing new orders decreased, but they are still above the 50 breakeven level, showing growth. The non-manufacturing side is still strongly on the growth side of the line. Full Analysis
Q3 Real GDP +2.9%; Soybeans Lead the Charge?
Published: November 1, 2016
Prior to the release of Q3's advance estimate of real GDP, the Atlanta Fed's GDPNow forecast was +2.1%. The official figure came in much better, at +2.9%. It is likely to be revised down slightly, but it was a much better showing than recent data. Full Analysis
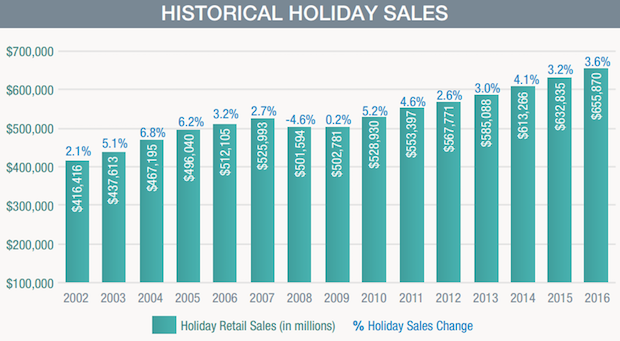
National Retail Federation Forecasts +3.6% in Holiday Retail Sales
Published: October 29, 2016
The National Retail Federation issued its forecast of holiday retail sales. It expects a +3.6% increase compared to 2015. But what's the real increase? After deducting for inflation, that's about +1.5%. If real GDP comes in at +2% in the October 28, 2016 advance report for Q3, holiday retail sales growth will be in line with the growth rate of +1.4% for the year. In some ways, this can be a good year compared to recent history. Holiday retail sales have averaged +2.46% since 2007, with a net after inflation of only +0.64%. On a per person basis, that's actually a decline in that period. Full Analysis
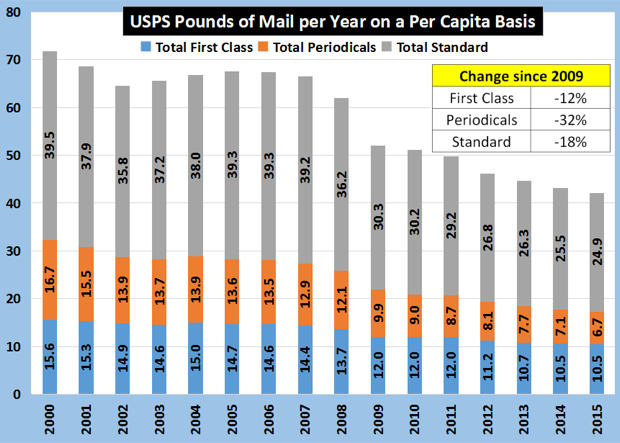
Per Capita Pounds of Mail
Published: October 13, 2016
Since the beginning of the economic recovery in 2009, first class mail is down by -12%, standard mail (discounted bulk mail) down by -18%, and periodicals down a whopping -32%. Full Analysis
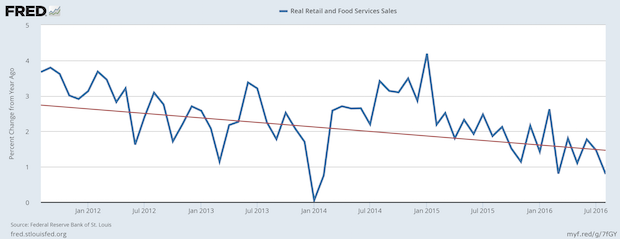
Manufacturing May Be Declining, but Real Retail Sales are Still Positive
Published: September 22, 2016
Data about manufacturing from the ISM and the Commerce Department have show a contraction compared to the prior year. In some cases that slowdown and contraction has been in process for 18 or more months. Retail sales and consumer spending have been the brighter spots of the economy. The inflation-adjusted growth rate of retail sales has been slowing since the beginning of 2015. Full Analysis
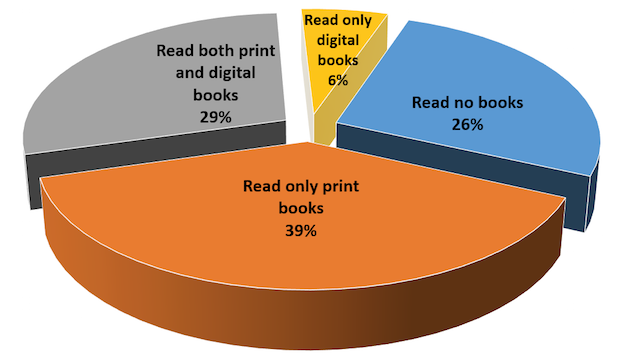
Pew Offers Essential Insights into Book Readership
Published: September 15, 2016
The Pew Research Center's recent report about book reading gives us a peek at the relationship of print and digital media. The report says “A growing share of Americans are reading e-books on tablets and smartphones rather than dedicated e-readers, but print books remain much more popular than books in digital formats.” The chart shows what formats their respondents used in the year prior to the survey. Only 6% were digital-only readers. The report states that 26% read no book in the last year; they may have read other things, but not books. Contrary to many reports about the “demise” of e-books, that has risen from 17% to 28%. It's been stuck there for three years. Print-only readers were 39% (remember: that used to be the entire market of book readers). Print and digital readers are now at 29%. Add the 6% digital-only, and you're at 35%. Content needs to be available in multiple media. Media selection is based on many factors, such as time, convenience, price, income, education, age, and others. Pew also offers insights into the use of audiobooks. The report is free can be downloaded from the Pew Research Center. One other note: when you hear that tablet sales are down or that e-book reader sales are down, keep in mind the versatile use of smartphones and their growing role in content engagement. Among readers 18-29 years old, 22% of them are reading books on their smartphones, 4x more than read them on e-book readers. Full Analysis
Four of Six Recovery Indicators Fall, Two Now Below Levels of Last Recession
Published: September 8, 2016
The recovery indicators were hit hard last month last month, with two of them falling below the levels at the start of the last recession. Those levels were the readings of these indicators for December 2007. Full Analysis
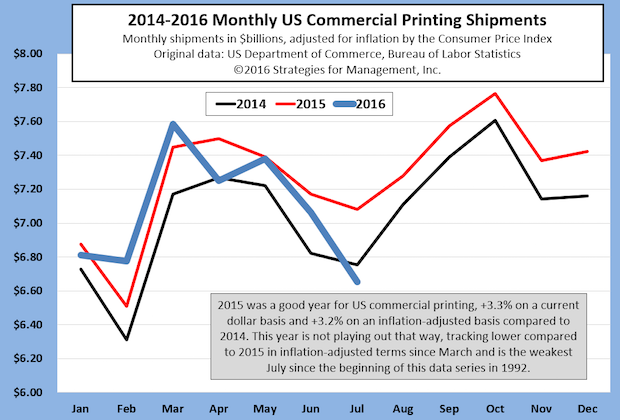
US Commercial Printing Shipments Have Rough July
Published: September 7, 2016
The reversal in trend for US commercial printing shipments went from somewhat benign to significant in July's data. Last year, the industry was relatively stronger than 2014, but shipments have been on a downturn for the last four months of reporting. Full Analysis
Real GDP for Q2 Revised Down Slightly to +1.1%; Durable Goods Orders Still Contracting
Published: August 29, 2016
The latest revision of real US GDP for Q2-2016 dropped from +1.2% to +1.1%. The estimate for Q3 from the Atlanta Fed is above +3%. Full Analysis
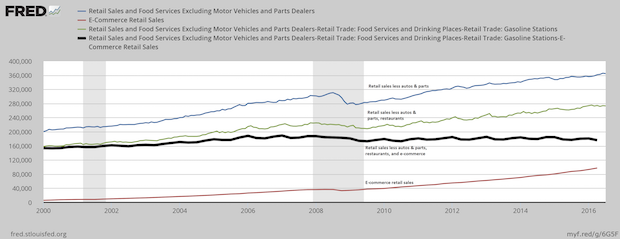
E-Commerce and US Retail Sales
Published: August 25, 2016
E-commerce has been running at the rate of 15% annual growth for many years, but is just 8% of retail sales. That seems tiny in relation to what we've seen happen to print promotions like catalogs and direct mail, and the rise of zombie or troubled shopping malls. The problem is that big ticket items, like autos, raise the size of retail sales. Those items may be researched online, but their actual purchase is not made until it is transacted at a car dealer. Restaurant purchases are also a distorting issue in the data. This chart explains it a little better. E-commerce sales is at the bottom (red line). In the second quarter, it was just short of $100 billion. The blue line is retail sales less vehicles and parts. The green line has food service sales deducted. The black line had e-commerce sales deducted, and shows retail sales through traditional channels. Those sales through older channels are lower than they were at the start of the recession. All of the growth in non-auto and non-restaurant retail for the last decade has occurred in e-commerce channels. Full Analysis
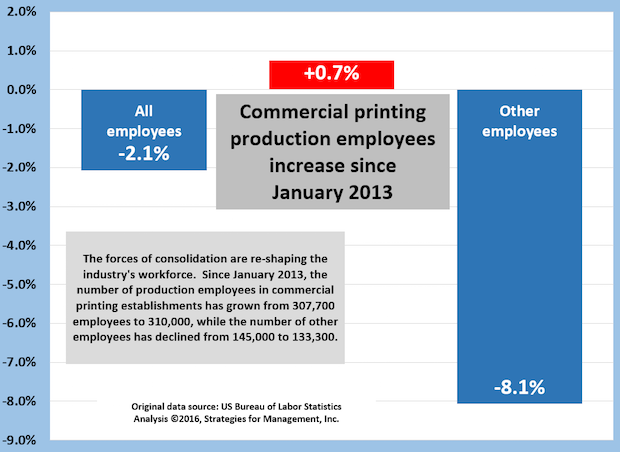
Commercial Printing Employment: Production Employees Up +0.7%, Administrative Down -8.1%
Published: August 11, 2016
Since January 2013, the number of production employees in commercial printing establishments has grown slightly, and is up +0.7%, from 307,700 employees to 310,000. Other employees, which are mainly administrative including sales, are down -8.1%, from 145,000 to 133,300. Full Analysis
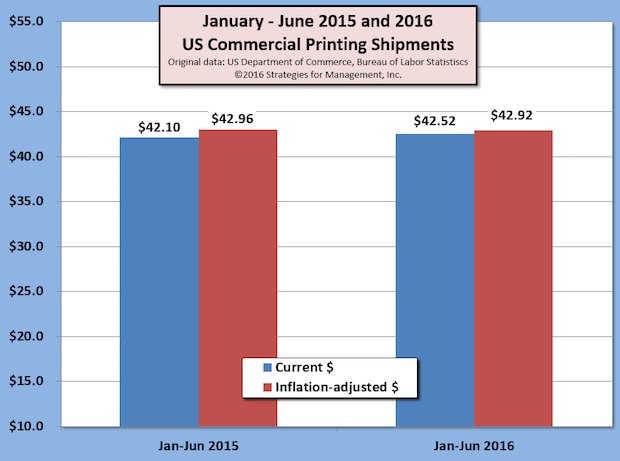
US Commercial Printing Shipments for First Half of 2016 Up +1%; Q2 Shipments Decline
Published: August 5, 2016
In data released by the US Department of Commerce, commercial printing shipments for June 2016 were down -$58 million compared to last year (-0.8%). On an inflation-adjusted basis, shipments were down -$130 million (-1.8%). Full Analysis
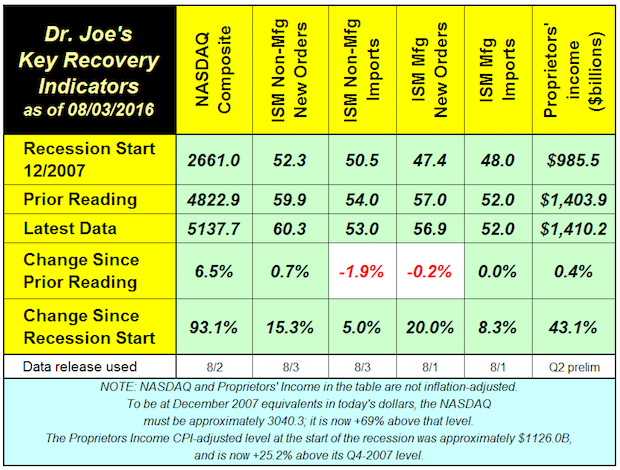
Recovery Indicators: 3 Up, 2 Down, 1 Unchanged
Published: August 4, 2016
The NASDAQ had a good month, rebounding by 6.5% last month. Compared to last year at this time, the NASDAQ is up +0.6%, which is a negative return compared to inflation (less inflation it is -0.5% because the CPI is +1.1%). Full Analysis
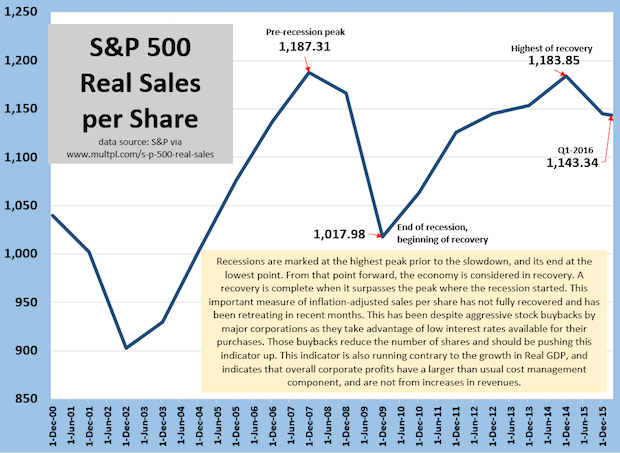
S&P 500 Real Sales per Share Reflects Struggling Economy
Published: July 28, 2016
A way of judging the health of the economy is to calculate the inflation-adjusted sales of all of the companies in the S&P 500 and divide it by the total number of public shares. This index should have a natural upward bias. S&P 500 companies are very large, and acquire or merge with other companies, many of which are outside of the 500 companies. Buybacks of stock, which has been a trend of note these last five or so years, reduce the number of shares, or slow the growth in shares, reduce the denominator, again, giving it an upward bias. Instead, this measure has suffered. It peaked in 2007, and has yet to surpass that level. This means that corporate profits, which have generally been good (though slowing lately) have been managed by refinancing of debt to lower interest rates and reductions in costs and expenses. Those better profits are not the result of increased revenues. Slow, sluggish economic growth is reflected in these figures, and is a reminder that one should not look only to GDP as an indicator of the true health of the private sector. Full Analysis
Recovery Indicators Better than Recent Economic News
Published: July 7, 2016
The recovery indicators showed better economic activity in June. This ended the second quarter in a manner that seemed contrary to many recent economic data. Full Analysis
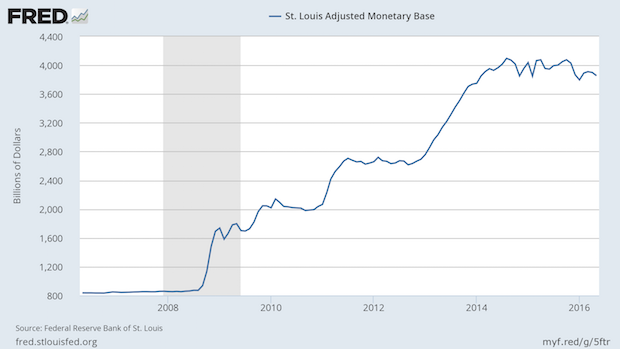
Are We Headed to QE4?
Published: July 7, 2016
This chart shows the Fed's balance sheet in the format known as the St. Louis Adjusted Monetary Base. Prior to the doubling of that balance sheet, it was growing at the annual rate of 6%, which was basically comprised of the long term rates of 1% for population growth, 2% for inflation, and 3% for economic growth. Full Analysis
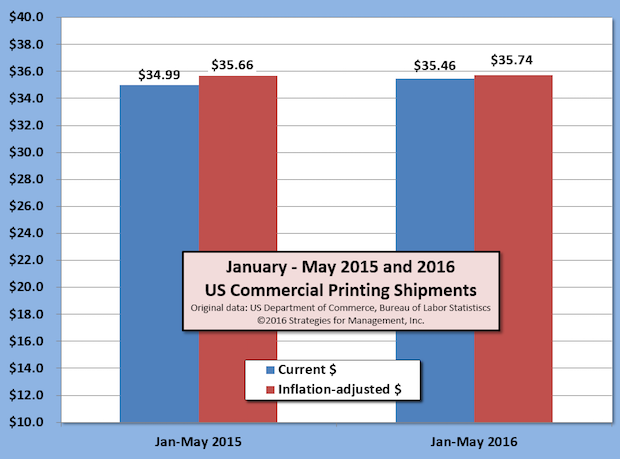
May Printing Shipments Up +1.2% Versus 2015; Trend is Flattening
Published: July 6, 2016
US commercial printing shipments for May16 were $7.37 billion, the highest level in current dollars for the month since 2013. For the first five months of 2016, shipments are up approximately +$476 million in current dollars (+1.4%) and up +$79 billion after inflation (+0.2%) Full Analysis
US Q1-2016 GDP Revised to +1.1%
Published: June 30, 2016
US real GDP for Q1-2016 had its third and final revision in this reporting cycle, and was +1.1% on an annualized basis compared to Q4-2015. Q1 had been reported as +0.5% in its advance report, +0.8% in the preliminary report, and now as +1.1%. Real GDP remains very low compared to the post-WW2 +3.3% rate. Full Analysis
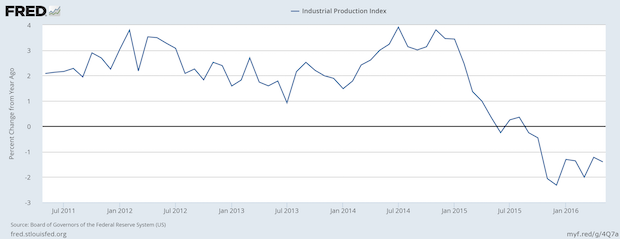
Industrial Production Continues its Negative Turn
Published: June 23, 2016
The Fed’s own data probably caused them to have a more dour outlook about the economy. The chart shows that US industrial production started slowing at the end of 2014 and has been in outright contraction since Fall 2015. Full Analysis
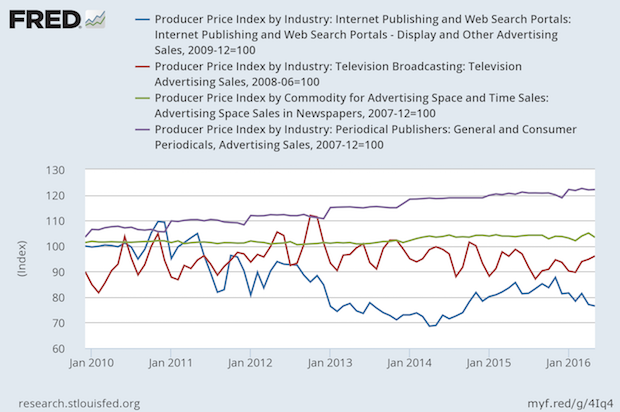
Prices for Advertising Rise for Magazines, Stable for TV and Newspapers, Down for Digital
Published: June 16, 2016
The chart shows that magazine advertising has gone up by more than 20% since 2010, but it's hard to know how much might have been bundled in those prices. Pricing reports sent to the Bureau of Labor Statistics are supposed to be in constant units, but it's hard to determine those in service environments, and it's hard to quantify a wink or a nod in an advertising agreement. Full Analysis
This is the Last Page


![]()
- Inkjet Integrator Profiles: Integrity Industrial Inkjet
- Revisiting the Samba printhead
- 2024 Inkjet Shopping Guide for Folding Carton Presses
- The Future of AI In Packaging
- Inkjet Integrator Profiles: DJM
- Spring Inkjet Update – Webinar
- Security Ink Technologies for Anti-Counterfeiting Measures
- Komori unveils B2 UV Inkjet

WhatTheyThink is the official show daily media partner of drupa 2024. More info about drupa programs
© 2024 WhatTheyThink. All Rights Reserved.