Data Analysis
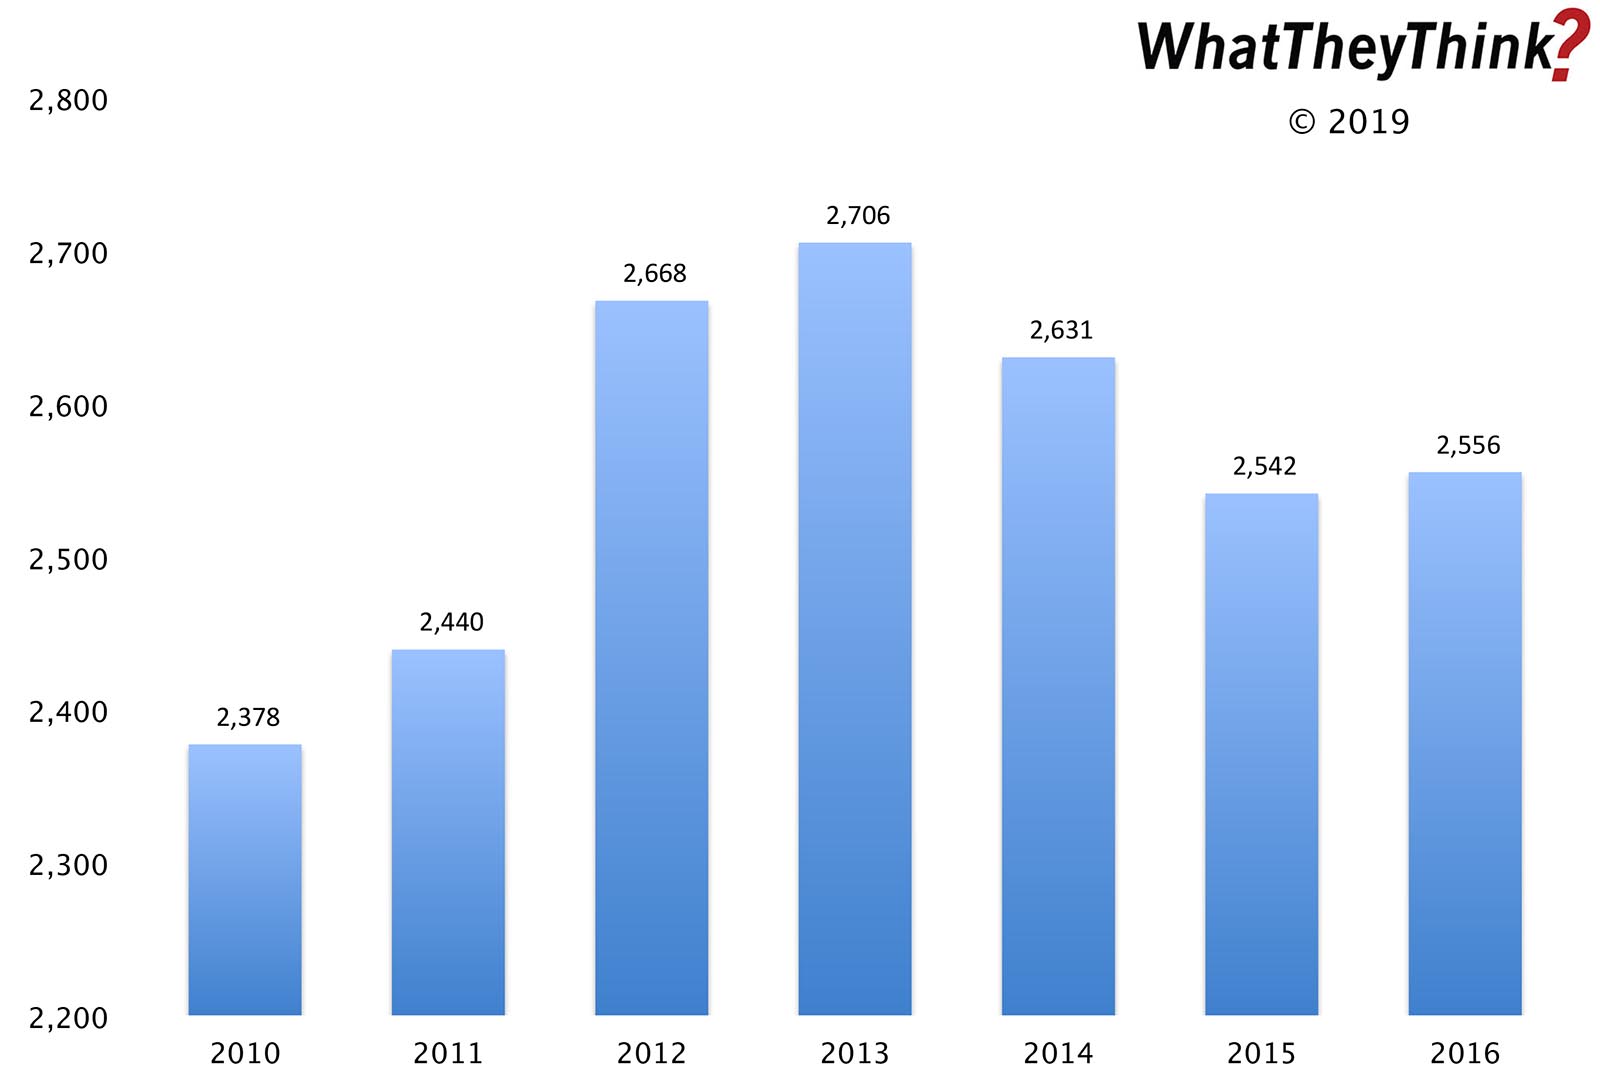
Outdoor Advertising Establishments—2010–2016
Published: April 12, 2019
In 2016, there were 2,556 establishments classified as Outdoor Advertising (NAICS 54185). In 2010, NAICS 54185 comprised 2,378 establishments—but note that the Census Bureau changed the name of this category in 2012. Full Analysis
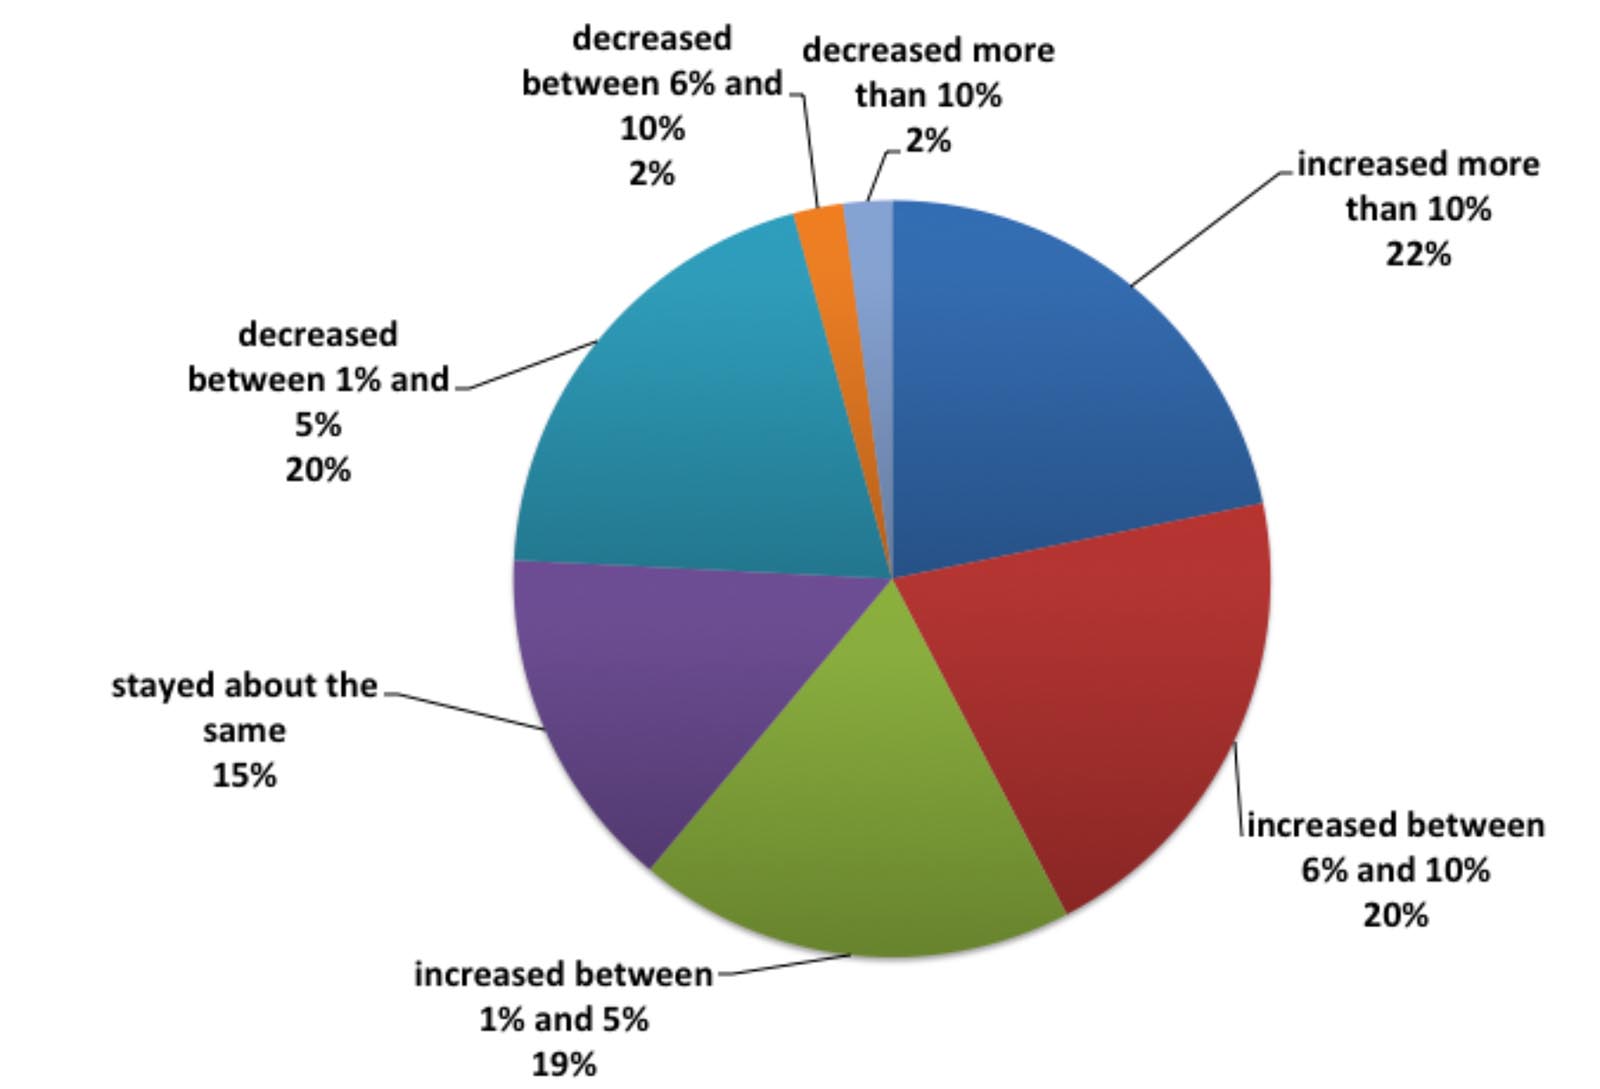
Business Conditions: Up in 2018, Optimism High for 2019
Published: April 5, 2019
In Winter 2018/2019, we conducted our annual Print Business Outlook Survey and found that business in 2018 was perceived by survey respondents as overall pretty good: 42% said that revenues had increased by six percent or more compared to 2017. Full Analysis
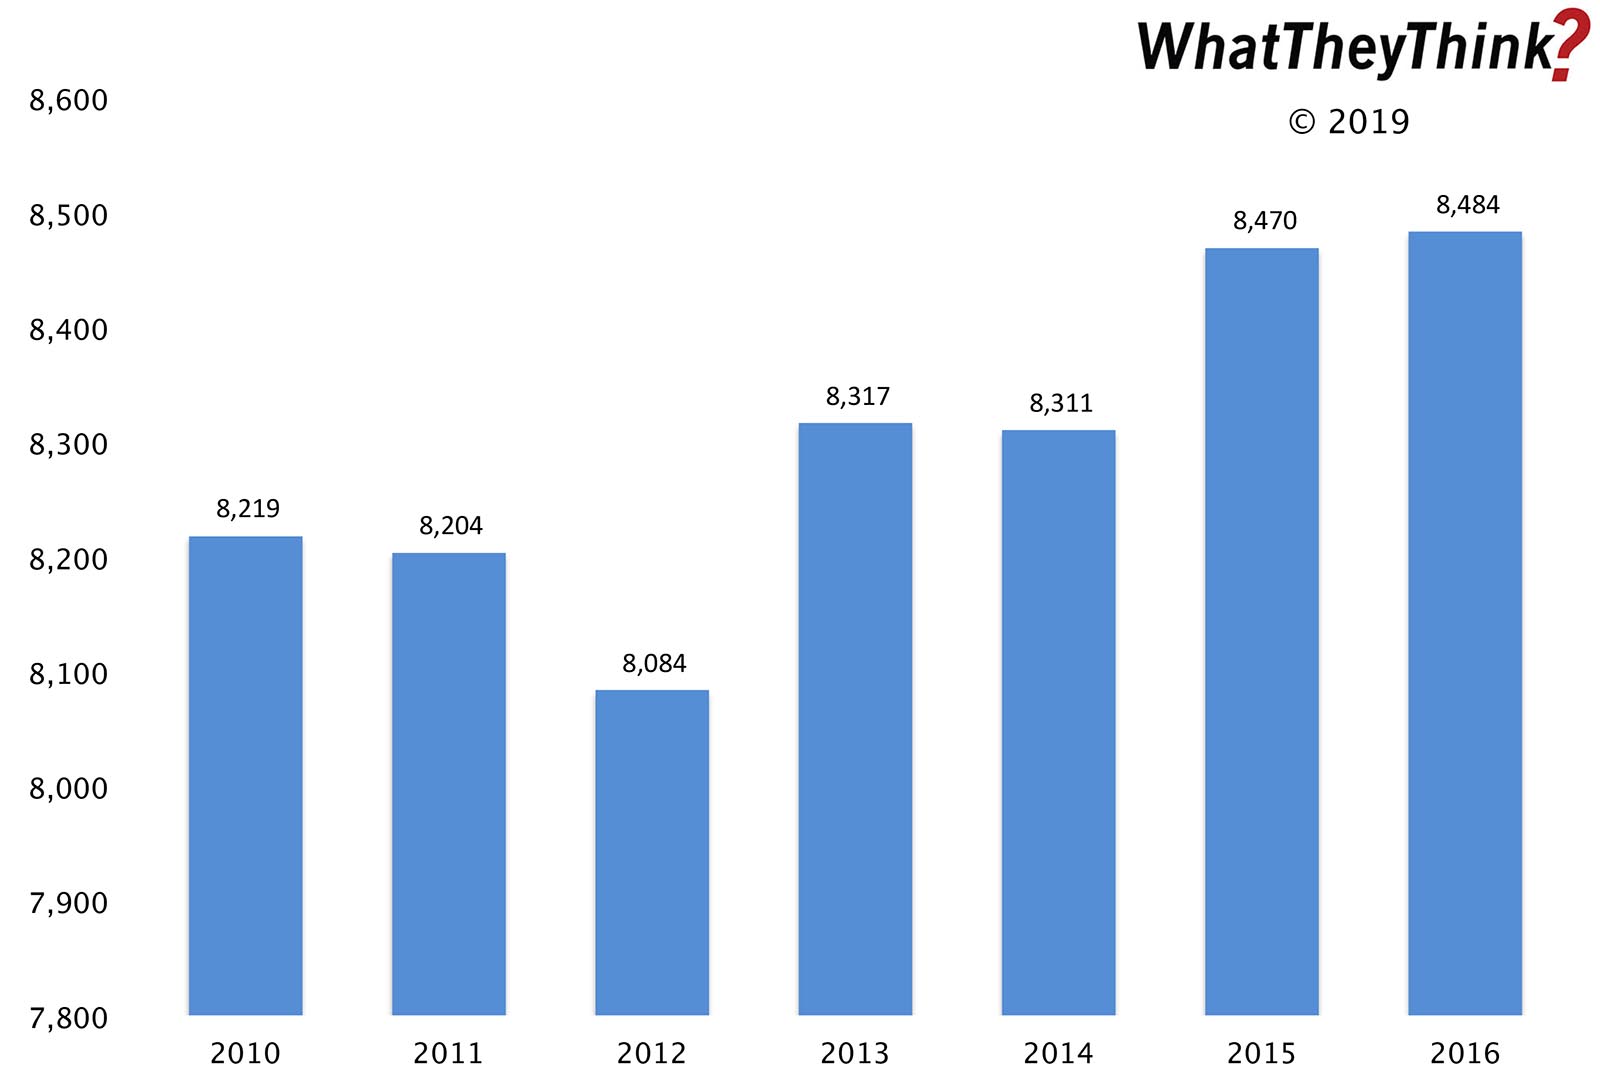
PR Establishments—2010–2016
Published: March 29, 2019
In 2010, there were 8,219 establishments classified as PR Agencies. By 2016, there had been a net gain of +3.2%. Full Analysis
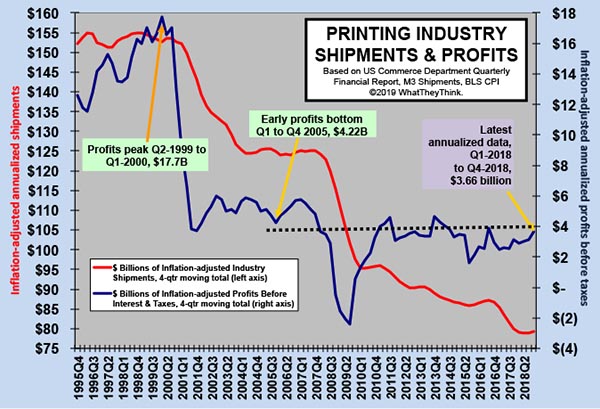
Printing Industry Profits: Urban Sprawl in the Tale of Two Cities
Published: March 22, 2019
Overall, annualized printing industry profits for Q4 2018 were $3.66 billion—not a massive gain from Q3 but a gain nonetheless (we’ll take it). It also appears that the “tale of two cities” trend is—at least temporarily—on hold. Full Analysis
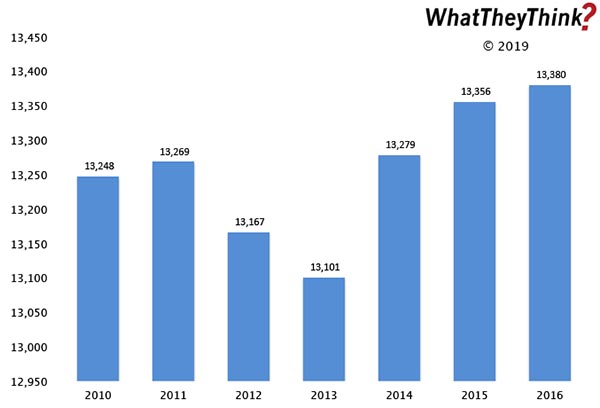
Advertising Agency Establishments—2010–2016
Published: March 15, 2019
In 2010, there were 13,248 establishments classified as Advertising Agencies. By 2016, there had been a net gain of +1.0%, the ups and downs reflecting the changing role of the ad agency. Full Analysis
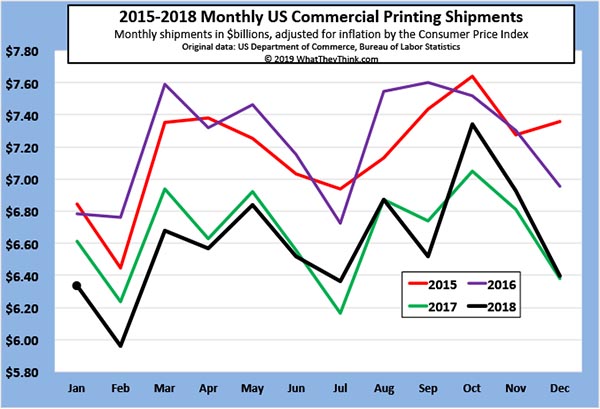
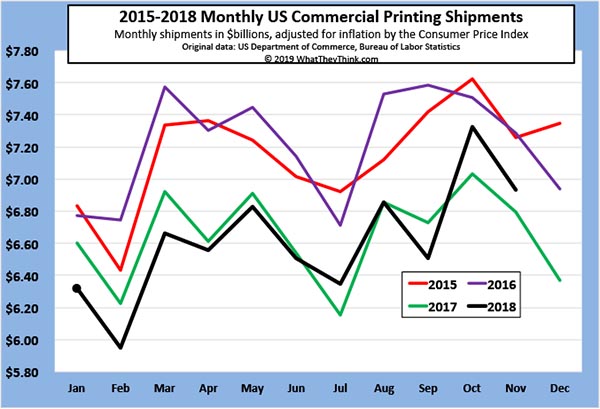
December 2018 Printing Shipments: Ending 2018 on a High(ish) Note
Published: March 8, 2019
Printing shipments for December 2018 came in at $6.40 billion. In keeping with the industry’s new seasonality, that’s down from November, but higher than December 2017—but just barely. Full Analysis
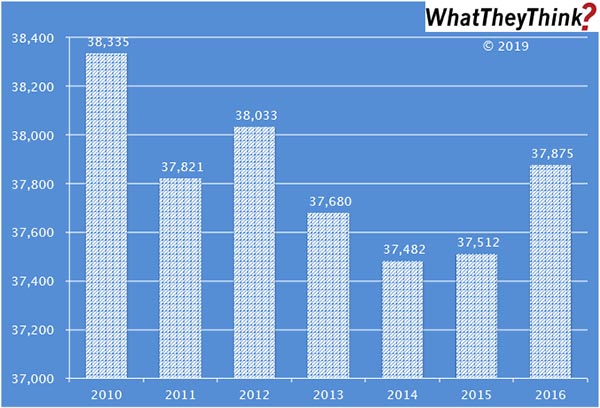
Advertising and Related Establishments—2010–2016
Published: March 1, 2019
In 2010, there were 38,335 establishments classified as Advertising, Public Relations, and Related Services. By 2016, there had been a net loss of -1.2%. This is a very broad industry classification, comprising a disparate bunch of business types, each of which has its own unique dynamics. Full Analysis
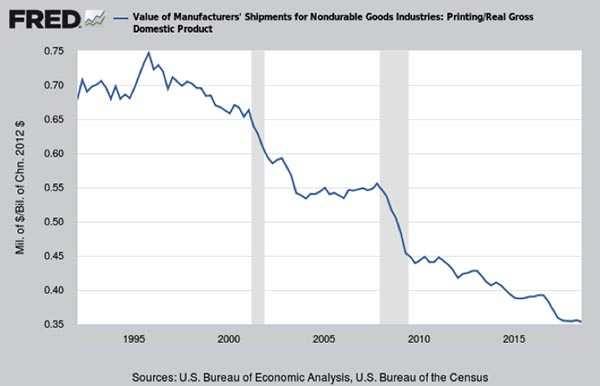
Printing Shipments as a Percentage of GDP
Published: February 22, 2019
Since 1997, the value of printing shipments went from around 0.75% of GDP all the way down to about 0.35%. So we should not be surprised that parts of the printing industry are falling off the government’s radar. Full Analysis
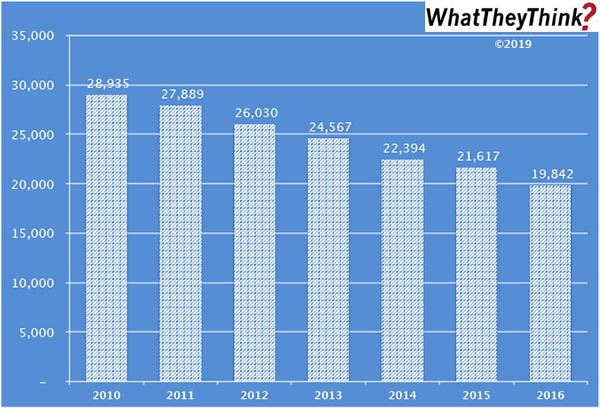
Book Printing Employees—2010–2016
Published: February 15, 2019
In 2010, there were a total of 28,935 employees in U.S. book printing establishments (NAICS 323117). By 2016, book printing employment had dropped to 19,842. Full Analysis
November 2018 Printing Shipments: Meeting Expectations
Published: February 8, 2019
Printing shipments for November 2018 came in at $6.93 billion. In keeping with the industry’s new seasonality, that’s down from October—but it’s still above November 2018’s $6.80 billion. Full Analysis
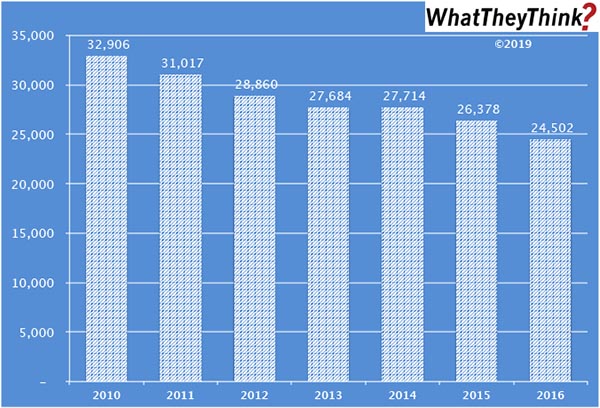
Prepress and Postpress Services Employees—2010–2016
Published: February 1, 2019
In 2010, there were a total of 32,906 employees in U.S. prepress and postpress services establishments (NAICS 32312). By 2016, “support services for printing” employment had dropped to 24,502. Full Analysis
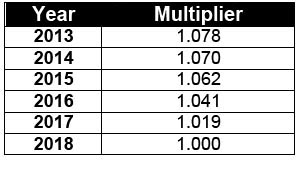
Latest Inflation Adjustment Multipliers
Published: January 25, 2019
Every January, we provide the latest inflation-adjustment multipliers so that print business owners can get a real sense of how they are performing year-over year. Full Analysis
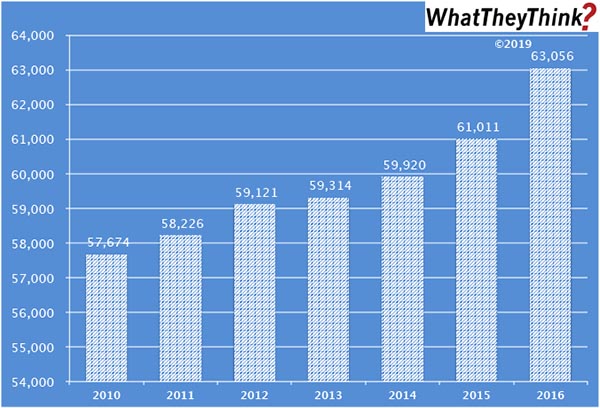
Screen Printing Employees—2010–2016
Published: January 18, 2019
In 2010, there were a total of 57,674 employees in U.S. screen printing establishments (NAICS 323113). By 2016, screen printing employment had grown to 63,056—the opposite of what we have seen in general commercial printing during that same period. Full Analysis
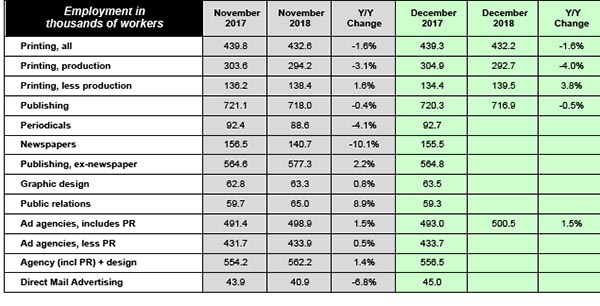
Graphic Arts Employment Held Steady in December
Published: January 11, 2019
Overall printing employment stayed roughly the same from November to December 2018, and, compared to December 2017, declined -1.6%. Non-production printing employment was up a bit in December, production employment down by about the same bit. PR employment continues to be the industry growth spot. Full Analysis
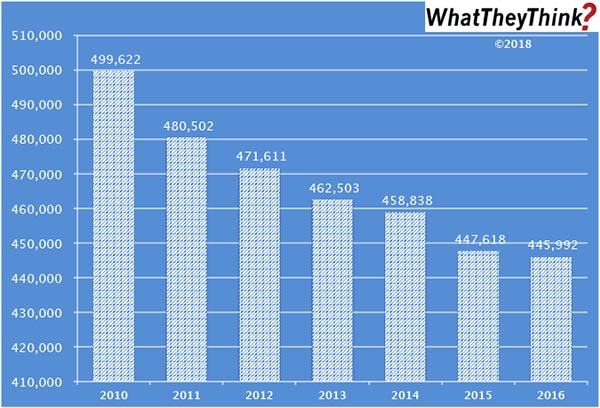
Commercial Printing Employees—2010–2016
Published: December 21, 2018
In 2010, there were a total of 499,622 employees in all commercial printing and related support businesses (NAICS 323). By 2016, overall industry employment had dropped to 445,992. Full Analysis
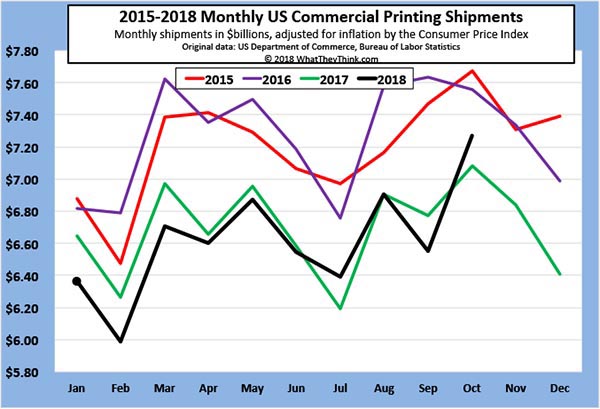
October 2018 Printing Shipments: Suitable for Framing
Published: December 14, 2018
Printing shipments for October 2018 came in at $7.27 billion. That’s up from September—and it’s well above October 2018’s $7.08 billion. Welcome to the new seasonality. Full Analysis
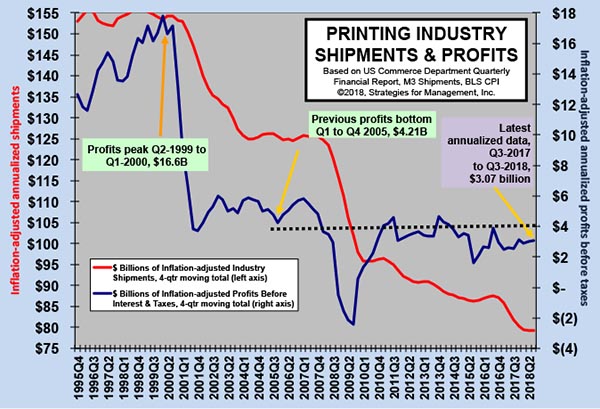
Printing Industry Profits: The Tale of Two Cities Continues
Published: December 7, 2018
Industry profits data came out earlier this week, and it was good and bad news. Overall, annualized profits for Q3 2018 were $3.07 billion—not a huge gain from Q2, but a gain nonetheless. But it’s the ongoing saga of the low profitability of large printers dragging down average industry profitability. Full Analysis
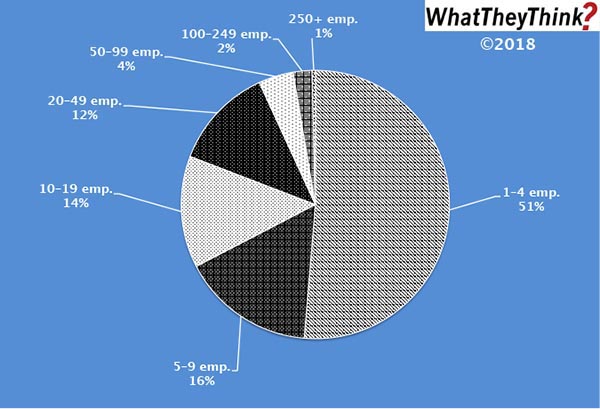
Prepress and Postpress Services Establishments—2016
Published: November 30, 2018
In 2016, there were 1,545 total U.S. establishments offering prepress and/or postpress services (NAICS 32312); 51% of these establishments had fewer than 10 employees. Full Analysis
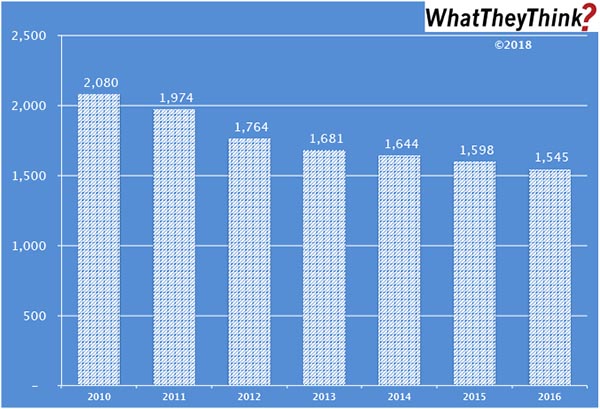
Prepress and Postpress Services Establishments
Published: November 16, 2018
In 2010, there were 2,080 establishments offering prepress and/or postpress services; by 2016, that number had dropped to 1,545. (The Census Bureau stopped breaking out prepress and postpress establishments separately in 2012.) It’s not difficult to understand why the number of these establishments has been dropping; prepress is being absorbed into the printing process itself (especially in digital printing), and more print businesses are acquiring their own finishing capabilities. Full Analysis
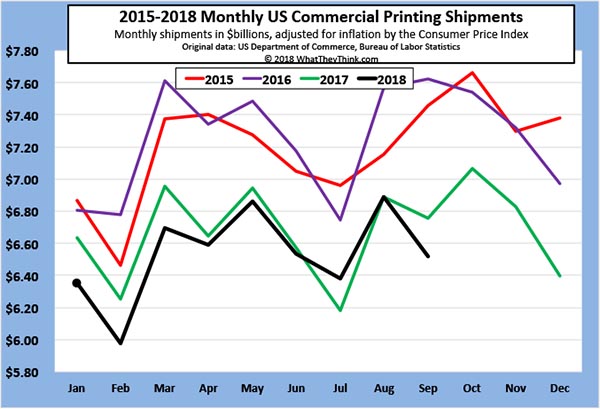
End of the Season? September 2018 Printing Shipments
Published: November 9, 2018
Printing shipments for September 2018 came in at $6.52 billion. That’s down from August—and it’s well below August 2017’s $6.76 billion. Are we seeing a new seasonality in the printing industry—or the end of any seasonality? Full Analysis
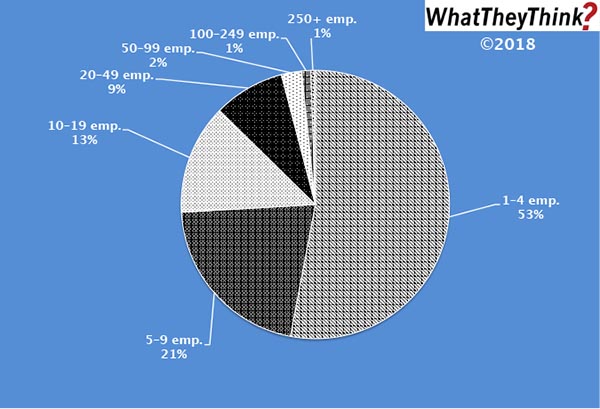
Screen Printers—2016
Published: November 2, 2018
In 2016, there were 5,150 total U.S. commercial screen printing establishments. As with most printing categories, the majority have under 10 employees, but screen shops tend to be smaller than other kinds of printing establishments. Full Analysis
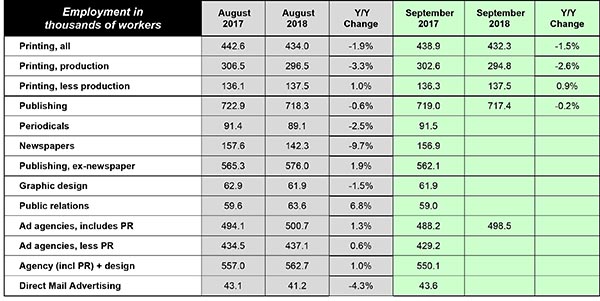
Graphic Arts Employment Continues to Decline; PR Employment Continues to Grow
Published: October 26, 2018
Overall printing employment dropped from August to September 2018, and on a year-over-year basis is down -1.5%. Non-production printing employment was up slightly, indicating that production staff are the hardest employees to find. PR employment is again the industry bright spot, employment-wise. Full Analysis
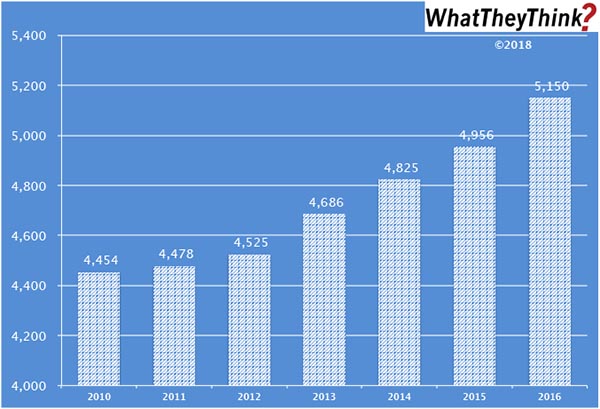
Screen Printers 2010–2016
Published: October 19, 2018
From 2010 to 2016, the number of U.S. commercial screen printing establishments increased from 4,454 to 5,150. Growth in screen printing establishments has been consistent from year to year. Chalk this up to the rise of specialty printing. Full Analysis
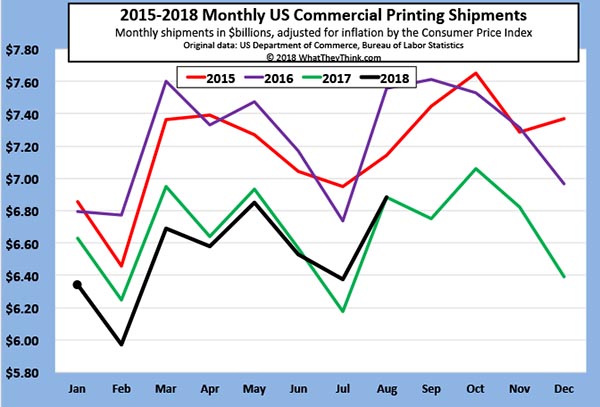
Dead Heat: August 2018 Printing Shipments
Published: October 12, 2018
Printing shipments for August 2018 came in at $6.89 billion. That’s essentially even with August 2017’s $6.88 billion on an inflation-adjusted basis. Full Analysis
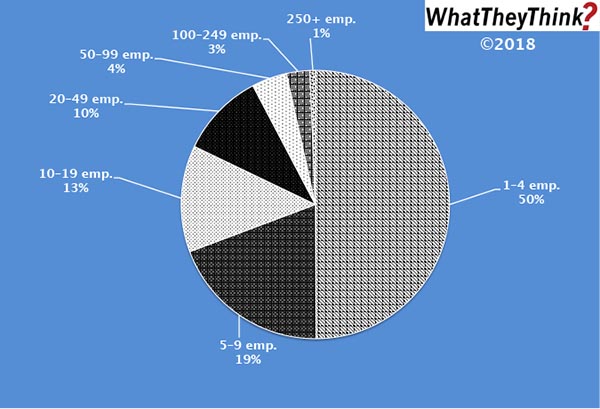
Commercial Printers—2016
Published: October 5, 2018
In 2016, there were 18,405 total commercial printing establishments (excluding screen and book printers). Half of them have fewer than 5 employees. Full Analysis
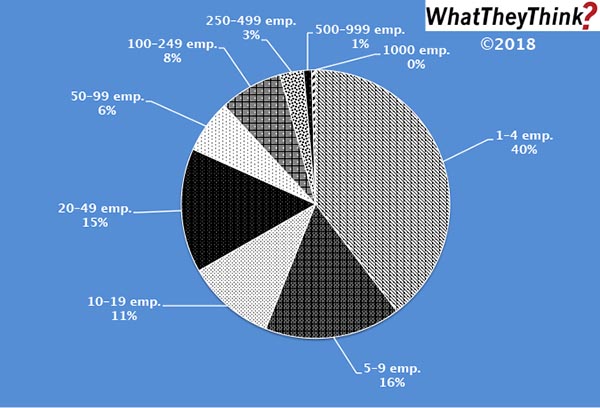
Book Printers—2016
Published: September 28, 2018
In 2016, there were 421 total book printing establishments. The majority have under 10 employees. This is similar to what we find in general commercial printing—yet different. Full Analysis
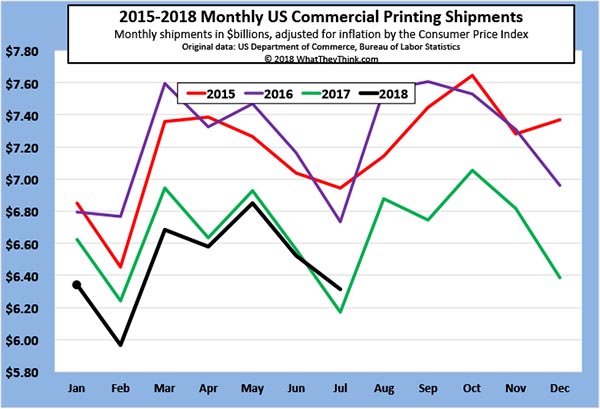
July 2018 Printing Shipments: We Have Some Good News and Some Bad News
Published: September 21, 2018
Printing shipments for July 2018 came in at $6.31 billion—that’s down -3.4% from June, but it’s up +2.3% from July 2017. We’ll take whatever victories we can. Full Analysis
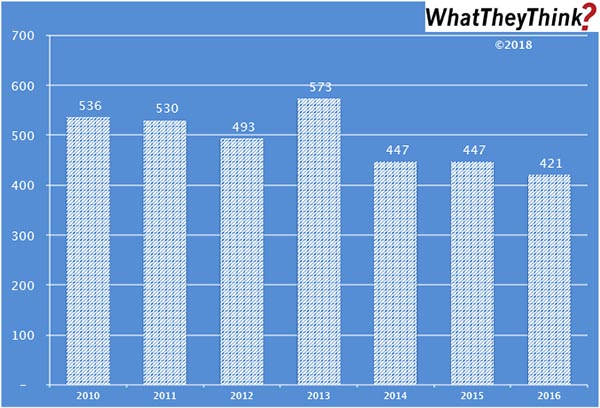
Book Printers—2010–2016
Published: September 14, 2018
In 2010, there were 536 book printing establishments. In the ensuing six years, the establishment count would drop -21%. So says our Commercial Printing Establishments tracker. Full Analysis
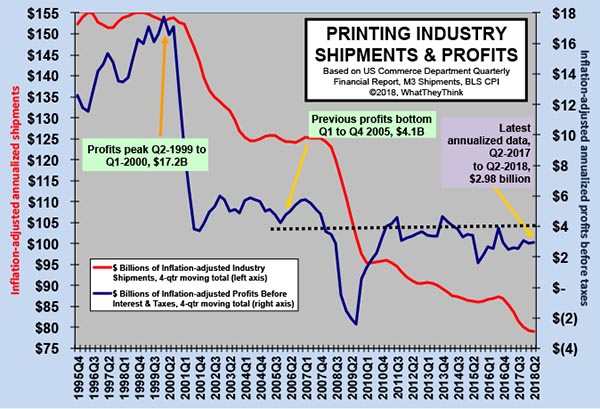
Words of the Profits
Published: September 7, 2018
Looking at the most recent industry profits data that came out earlier this week, we continue to tell the “tale of two cities.” Low profitability of large printers is dragging down average industry profitability. For the industry as a whole, cracking—or re-cracking—$4 billion in profits is proving to be an elusive goal. Full Analysis
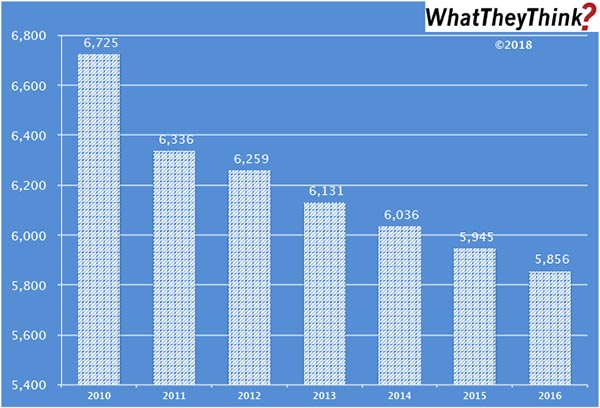
Mid-Size Establishments—2010–2016
Published: August 31, 2018
In 2010, there were 6,725 10–19-employee commercial printing establishments. Among this demographic category, there was the most precipitous drop from 2010 to 2011—the fallout from the Great Recession which started to take its toll after 2009. By 2012, the bleeding had been largely stanched, and the year-to-year declines were more modest. So says our recently launched Commercial Printing Establishments tracker. Full Analysis
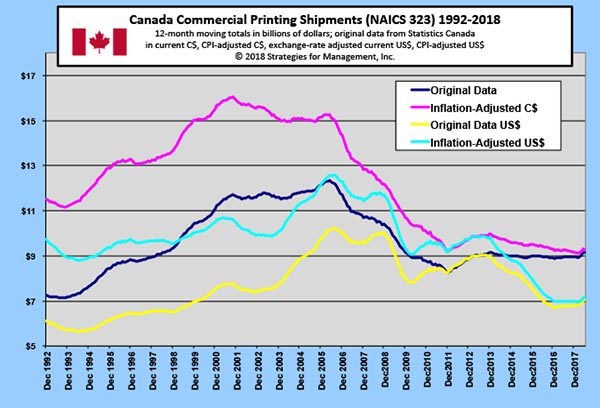
Canadian Printing Shipments
Published: August 24, 2018
Looking at the 12-month moving average of Canada’s printing shipments, it may look like Canada’s printing industry has been holding steady, but the inflation-adjusted figures show a slight decline from a recent peak at the end of 2013. Full Analysis
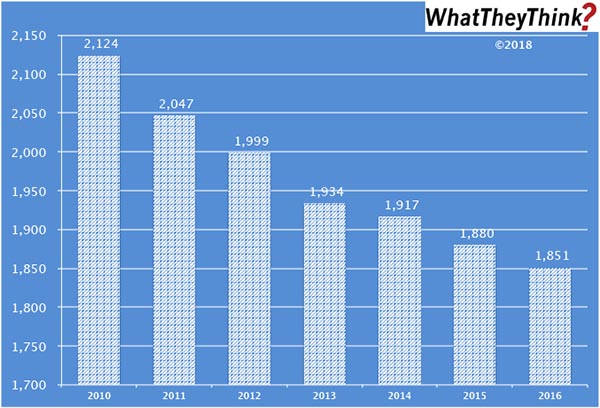
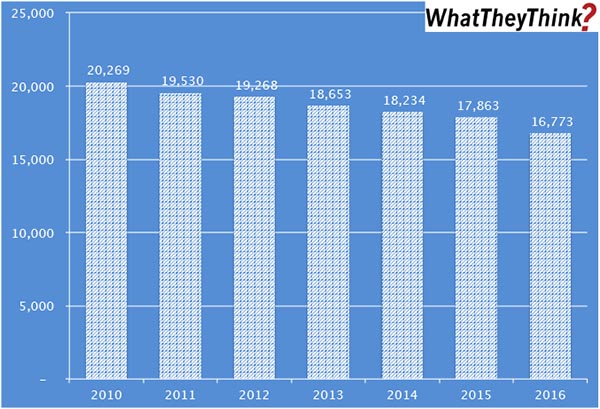
Consolidation Among Large Print Businesses: 2010–2016
Published: August 17, 2018
In 2010, there were 2,124 establishments having 50 or more employees. By 2016, they had dropped to 1,851 (down -13%). So says our new Commercial Printing Establishments tracker, based on data from the Census Bureau’s County Business Patterns, which presents—in spreadsheet form—U.S. commercial printing establishments from 2010 to 2016, broken down by six different print business classifications and nine employee-size breakdowns. Full Analysis
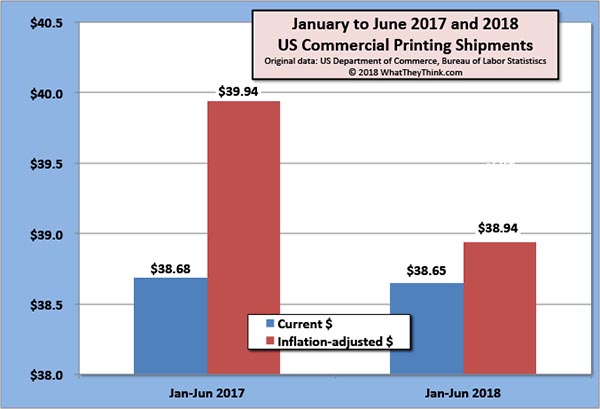
Printing Shipments Head Into the Dog Days of Summer
Published: August 10, 2018
The inflation-adjusted value of printing shipments for June 2018 were down from $6.9 billion in May to $6.5 billion in June. On the plus side, it’s not appreciably below the $6.6 billion reported in June 2017. Full Analysis
WhatTheyThink Launches New Industry Establishment Data Series
Published: August 3, 2018
Our new Commercial Printing Establishments tracker, based on data from the Census Bureau’s County Business Patterns, presents—in spreadsheet form—U.S. commercial printing establishments from 2010 to 2016, broken down by six different print business classifications and nine employee-size breakdowns. Full Analysis

June Printing Employment Down Y/Y
Published: July 27, 2018
Overall, printing employment ticked up from May to June 2018, but on a year-over-year basis is down -1.8% from June 2017. Among the creative markets, PR is the place to be. Full Analysis
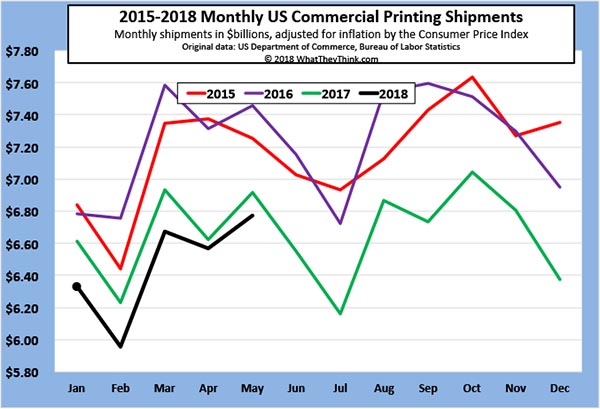
May Printing Shipments Up from April, Closing in on 2017 Levels
Published: July 13, 2018
Printing shipments for May 2018 came in at $6.77 billion, up +3.1% from April. However, on an inflation-adjusted basis, May 2018 came in below the $6.92 billion reported in May 2017, and is well below the recent high of $7.46 billion back in May 2016. Full Analysis
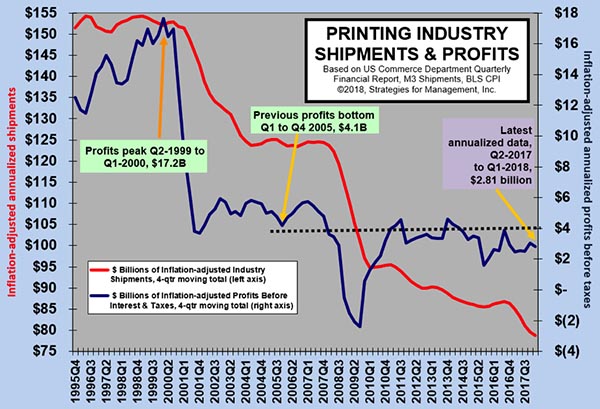
Big Printers' Writedowns and Interest Payments Are a Big Drag on Printing Industry Profits
Published: June 22, 2018
Writedowns in the first quarter of 2018 for commercial printers with $25 million or more in assets were $157 million, or 1.9% of sales. The assets may be written down, but the borrowing that was created to finance them remains. Interest expense was 4.8% of sales. For the quarter, losses were -1.47% of sales. That rate of loss made average profits before taxes for the industry a mediocre 3% of sales—which means that printers with less than $25 million in assets must have done well. Full Analysis
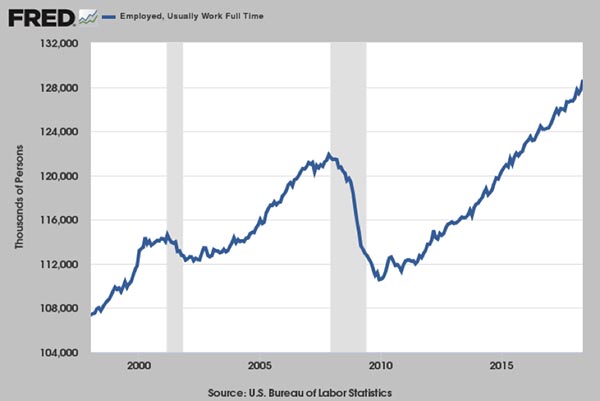
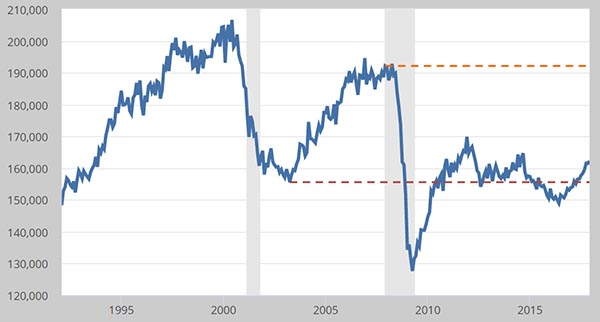
Full-Time Employment, Sets New Record, Up +904,000, But Does It Really Feel that Good?
Published: June 8, 2018
The May employment report was regarded as good, but when you dig past the top-level numbers, it was better than it looked. However, while the 3.8% unemployment rate looks good on the surface, it really can’t be compared to when it was last attained nearly 20 years ago. So many workers left the workforce that this figure implies a tighter labor than it really is. We will really know we have a strong economy when the active labor force starts increasing. Full Analysis
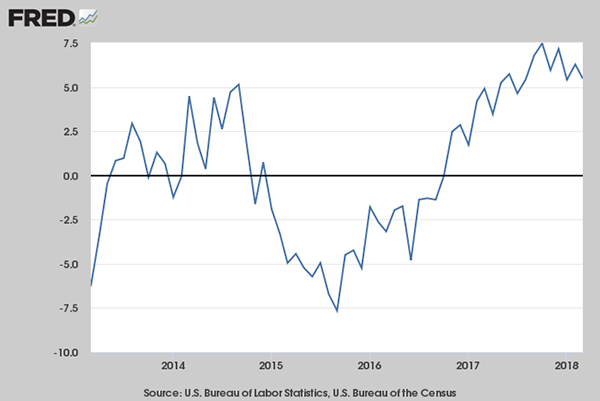
Consumer Durable Goods Orders Moving at Almost 2X GDP Rate
Published: May 18, 2018
Durable goods orders for consumers (less transportation) are growing at a rate almost two times faster than Real GDP. This data series remains -14% below where it was at the start of the recession in December 2017, and is a critical one to monitor for indications of an improved economy. Full Analysis
Q1-2018 Rises +2.3%, Slower Rate than Q4-2017
Published: May 11, 2018
The Bureau of Economic Analysis’ advance report estimated that Q1-2018 real gross domestic product was up at an annual rate of +2.3%, which was slower than the +2.9% for Q4-2017. Because companies and individuals, especially corporations, shifted expenses into 2017 and delayed revenue recognition to 2018 to take advantage of the rates in the new tax law, many key economic data series—such as this one—will be subject to larger than usual revision. Full Analysis
Federal Reserve Updates Industrial Production Data Series
Published: April 13, 2018
The Federal Reserve revised 2015–2017 industrial production down from its original reports, meaning that industrial production peaked in 2014 and then slowed. The initial data made things seem better than what consumers and employees were actually experiencing. Full Analysis
Q4-2017 GDP Revisions Stronger than Earlier Reports
Published: April 6, 2018
Q4-2017 GDP estimates were raised to +2.9% from the original estimate of +2.5%. (But beware inventories.) At the same time, shenanigans resulting from the latest tax bill are blurring statistics visibility, especially where corporate profits are concerned. Full Analysis
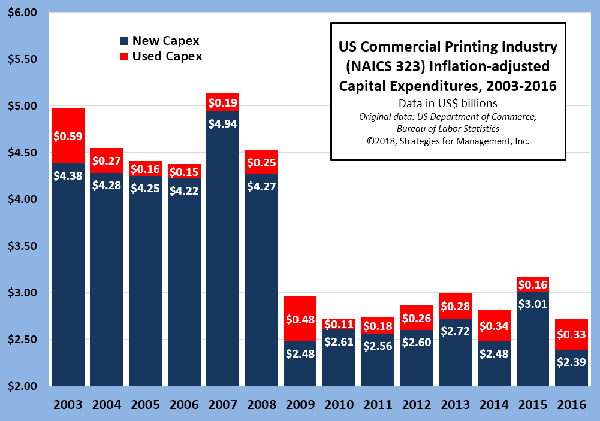
US Commercial Printing Capital Expenditures
Published: March 9, 2018
The capital expenditures of commercial printers fell in 2016, but the investment in less expensive used equipment may have been a major factor. Full Analysis
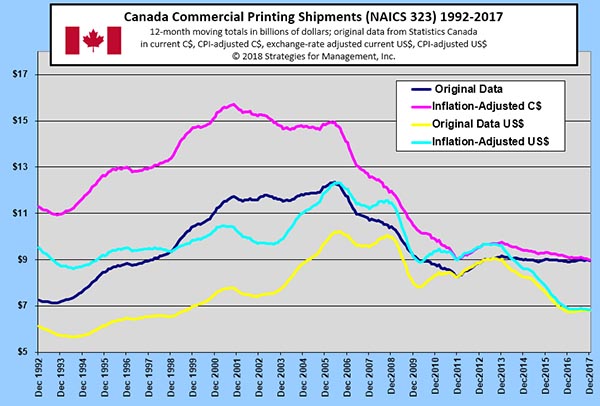
Canada’s Commercial Printing Shipments 1992-2017
Published: March 2, 2018
Canada’s printing industry has been holding steady compared to the US, despite being subject to the same competition from digital media Full Analysis
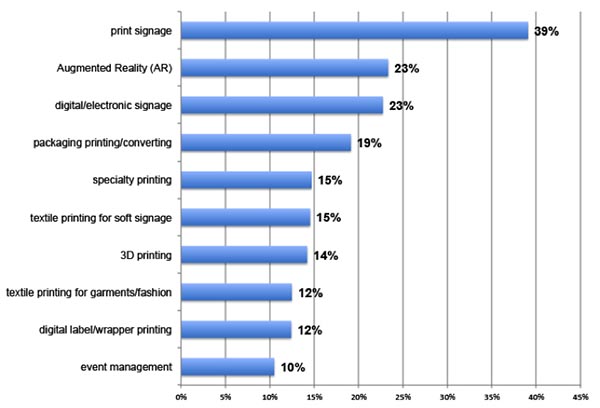
Print Business Outlook Survey: Areas of interest in new print-related applications
Published: February 28, 2018
WhatTheyThink surveyed printing business owners and executives: "What are your areas of interest in new print-related applications." Full Analysis
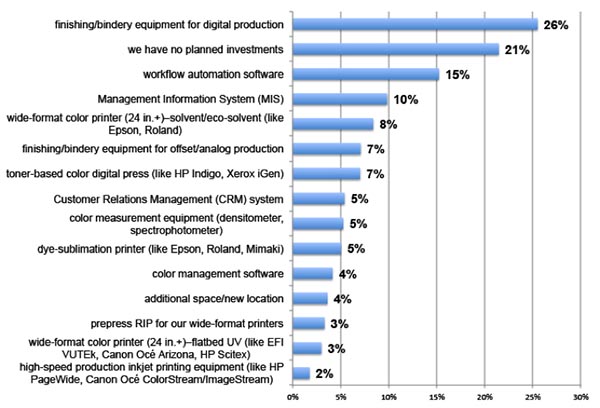
Print Business Outlook Survey: Which of the following investment items have you budgeted for and plan to acquire in the next 12 months?
Published: February 20, 2018
WhatTheyThink surveyed printing business owners and executives: "Which of the following investment items have you budgeted for and plan to acquire in the next 12 months?" Full Analysis
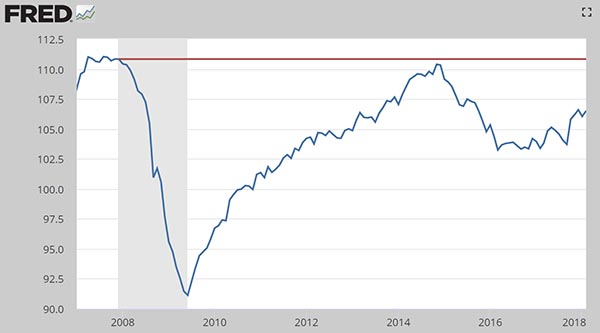
Consumer Durable Goods Still Struggle to Reach Recession Levels
Published: February 16, 2018
CPI-adjusted consumer durable goods manufacturing remains well below its pre-recession level—one of the reasons that GDP has been so lackluster. Full Analysis
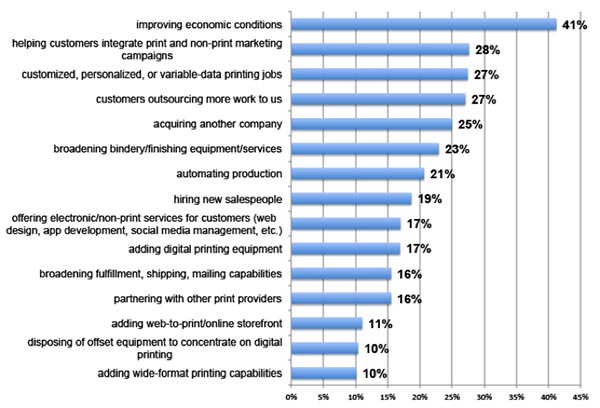
Print Business Outlook Survey: In the next 12 months, which of the following will be your biggest business opportunities?
Published: February 15, 2018
WhatTheyThink surveyed printing business owners and executives: "In the next 12 months, which of the following will be your biggest business opportunities?" Full Analysis
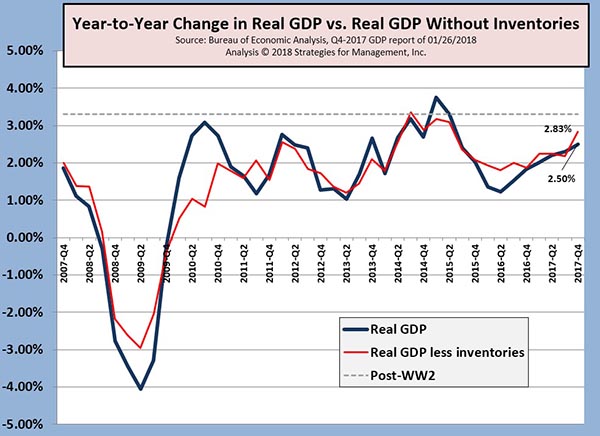
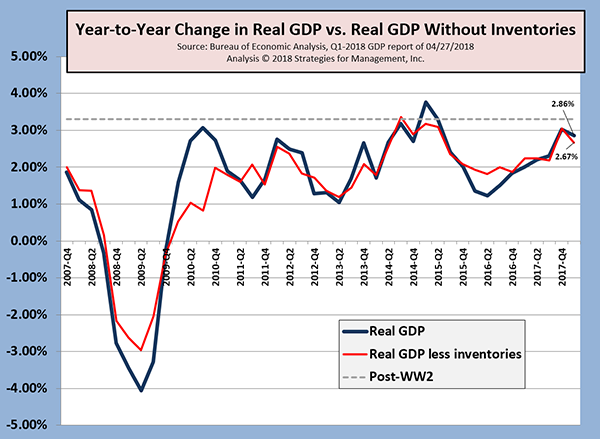
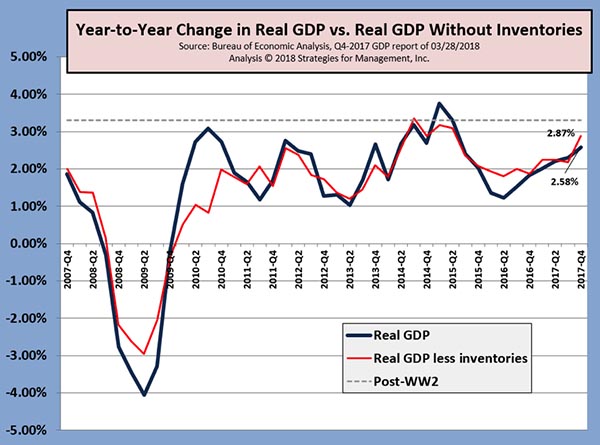
Q4-2018 GDP +2.6%, But +3.2% Excluding Inventory Effects
Published: February 9, 2018
The first report of fourth quarter GDP was a disappointing +2.6%. Sources such as the Atlanta Federal Reserve’s GDPNow and the New York Fed’s Nowcast were for a stronger reading. Inventories are a major factor in the volatility of GDP data, and excluding that data, the economy neared those estimates, producing a much better +3.2% rate compared to Q3. Full Analysis
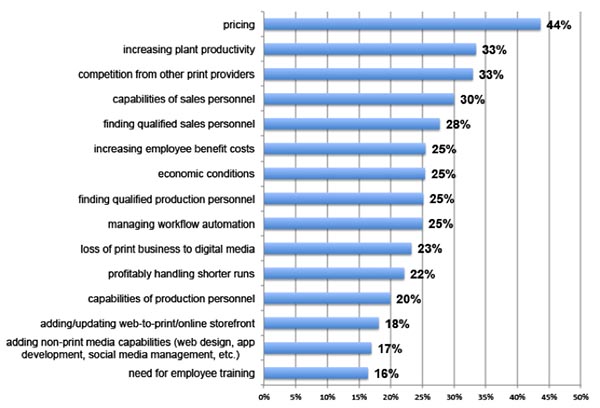
Print Business Outlook Survey: In the next 12 months, which of the following will be your biggest business challenges?
Published: February 5, 2018
WhatTheyThink surveyed printing business owners and executives: "In the next 12 months, which of the following will be your biggest business challenges?" Full Analysis
This is the Last Page


![]()

WhatTheyThink is the official show daily media partner of drupa 2024. More info about drupa programs
© 2024 WhatTheyThink. All Rights Reserved.