Data Analysis
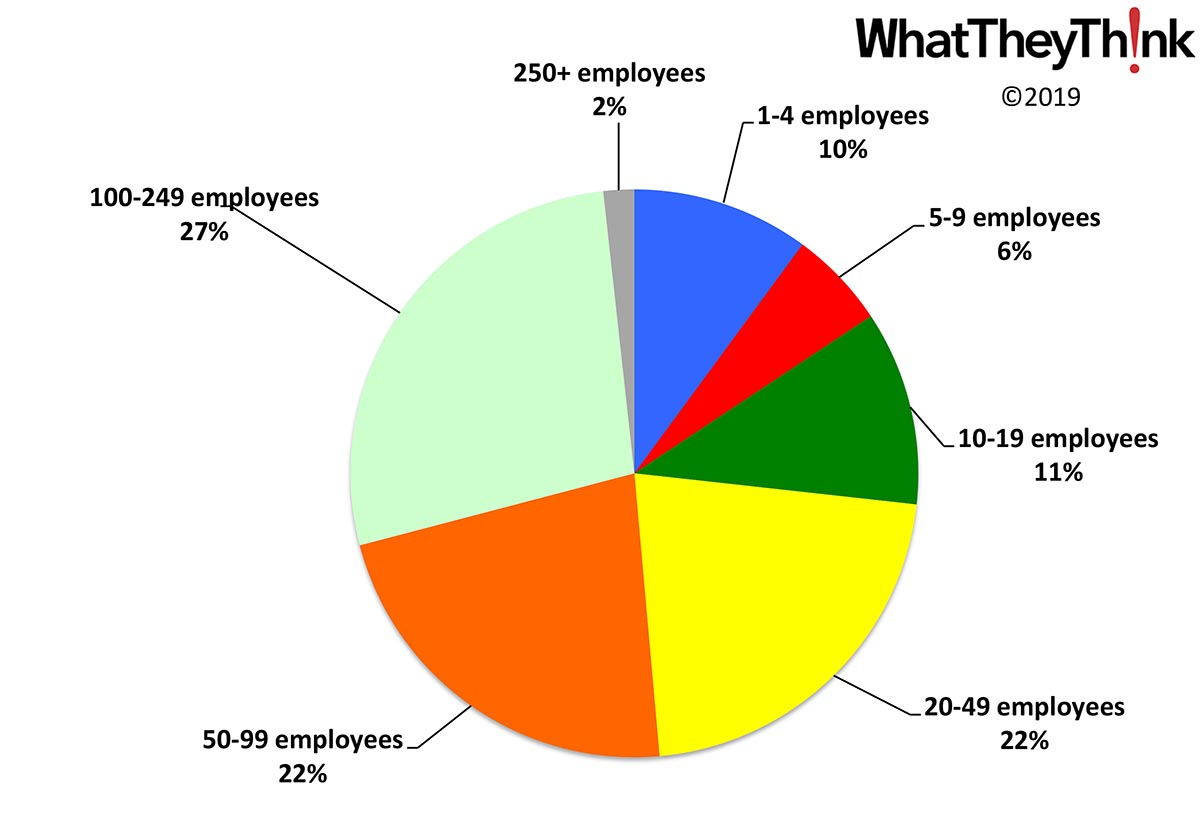
Corrugated and Solid Fiber Box Manufacturing Establishments—2016
Published: August 9, 2019
in 2016, there were 1,200 establishments in NAICS 322211 (Corrugated and Solid Fiber Box Manufacturing). About half of these establishments (49%) have 50 or more employees and more than two-thirds (71%) have 20 or more employees. Full Analysis
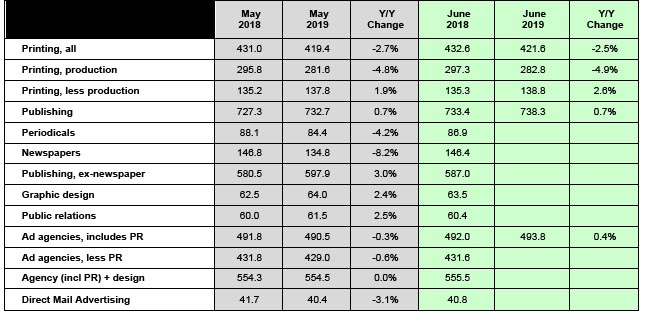
June Jobs: Up in the Short Term, Down in the Long Term
Published: August 2, 2019
In June, overall printing employment grew +0.5% from May to June 2019. On a year-over-year basis, it is down -2.5%. Production employment was up +0.4% from May to June, but year-over-year was down -4.9%. Non-production employment was up +0.7% from May to June, and year-over-year was up +2.6%. Full Analysis
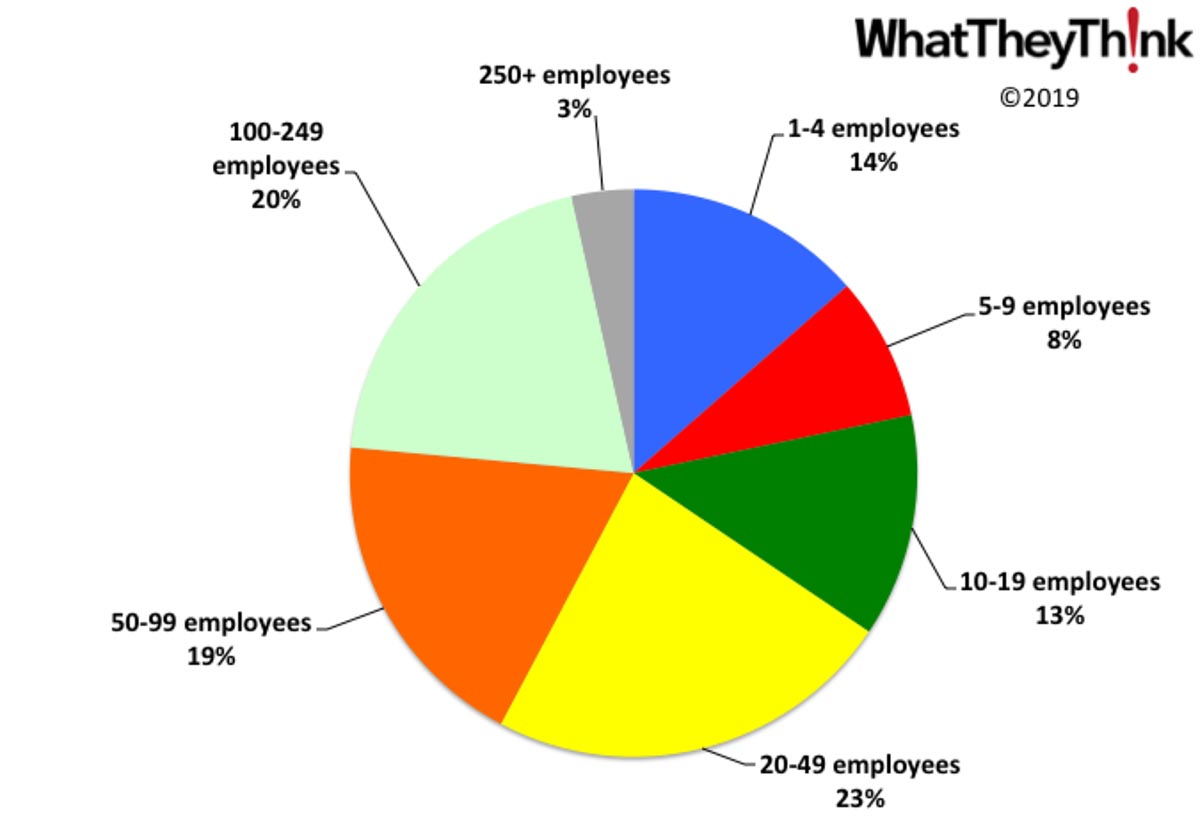
Converted Paper Product Manufacturing Establishments—2016
Published: July 26, 2019
in 2016, there were 3,638 establishments in NAICS 3222 (Converted Paper Product Manufacturing). More than four out of 10 of these establishments (42%) have 50 or more employees and two-thirds (65%) have 20 or more employees. Full Analysis
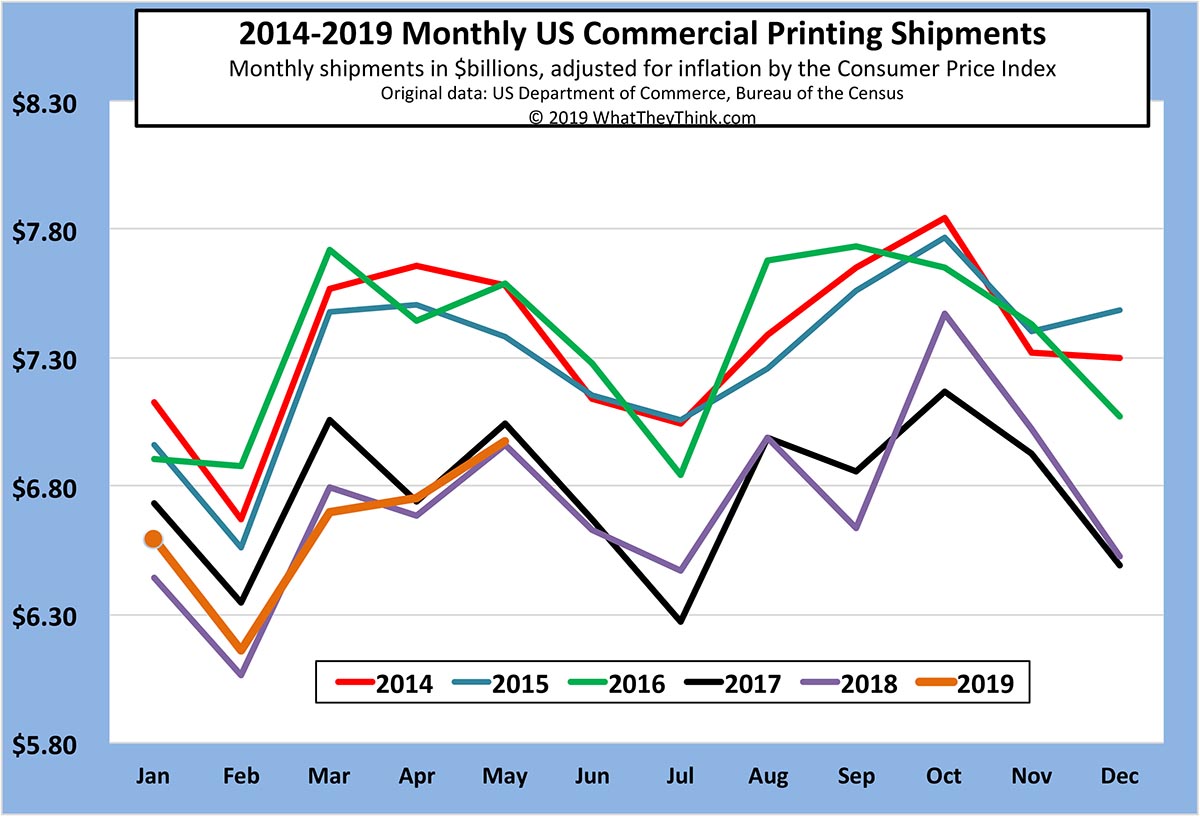
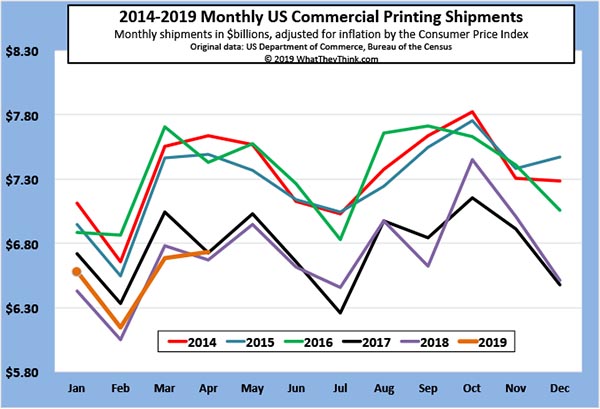
May Printing Shipments Up from April
Published: July 19, 2019
Printing shipments for May 2019 were up from April—and even came in above May 2018 shipments, albeit only very slightly. Full Analysis
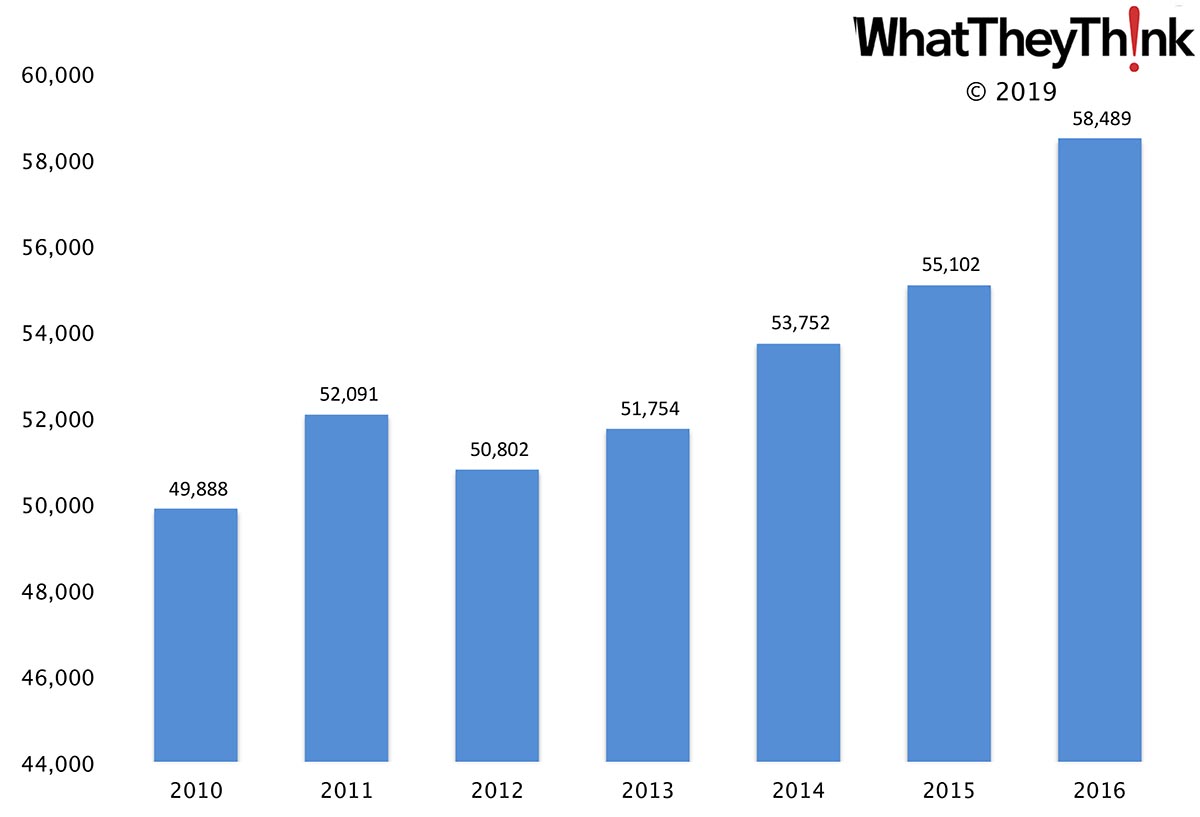
PR Agency Employees—2010–2016
Published: July 12, 2019
In 2016, there were 58,489 employees in establishments in NAICS 54182 (Public Relations Agencies). Employment in this category has grown +17% from 2010 to 2016. Full Analysis
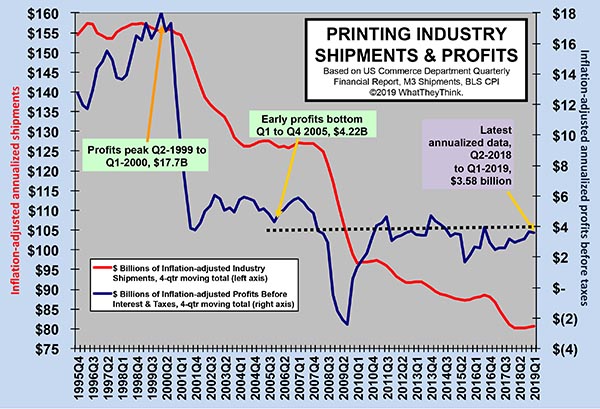
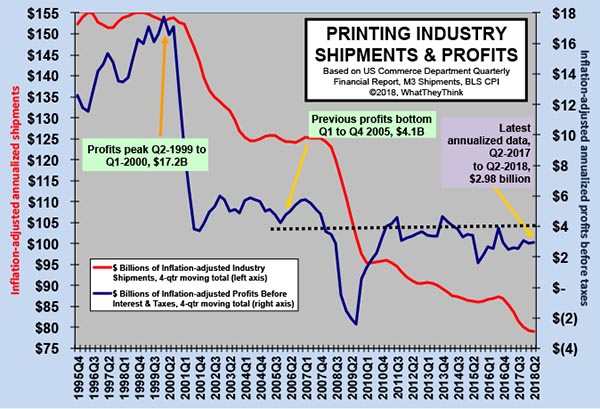
Printing Industry Profits: What Goes Up...
Published: June 28, 2019
Industry profits data came out earlier this month, and overall profits slipped a little. Annualized profits for Q1 2019 were $3.58 billion, down slightly from $3.66 billion in Q4 of last year. Again, it’s the large printers that are dragging down overall industry profitability. Full Analysis
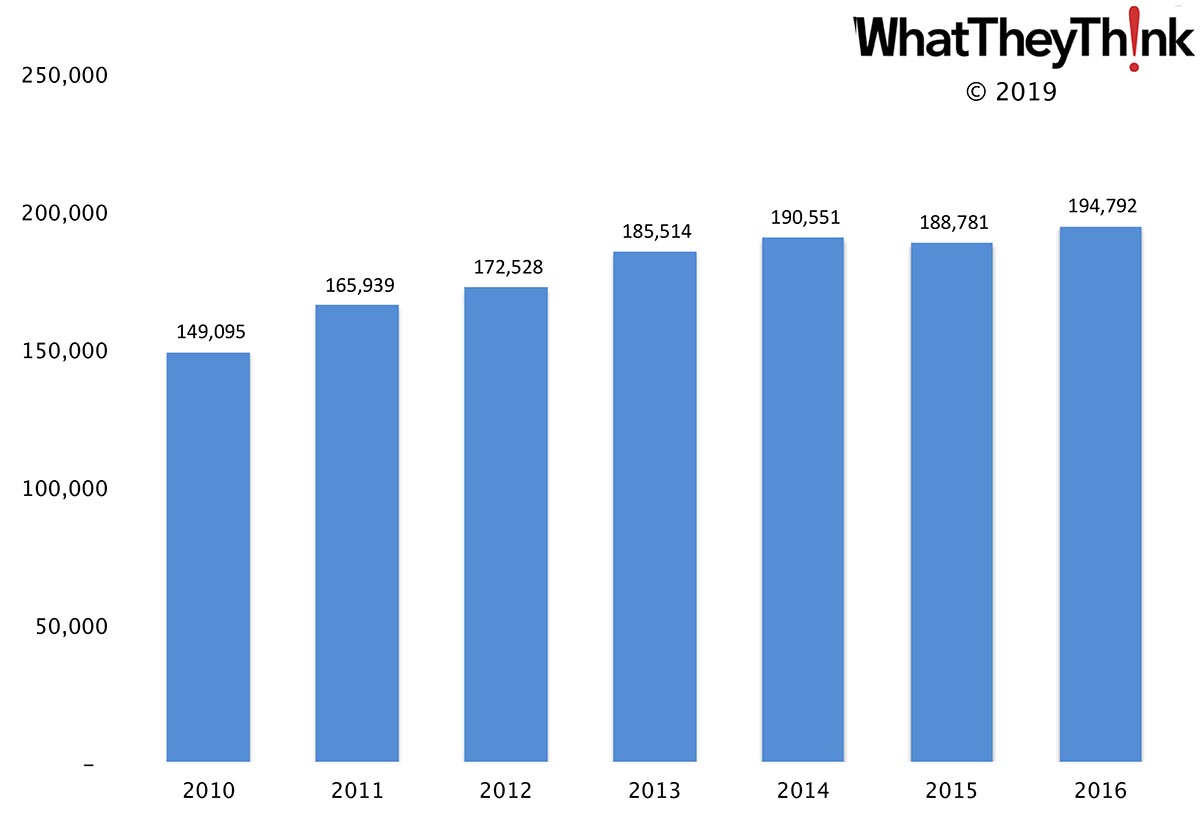
Advertising Agency Employees—2010–2016
Published: June 21, 2019
In 2016, there were 194,792 employees in establishments in NAICS 54181 (Advertising Agencies). Employment in this category has grown +31% from 2010 to 2016. Full Analysis
April Printing Shipments—A New Season?
Published: June 14, 2019
Printing shipments for April were up from March, happily disrupting what has become the usual seasonal pattern. Even better, April 2019 shipments came in above April 2018 shipments. Full Analysis
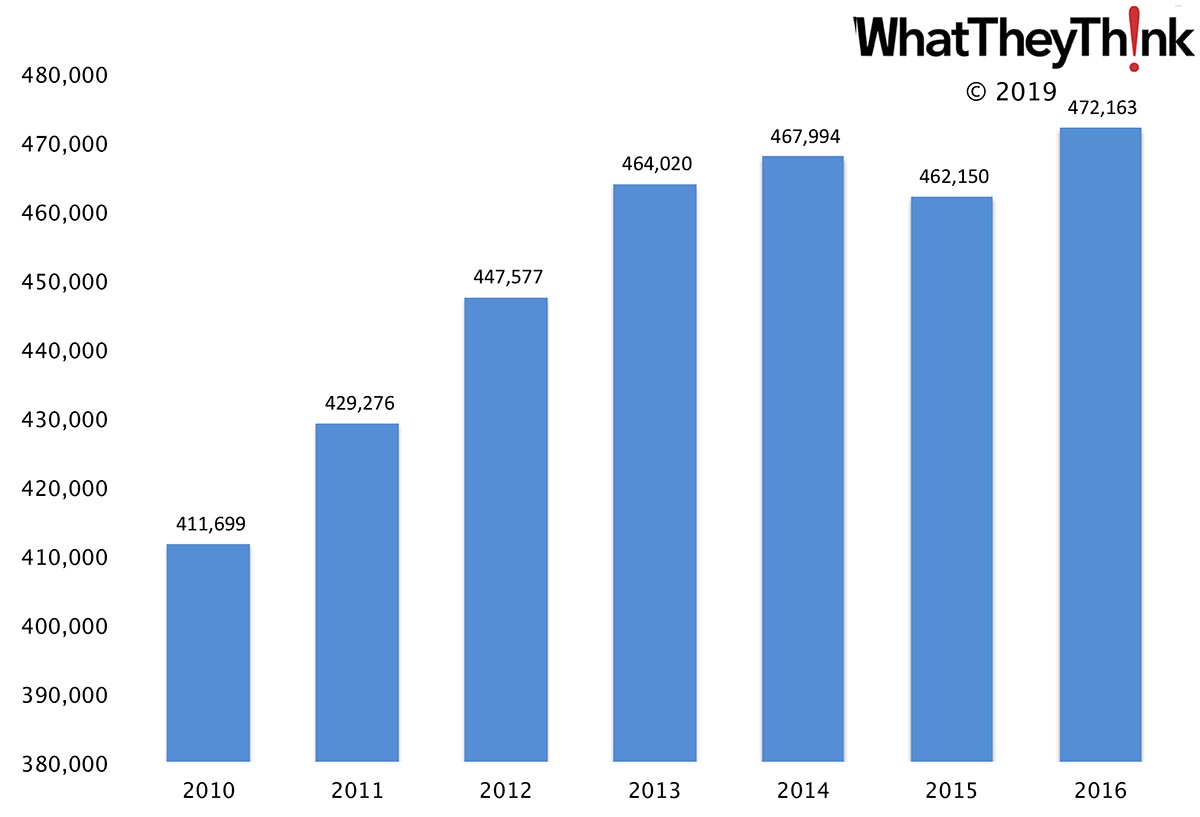
Advertising, Public Relations, and Related Services Employees—2010–2016
Published: June 7, 2019
In 2016, there were 472,163 employees in establishments in NAICS 5418 (Advertising, Public Relations, and Related Services). Employment in this category has grown +15% from 2010 to 2016. Full Analysis
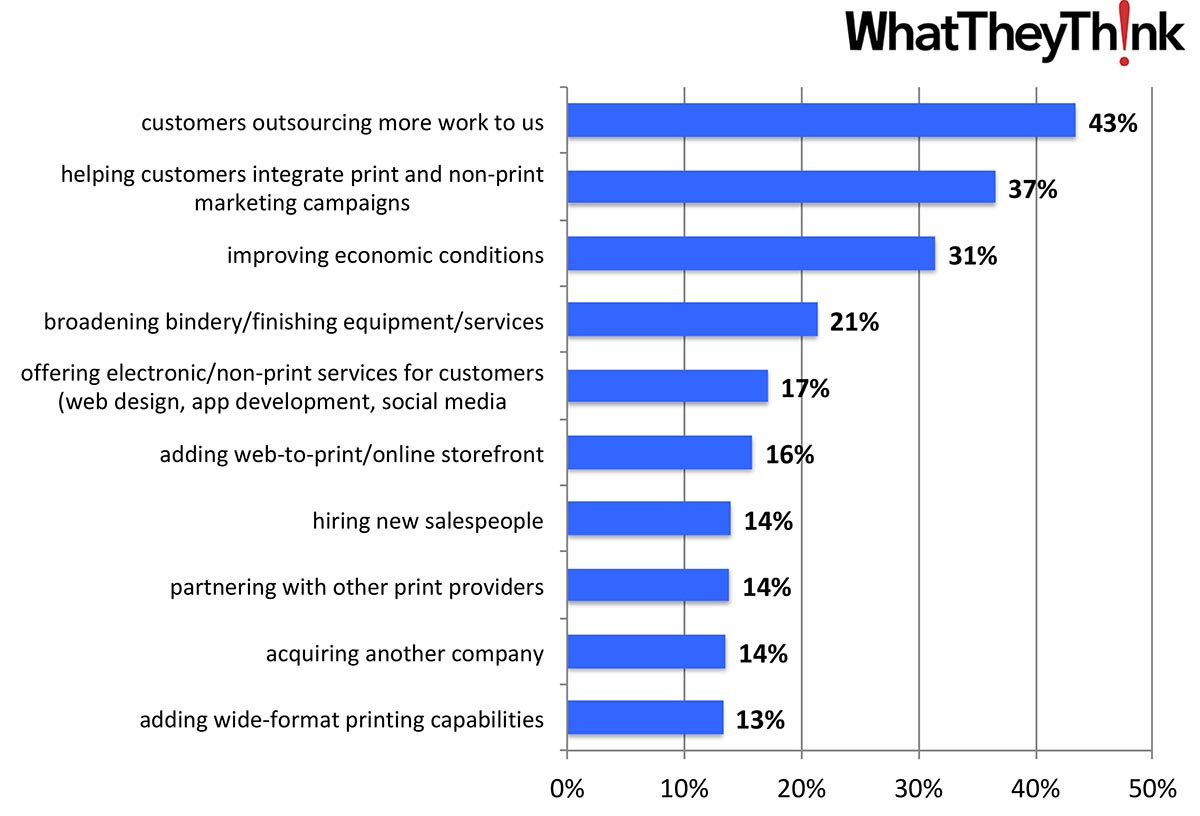
The Changing Face of Print Business Opportunities
Published: May 31, 2019
In our annual Print Business Outlook Survey, we found that the top opportunities for print businesses included some newer, proactive items, with some of the old chestnuts falling off the tree. As we saw with recent Business Challenges, could this reflect a “changing of the guard” of print business management? Full Analysis
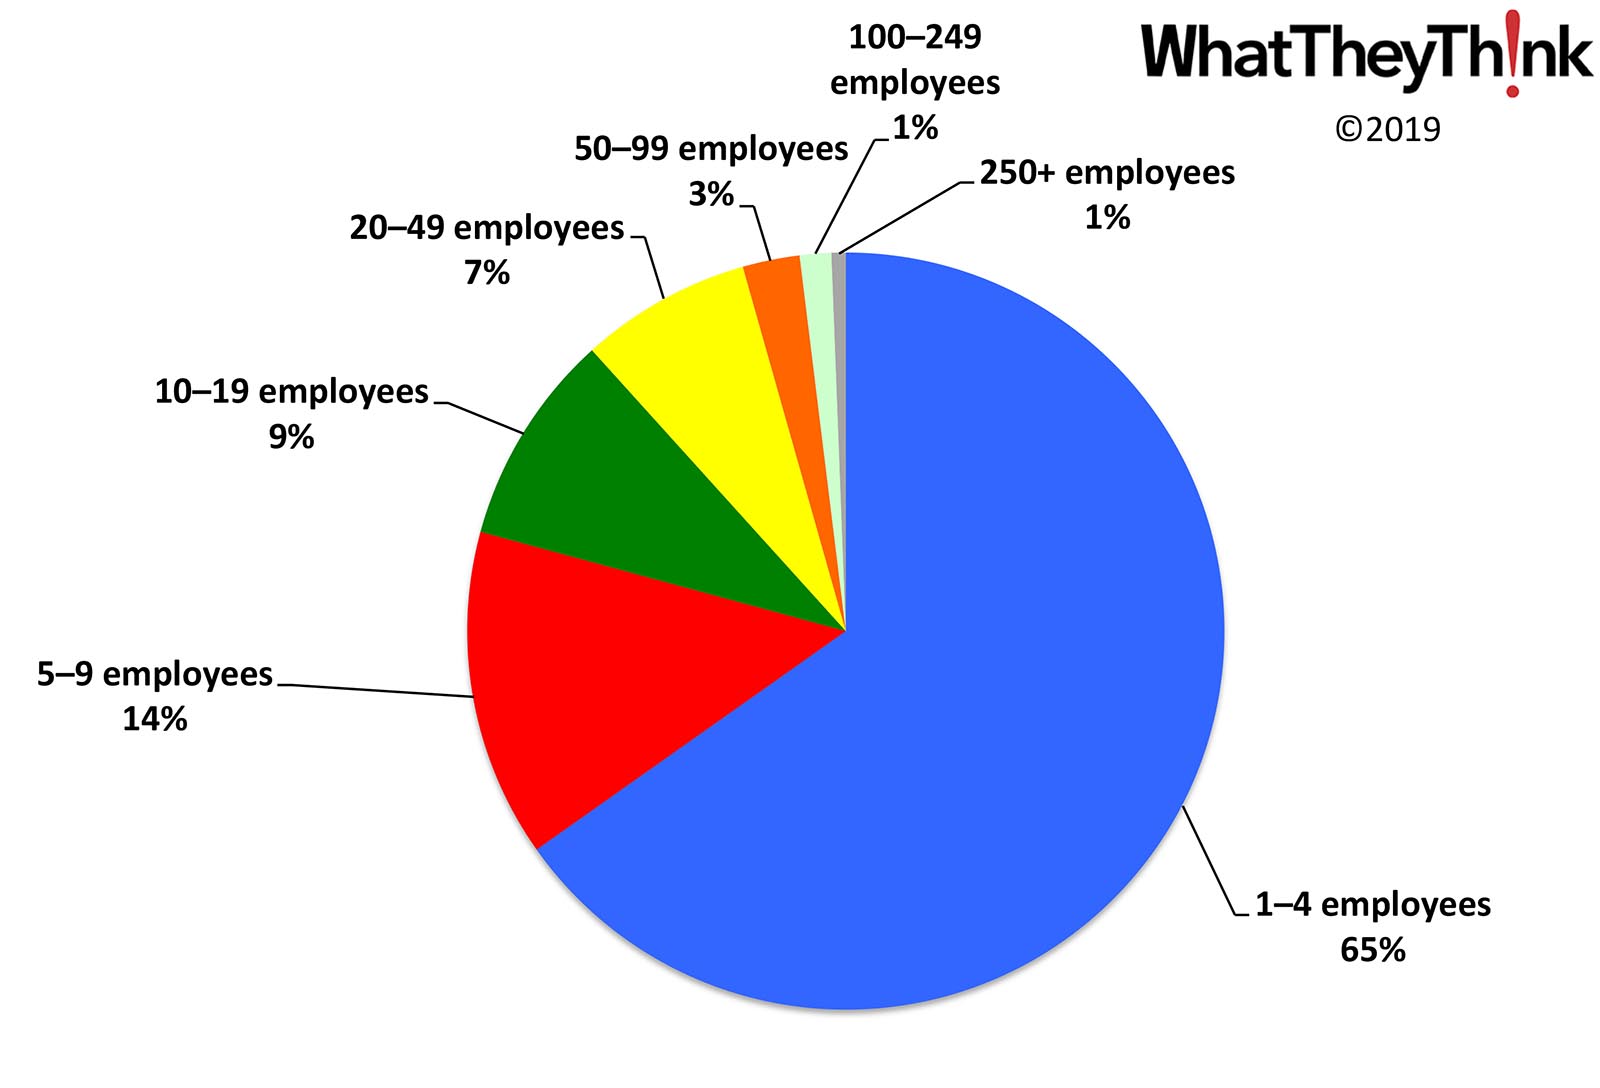
Advertising, Public Relations, and Related Services Establishments—2016
Published: May 24, 2019
in 2016, there were 37,875 establishments in NAICS 5418 (Advertising, Public Relations, and Related Services). Two-thirds of these establishments (65%) have under four employees, 79% have under 10 employees, and 88% have under 20 employees. The largest agencies (100 or more employees) only account for 2% of all establishments. Full Analysis
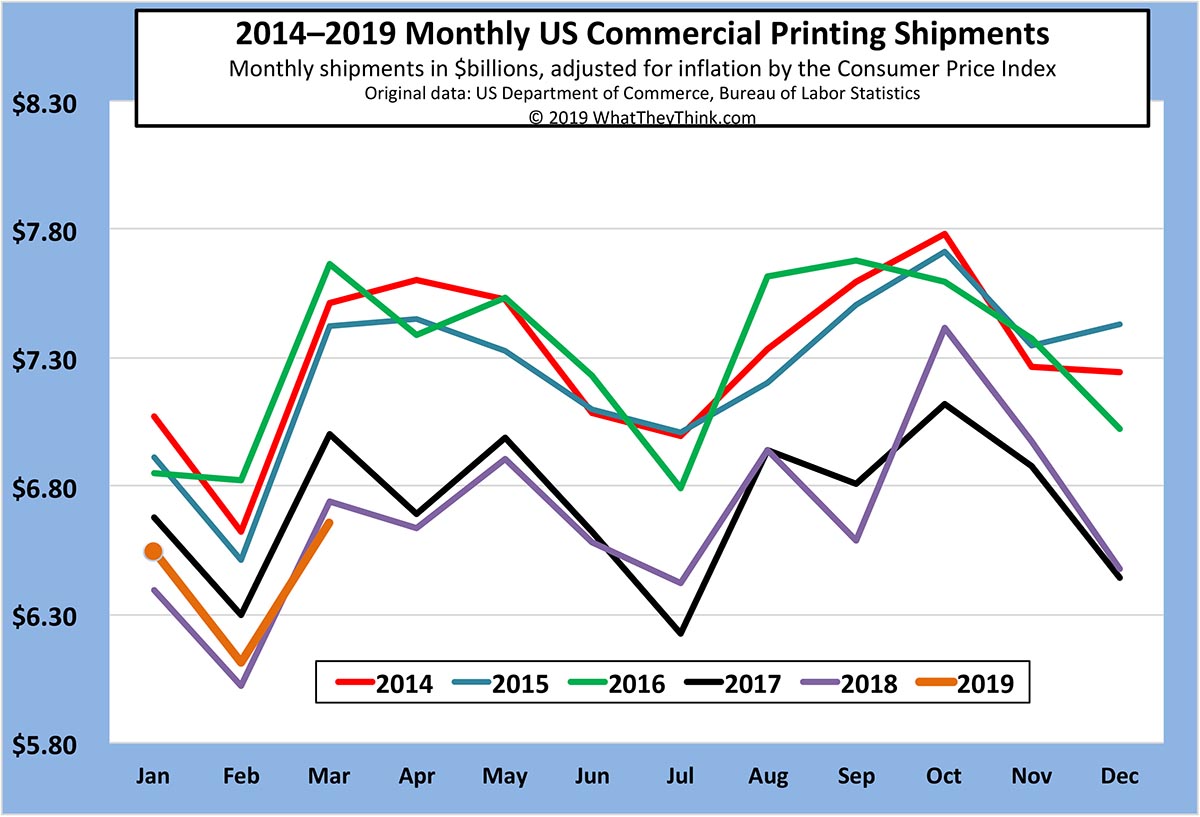
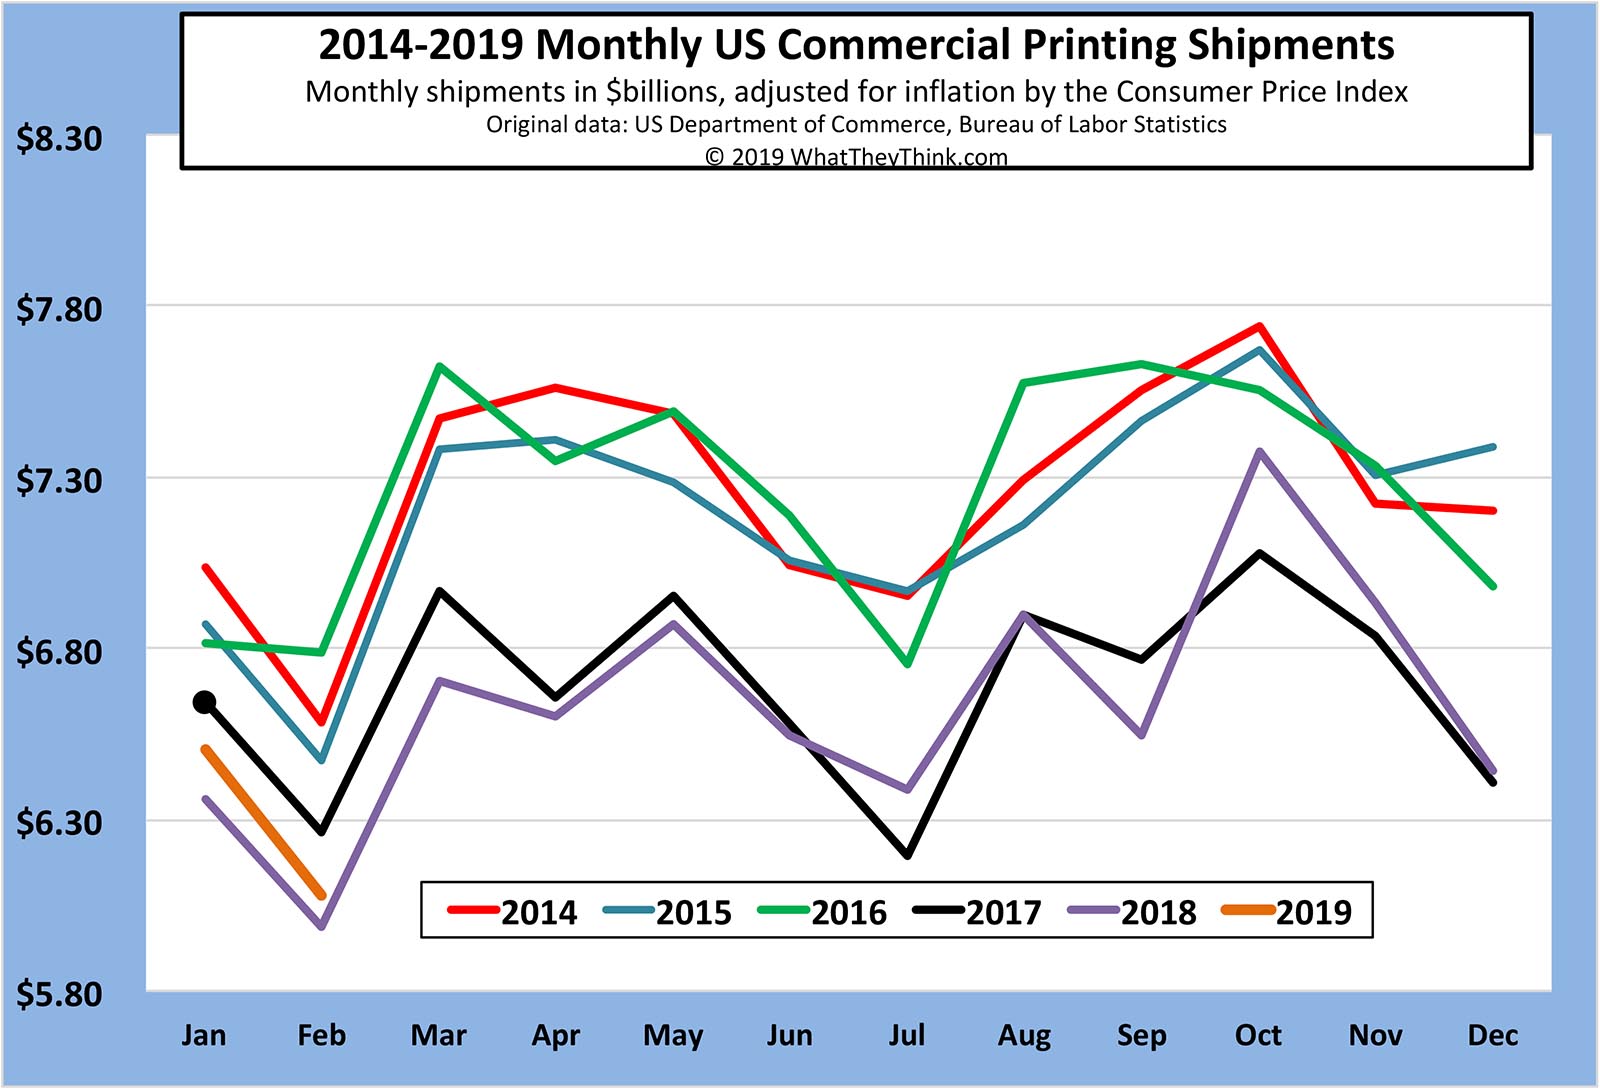
March Printing Shipments: A Day at the Races
Published: May 17, 2019
The value of printing shipments for March were up from February. However, at $6.66 billion, March 2019 shipments came in below March 2018’s $6.74 billion. That’s not a huge disappointment, but we were hoping for a better month. Full Analysis
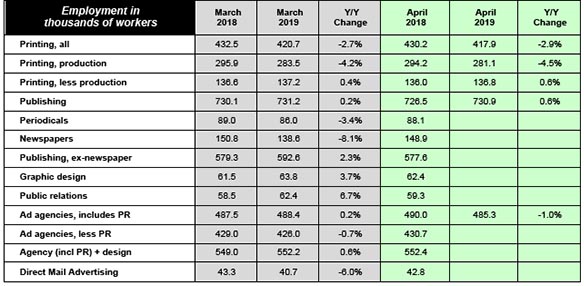
Printing’s Labor's Lost?
Published: May 10, 2019
Overall printing employment dropped -0.7% from March to April 2019 and on a year-over-year basis is down -2.9%. Production employment dropped a tad from March to April, and is down -4.5% from April 2018. Non-production employment was up +0.6% from April 2018 to April 2019. Full Analysis
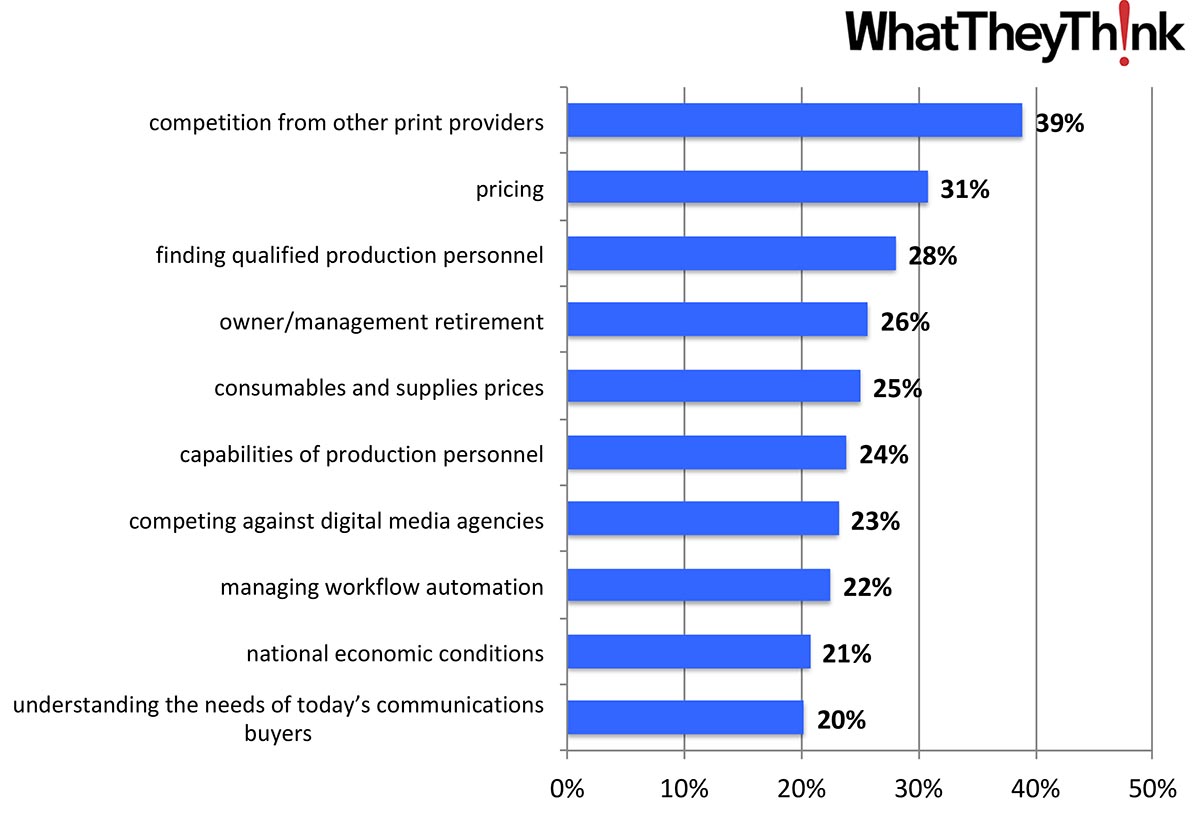
Print Business Challenges: Some Old Cares, Some New Concerns
Published: May 3, 2019
In Winter 2018/2019, we conducted our annual Print Business Outlook Survey and found that the top challenges for print businesses included some new cares and concerns with some of the old challenges falling by the wayside. Could this reflect a “changing of the guard” of print business management? Full Analysis
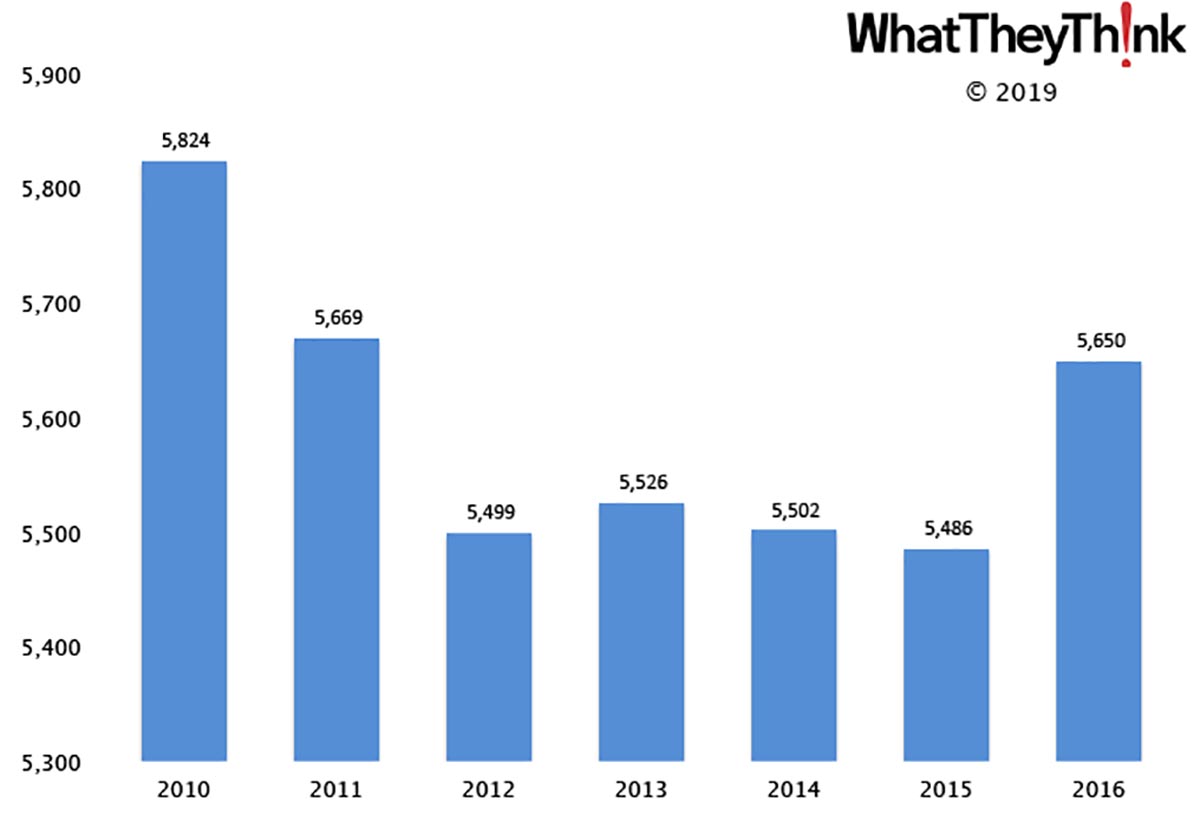
Sign Manufacturers—2010–2016
Published: April 26, 2019
In 2016, there were 5,650 Sign Manufacturing establishments (NAICS 33995). The decline and rise of sign manufacturing over the course of the 2010s reflects the impact of the Great Recession, as well as the recovery and the growth of digital printing into traditional signmaking. Full Analysis
February 2019 Printing Shipments: Starting the Year Off on the Right Foot
Published: April 19, 2019
Printing shipments for February 2019 came in at $6.08 billion. In keeping with the industry’s seasonality, it’s down from January, but so far 2019 shipments are higher than 2018’s. Full Analysis
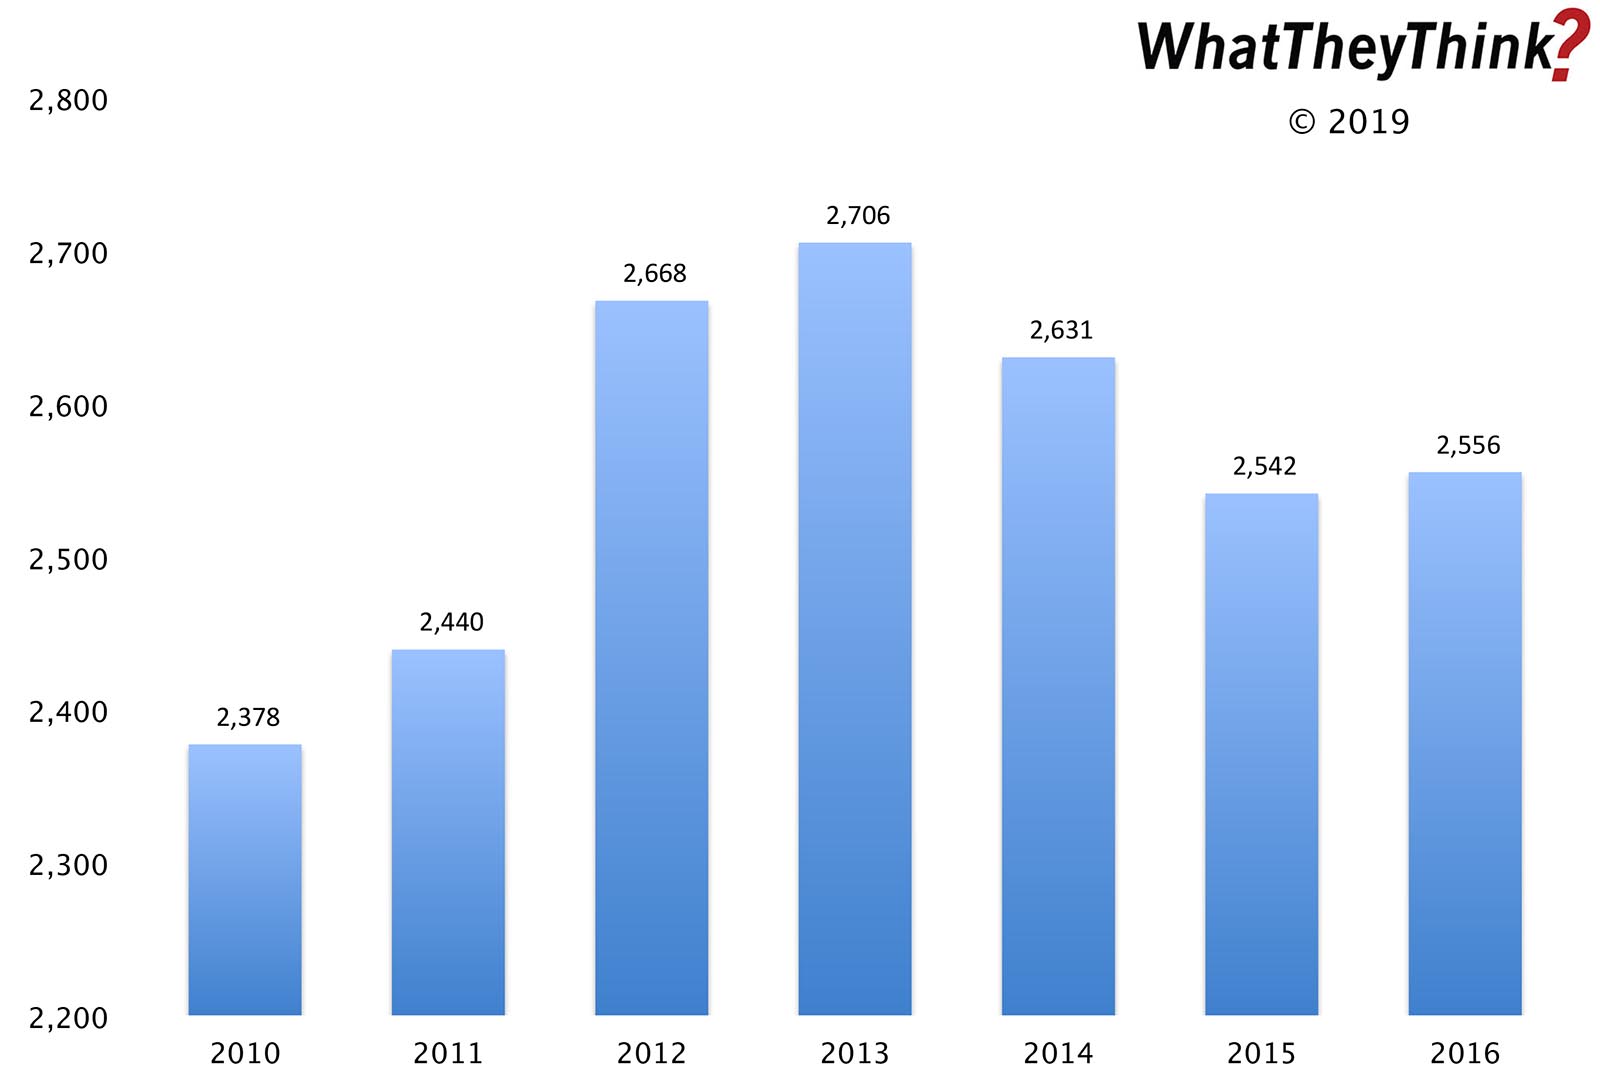
Outdoor Advertising Establishments—2010–2016
Published: April 12, 2019
In 2016, there were 2,556 establishments classified as Outdoor Advertising (NAICS 54185). In 2010, NAICS 54185 comprised 2,378 establishments—but note that the Census Bureau changed the name of this category in 2012. Full Analysis
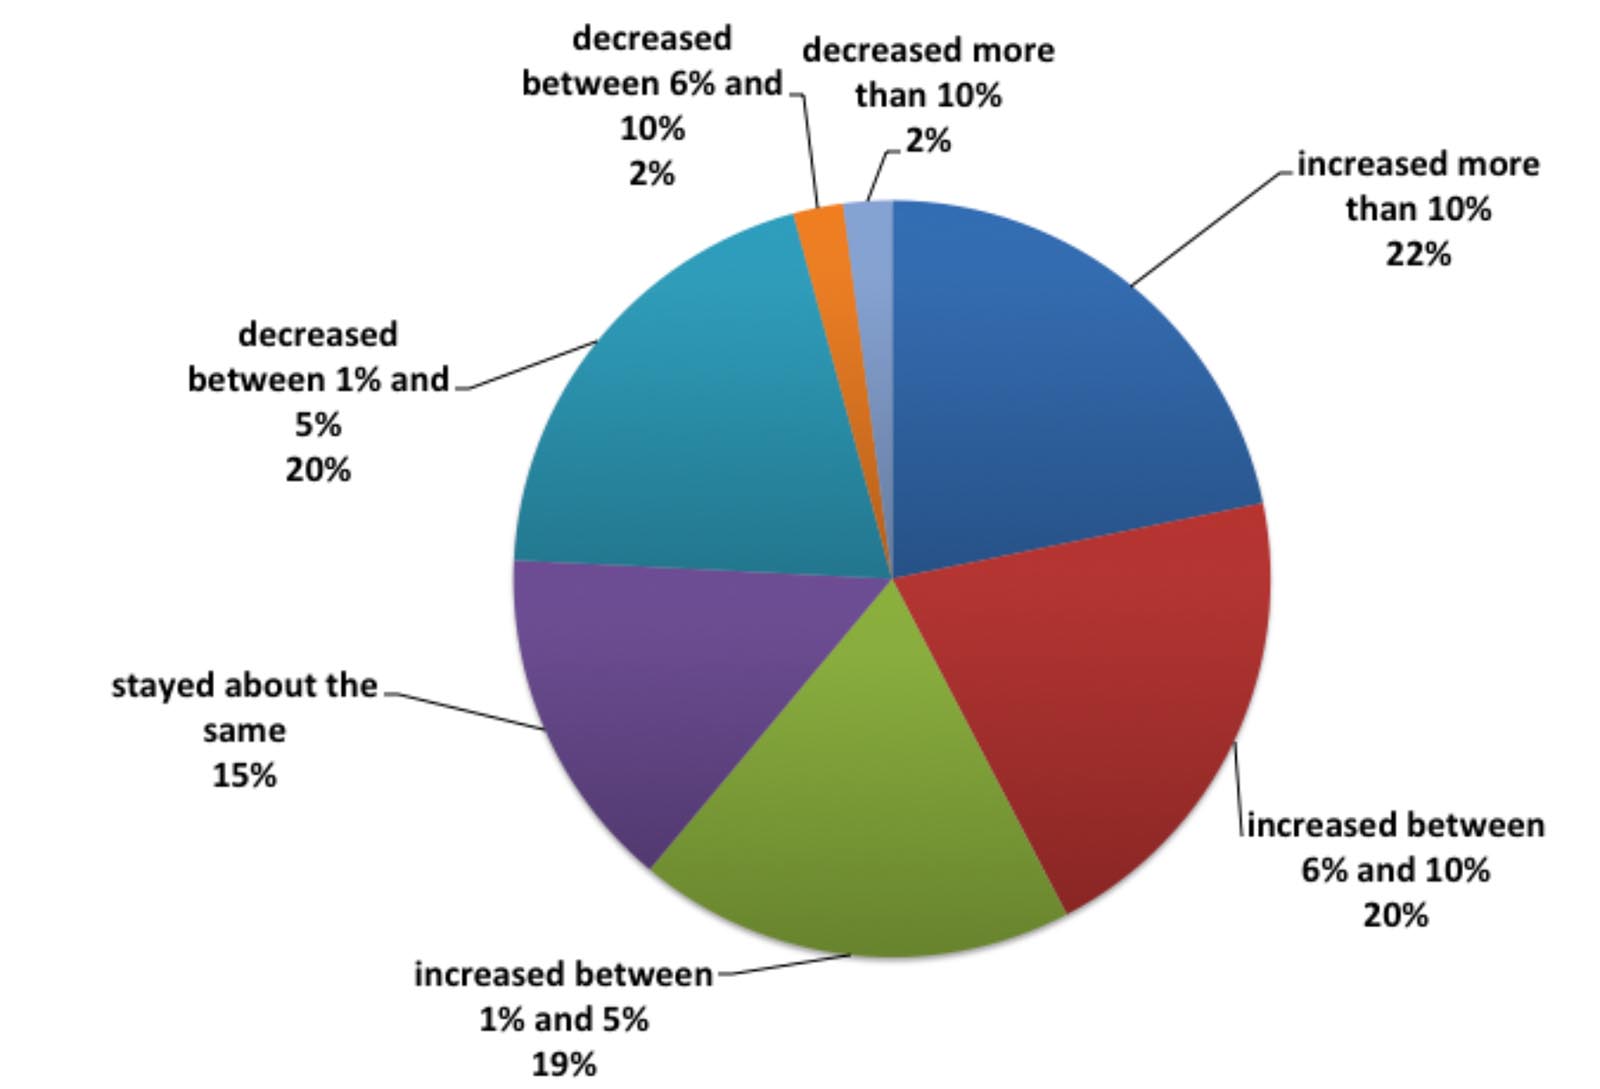
Business Conditions: Up in 2018, Optimism High for 2019
Published: April 5, 2019
In Winter 2018/2019, we conducted our annual Print Business Outlook Survey and found that business in 2018 was perceived by survey respondents as overall pretty good: 42% said that revenues had increased by six percent or more compared to 2017. Full Analysis
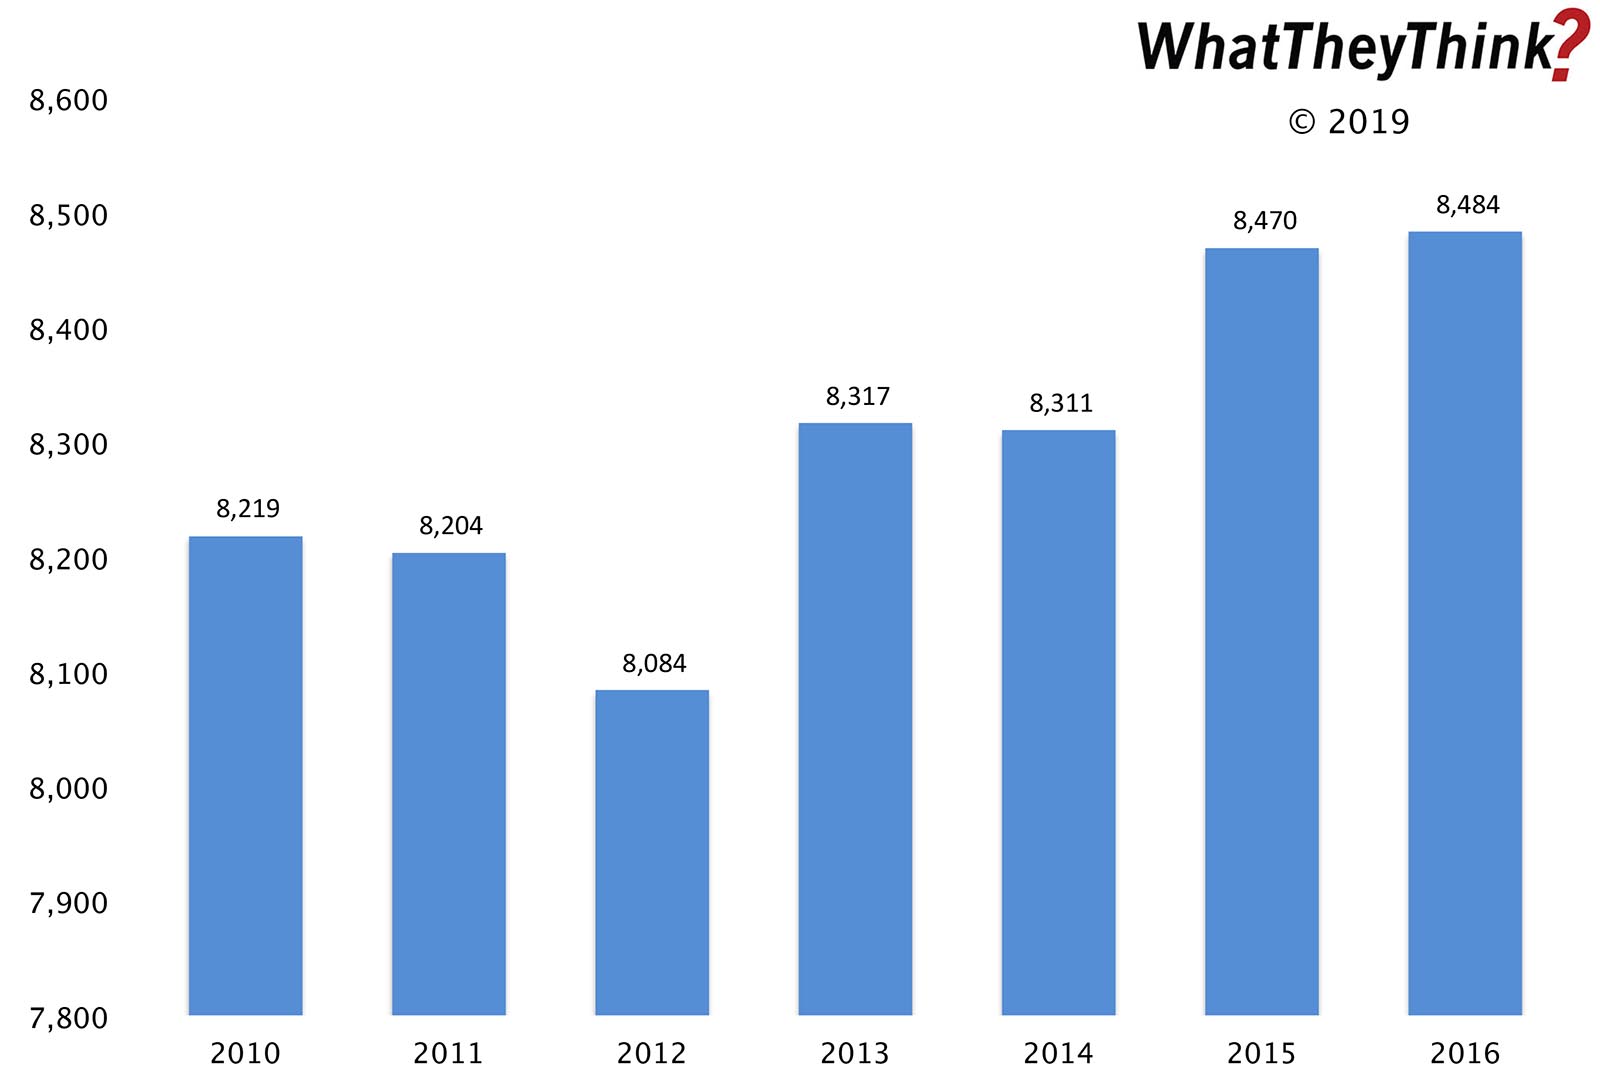
PR Establishments—2010–2016
Published: March 29, 2019
In 2010, there were 8,219 establishments classified as PR Agencies. By 2016, there had been a net gain of +3.2%. Full Analysis
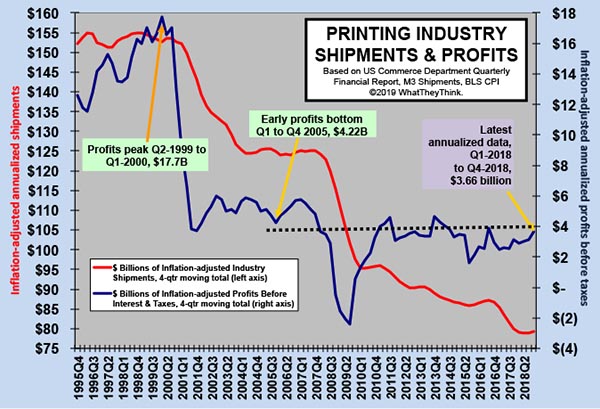
Printing Industry Profits: Urban Sprawl in the Tale of Two Cities
Published: March 22, 2019
Overall, annualized printing industry profits for Q4 2018 were $3.66 billion—not a massive gain from Q3 but a gain nonetheless (we’ll take it). It also appears that the “tale of two cities” trend is—at least temporarily—on hold. Full Analysis
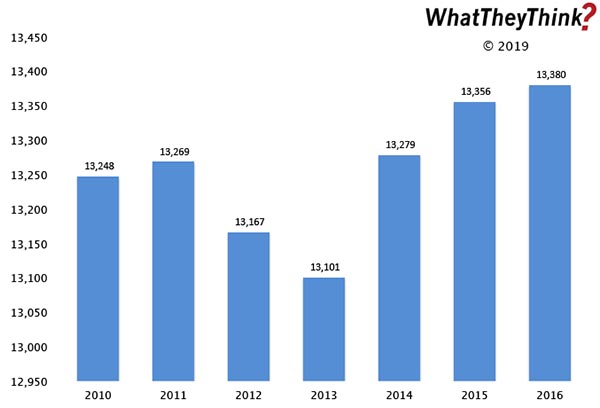
Advertising Agency Establishments—2010–2016
Published: March 15, 2019
In 2010, there were 13,248 establishments classified as Advertising Agencies. By 2016, there had been a net gain of +1.0%, the ups and downs reflecting the changing role of the ad agency. Full Analysis
December 2018 Printing Shipments: Ending 2018 on a High(ish) Note
Published: March 8, 2019
Printing shipments for December 2018 came in at $6.40 billion. In keeping with the industry’s new seasonality, that’s down from November, but higher than December 2017—but just barely. Full Analysis
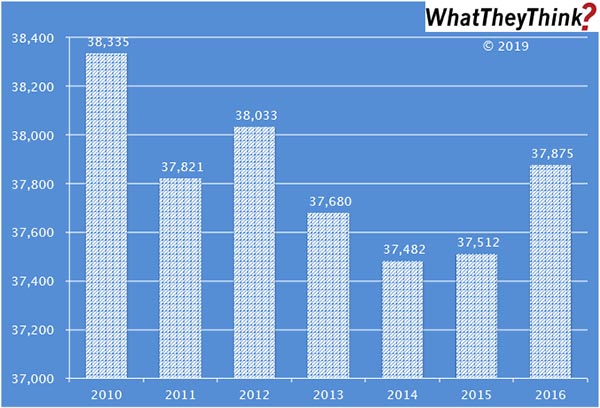
Advertising and Related Establishments—2010–2016
Published: March 1, 2019
In 2010, there were 38,335 establishments classified as Advertising, Public Relations, and Related Services. By 2016, there had been a net loss of -1.2%. This is a very broad industry classification, comprising a disparate bunch of business types, each of which has its own unique dynamics. Full Analysis
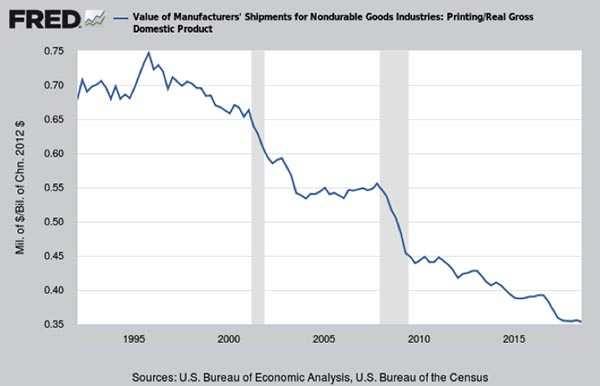
Printing Shipments as a Percentage of GDP
Published: February 22, 2019
Since 1997, the value of printing shipments went from around 0.75% of GDP all the way down to about 0.35%. So we should not be surprised that parts of the printing industry are falling off the government’s radar. Full Analysis
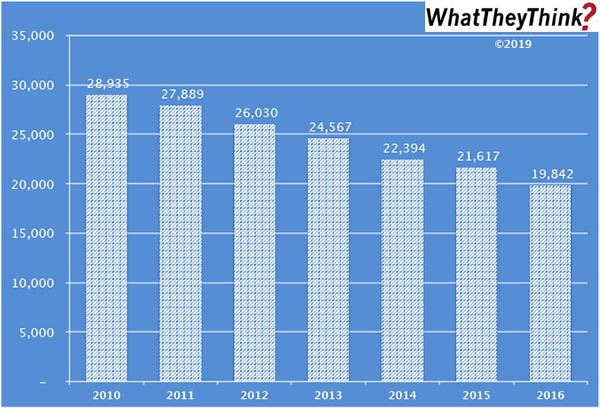
Book Printing Employees—2010–2016
Published: February 15, 2019
In 2010, there were a total of 28,935 employees in U.S. book printing establishments (NAICS 323117). By 2016, book printing employment had dropped to 19,842. Full Analysis
November 2018 Printing Shipments: Meeting Expectations
Published: February 8, 2019
Printing shipments for November 2018 came in at $6.93 billion. In keeping with the industry’s new seasonality, that’s down from October—but it’s still above November 2018’s $6.80 billion. Full Analysis
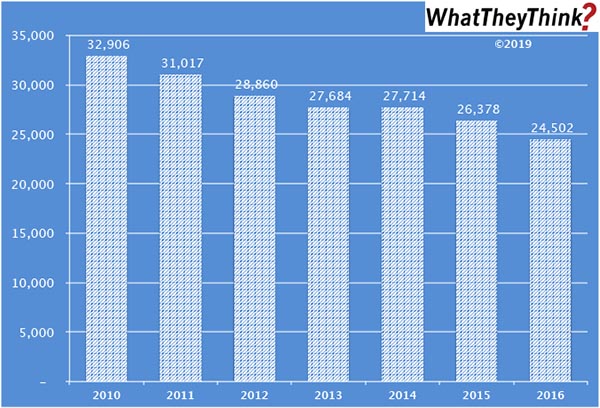
Prepress and Postpress Services Employees—2010–2016
Published: February 1, 2019
In 2010, there were a total of 32,906 employees in U.S. prepress and postpress services establishments (NAICS 32312). By 2016, “support services for printing” employment had dropped to 24,502. Full Analysis
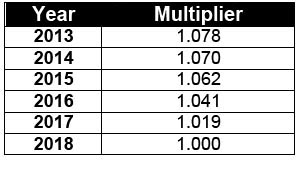
Latest Inflation Adjustment Multipliers
Published: January 25, 2019
Every January, we provide the latest inflation-adjustment multipliers so that print business owners can get a real sense of how they are performing year-over year. Full Analysis
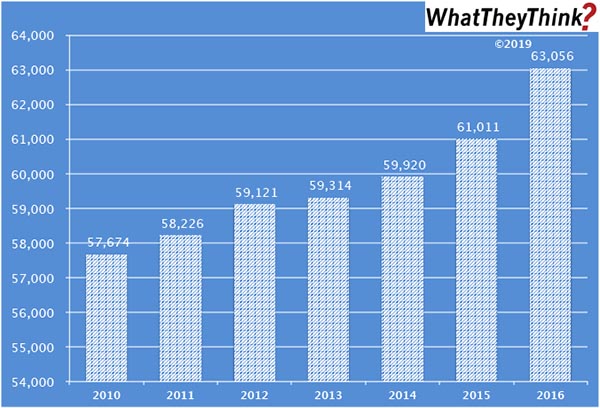
Screen Printing Employees—2010–2016
Published: January 18, 2019
In 2010, there were a total of 57,674 employees in U.S. screen printing establishments (NAICS 323113). By 2016, screen printing employment had grown to 63,056—the opposite of what we have seen in general commercial printing during that same period. Full Analysis
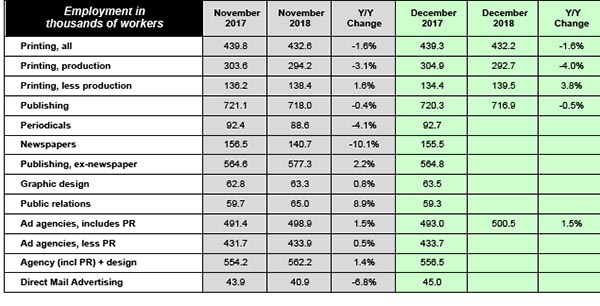
Graphic Arts Employment Held Steady in December
Published: January 11, 2019
Overall printing employment stayed roughly the same from November to December 2018, and, compared to December 2017, declined -1.6%. Non-production printing employment was up a bit in December, production employment down by about the same bit. PR employment continues to be the industry growth spot. Full Analysis
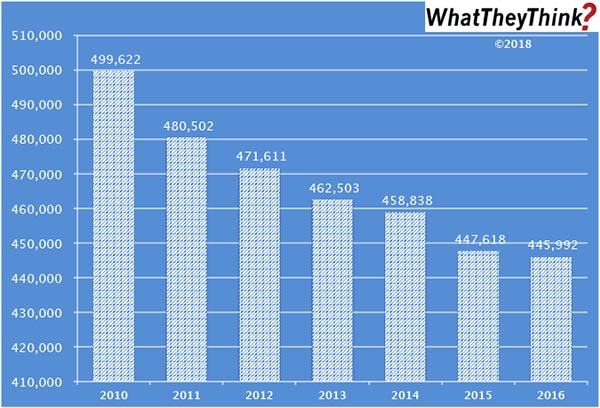
Commercial Printing Employees—2010–2016
Published: December 21, 2018
In 2010, there were a total of 499,622 employees in all commercial printing and related support businesses (NAICS 323). By 2016, overall industry employment had dropped to 445,992. Full Analysis
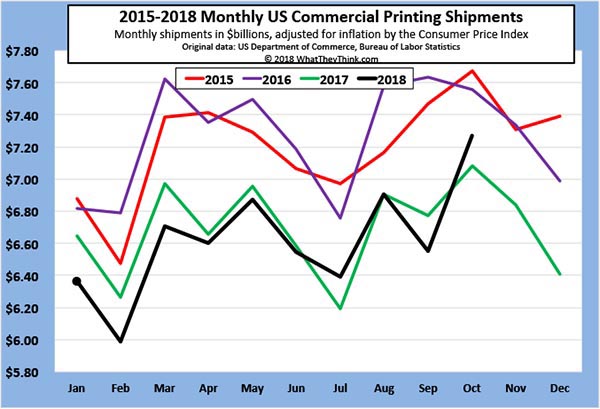
October 2018 Printing Shipments: Suitable for Framing
Published: December 14, 2018
Printing shipments for October 2018 came in at $7.27 billion. That’s up from September—and it’s well above October 2018’s $7.08 billion. Welcome to the new seasonality. Full Analysis
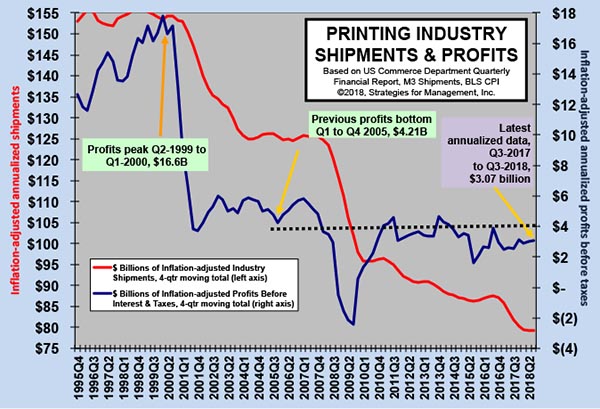
Printing Industry Profits: The Tale of Two Cities Continues
Published: December 7, 2018
Industry profits data came out earlier this week, and it was good and bad news. Overall, annualized profits for Q3 2018 were $3.07 billion—not a huge gain from Q2, but a gain nonetheless. But it’s the ongoing saga of the low profitability of large printers dragging down average industry profitability. Full Analysis
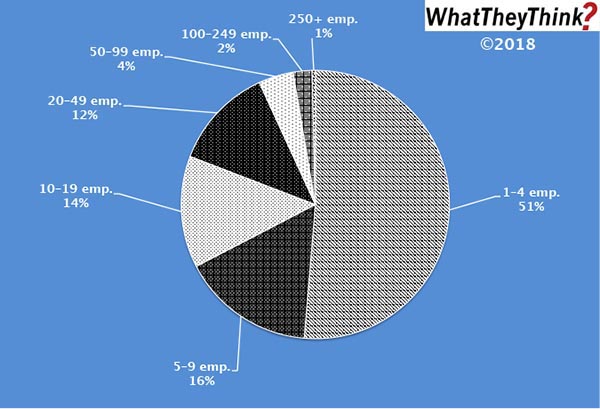
Prepress and Postpress Services Establishments—2016
Published: November 30, 2018
In 2016, there were 1,545 total U.S. establishments offering prepress and/or postpress services (NAICS 32312); 51% of these establishments had fewer than 10 employees. Full Analysis
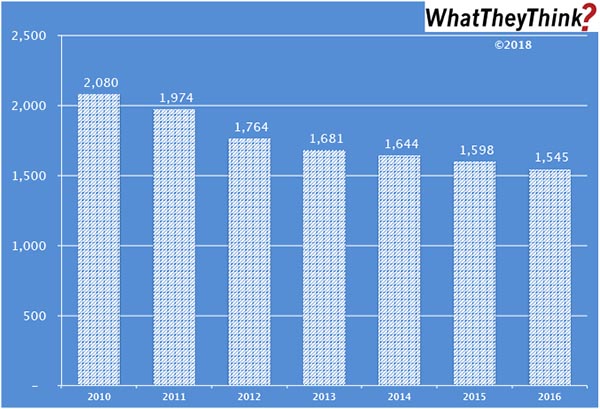
Prepress and Postpress Services Establishments
Published: November 16, 2018
In 2010, there were 2,080 establishments offering prepress and/or postpress services; by 2016, that number had dropped to 1,545. (The Census Bureau stopped breaking out prepress and postpress establishments separately in 2012.) It’s not difficult to understand why the number of these establishments has been dropping; prepress is being absorbed into the printing process itself (especially in digital printing), and more print businesses are acquiring their own finishing capabilities. Full Analysis
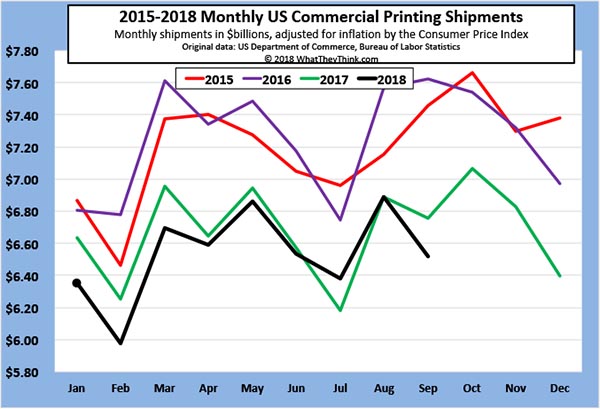
End of the Season? September 2018 Printing Shipments
Published: November 9, 2018
Printing shipments for September 2018 came in at $6.52 billion. That’s down from August—and it’s well below August 2017’s $6.76 billion. Are we seeing a new seasonality in the printing industry—or the end of any seasonality? Full Analysis
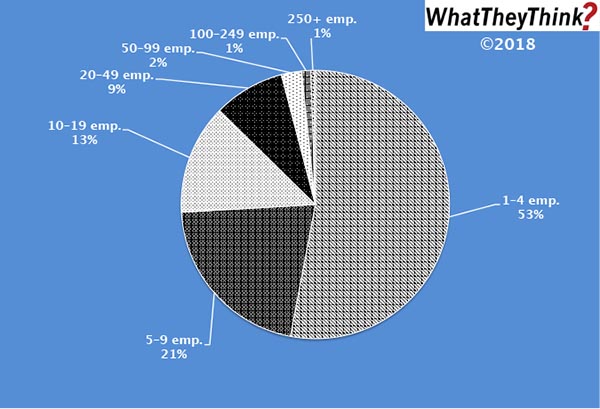
Screen Printers—2016
Published: November 2, 2018
In 2016, there were 5,150 total U.S. commercial screen printing establishments. As with most printing categories, the majority have under 10 employees, but screen shops tend to be smaller than other kinds of printing establishments. Full Analysis
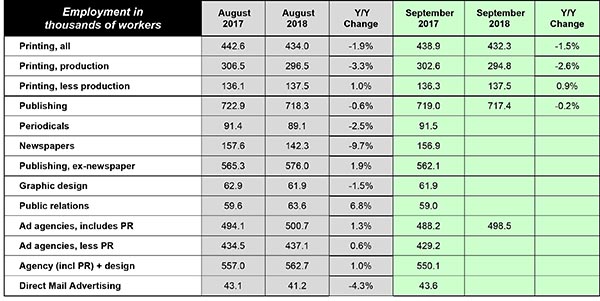
Graphic Arts Employment Continues to Decline; PR Employment Continues to Grow
Published: October 26, 2018
Overall printing employment dropped from August to September 2018, and on a year-over-year basis is down -1.5%. Non-production printing employment was up slightly, indicating that production staff are the hardest employees to find. PR employment is again the industry bright spot, employment-wise. Full Analysis
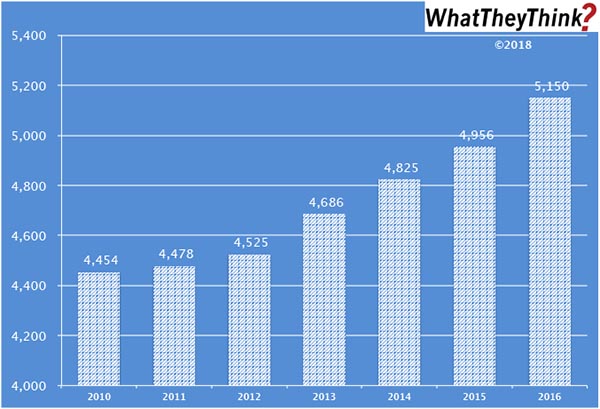
Screen Printers 2010–2016
Published: October 19, 2018
From 2010 to 2016, the number of U.S. commercial screen printing establishments increased from 4,454 to 5,150. Growth in screen printing establishments has been consistent from year to year. Chalk this up to the rise of specialty printing. Full Analysis
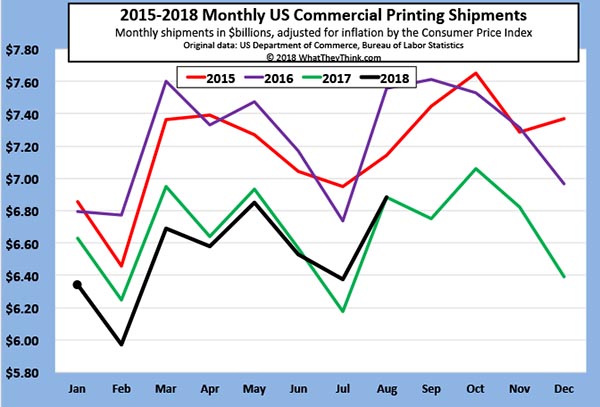
Dead Heat: August 2018 Printing Shipments
Published: October 12, 2018
Printing shipments for August 2018 came in at $6.89 billion. That’s essentially even with August 2017’s $6.88 billion on an inflation-adjusted basis. Full Analysis
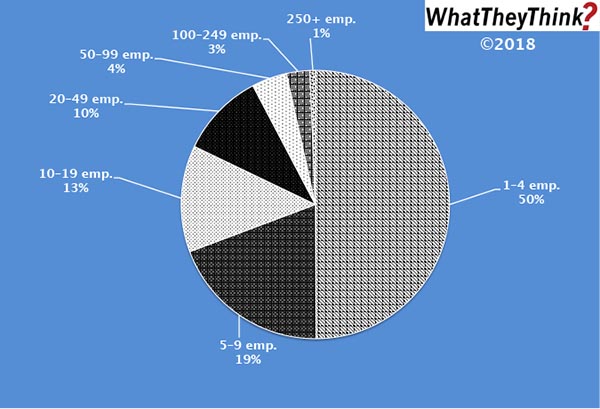
Commercial Printers—2016
Published: October 5, 2018
In 2016, there were 18,405 total commercial printing establishments (excluding screen and book printers). Half of them have fewer than 5 employees. Full Analysis
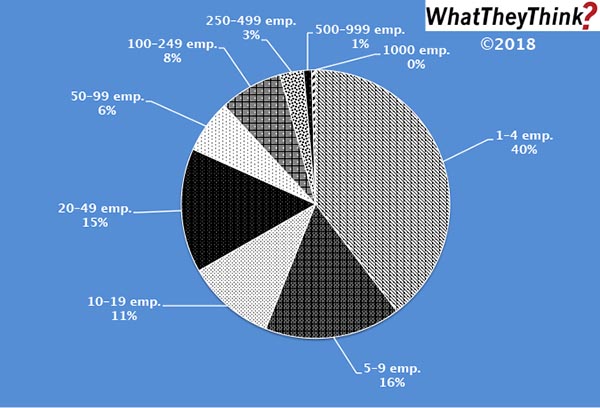
Book Printers—2016
Published: September 28, 2018
In 2016, there were 421 total book printing establishments. The majority have under 10 employees. This is similar to what we find in general commercial printing—yet different. Full Analysis
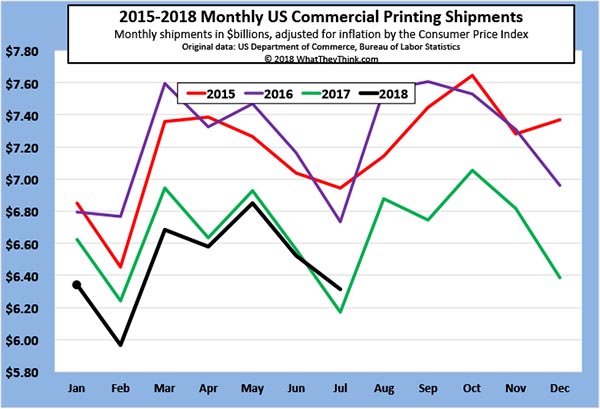
July 2018 Printing Shipments: We Have Some Good News and Some Bad News
Published: September 21, 2018
Printing shipments for July 2018 came in at $6.31 billion—that’s down -3.4% from June, but it’s up +2.3% from July 2017. We’ll take whatever victories we can. Full Analysis
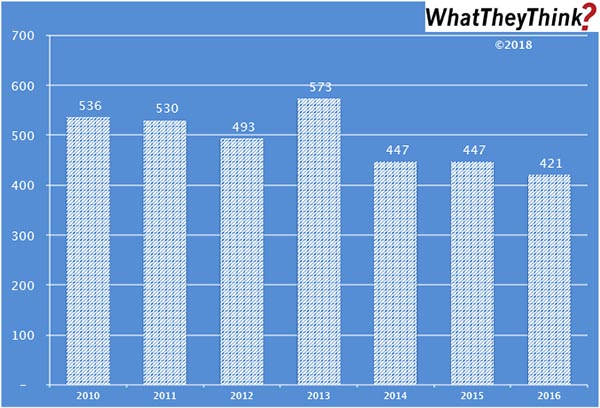
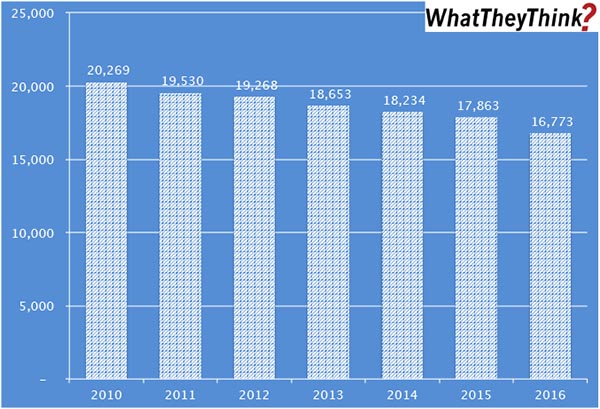
Book Printers—2010–2016
Published: September 14, 2018
In 2010, there were 536 book printing establishments. In the ensuing six years, the establishment count would drop -21%. So says our Commercial Printing Establishments tracker. Full Analysis
Words of the Profits
Published: September 7, 2018
Looking at the most recent industry profits data that came out earlier this week, we continue to tell the “tale of two cities.” Low profitability of large printers is dragging down average industry profitability. For the industry as a whole, cracking—or re-cracking—$4 billion in profits is proving to be an elusive goal. Full Analysis
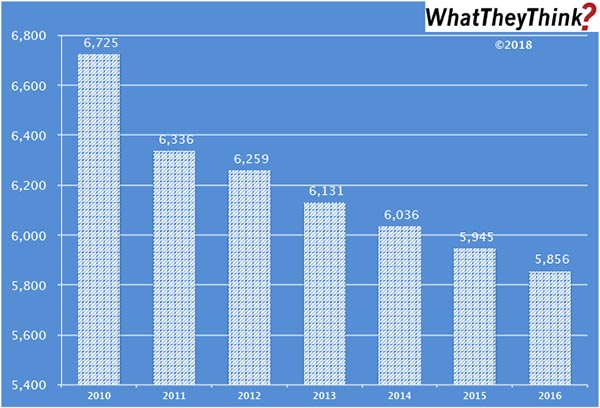
Mid-Size Establishments—2010–2016
Published: August 31, 2018
In 2010, there were 6,725 10–19-employee commercial printing establishments. Among this demographic category, there was the most precipitous drop from 2010 to 2011—the fallout from the Great Recession which started to take its toll after 2009. By 2012, the bleeding had been largely stanched, and the year-to-year declines were more modest. So says our recently launched Commercial Printing Establishments tracker. Full Analysis
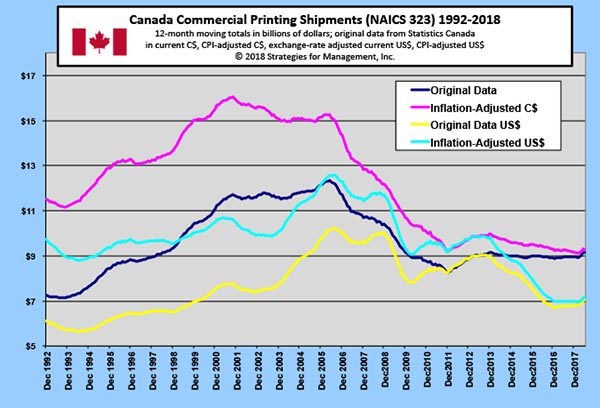
Canadian Printing Shipments
Published: August 24, 2018
Looking at the 12-month moving average of Canada’s printing shipments, it may look like Canada’s printing industry has been holding steady, but the inflation-adjusted figures show a slight decline from a recent peak at the end of 2013. Full Analysis
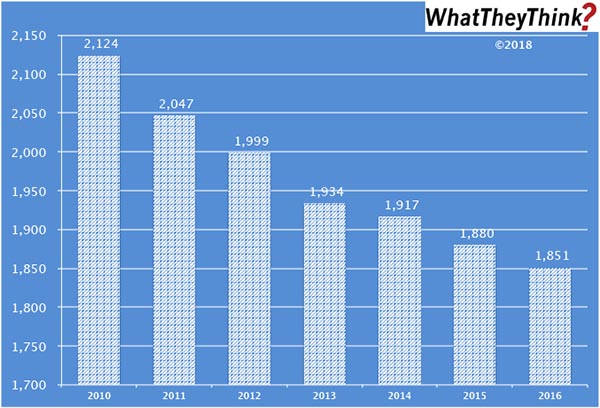
Consolidation Among Large Print Businesses: 2010–2016
Published: August 17, 2018
In 2010, there were 2,124 establishments having 50 or more employees. By 2016, they had dropped to 1,851 (down -13%). So says our new Commercial Printing Establishments tracker, based on data from the Census Bureau’s County Business Patterns, which presents—in spreadsheet form—U.S. commercial printing establishments from 2010 to 2016, broken down by six different print business classifications and nine employee-size breakdowns. Full Analysis
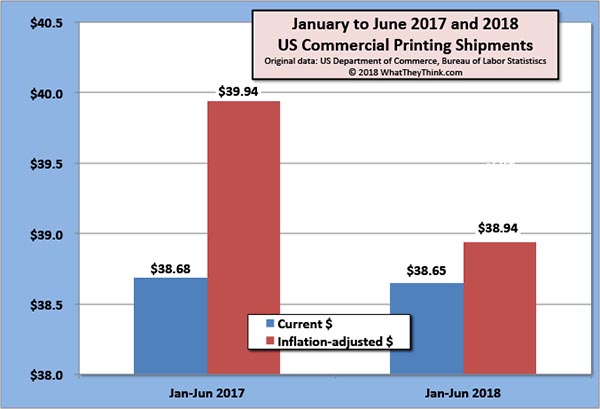
Printing Shipments Head Into the Dog Days of Summer
Published: August 10, 2018
The inflation-adjusted value of printing shipments for June 2018 were down from $6.9 billion in May to $6.5 billion in June. On the plus side, it’s not appreciably below the $6.6 billion reported in June 2017. Full Analysis
WhatTheyThink Launches New Industry Establishment Data Series
Published: August 3, 2018
Our new Commercial Printing Establishments tracker, based on data from the Census Bureau’s County Business Patterns, presents—in spreadsheet form—U.S. commercial printing establishments from 2010 to 2016, broken down by six different print business classifications and nine employee-size breakdowns. Full Analysis


![]()
- The Future of AI In Packaging
- Inkjet Integrator Profiles: DJM
- Spring Inkjet Update – Webinar
- Security Ink Technologies for Anti-Counterfeiting Measures
- Komori unveils B2 UV Inkjet
- Keeping Nozzles Fresh with Flow
- Komori to Unveil the J-throne 29 Next Generation Digital Press at drupa 2024
- Inkjet drives convergence of transactional and graphic arts applications

WhatTheyThink is the official show daily media partner of drupa 2024. More info about drupa programs
© 2024 WhatTheyThink. All Rights Reserved.