Data Analysis
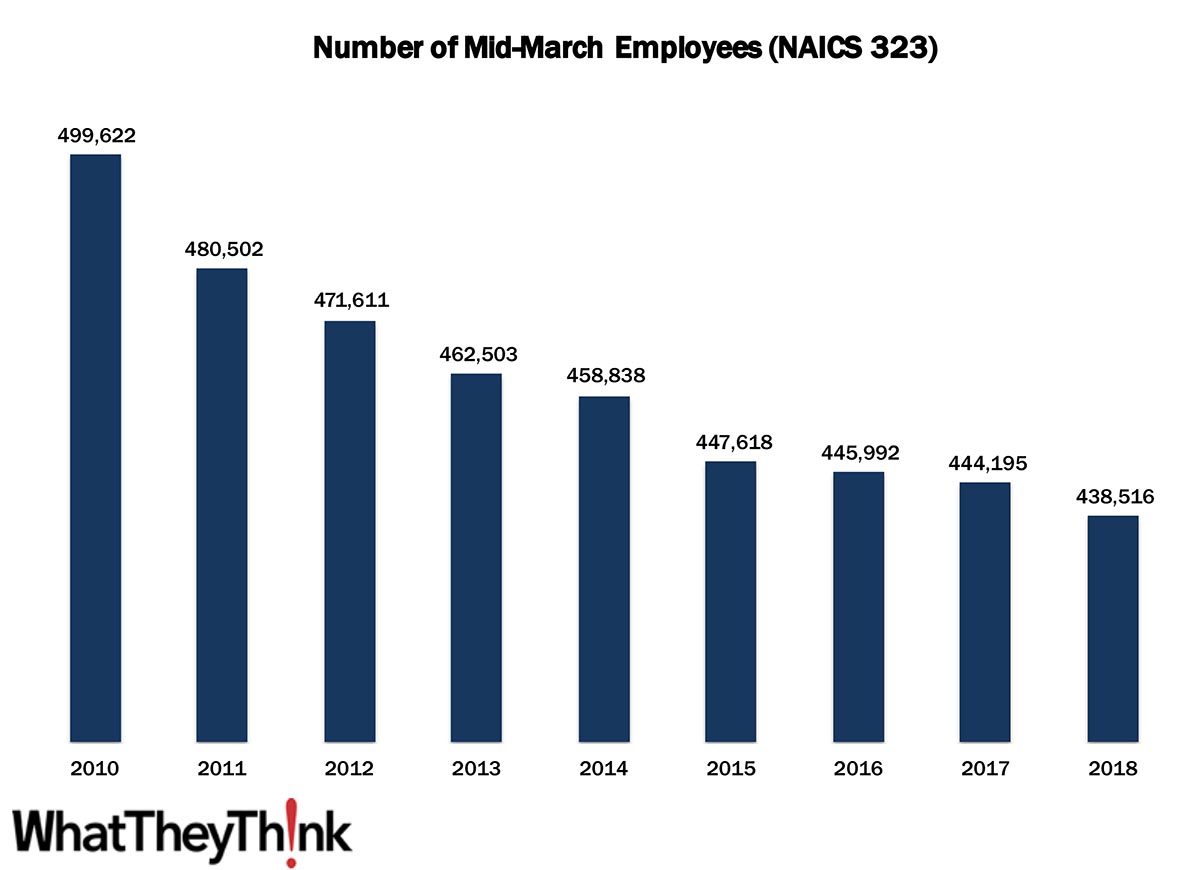
Commercial Printing Employees—2010–2018
Published: January 29, 2021
In 2010, there were 499,622 employees working in US establishments in NAICS 323. By 2018, that number had declined -12.2% to 438,516. In macro news, real GDP increased at an annual rate of 4.0% in Q4 2020. Full Analysis
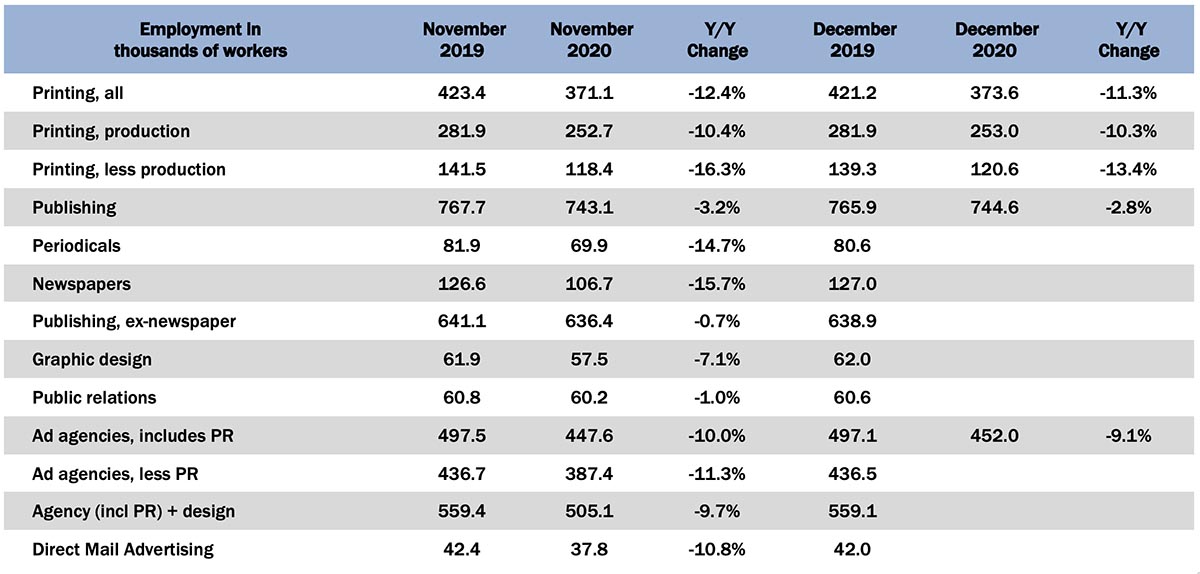
Graphic Arts Employment—December 2020
Published: January 22, 2021
In December 2020, all printing employment was up +0.7% from November, production employment up +0.1%, and non-production printing employment up +1.9%. So, basically, a holding pattern—although it’s nice that there are no negative numbers…for almost everyone. Full Analysis
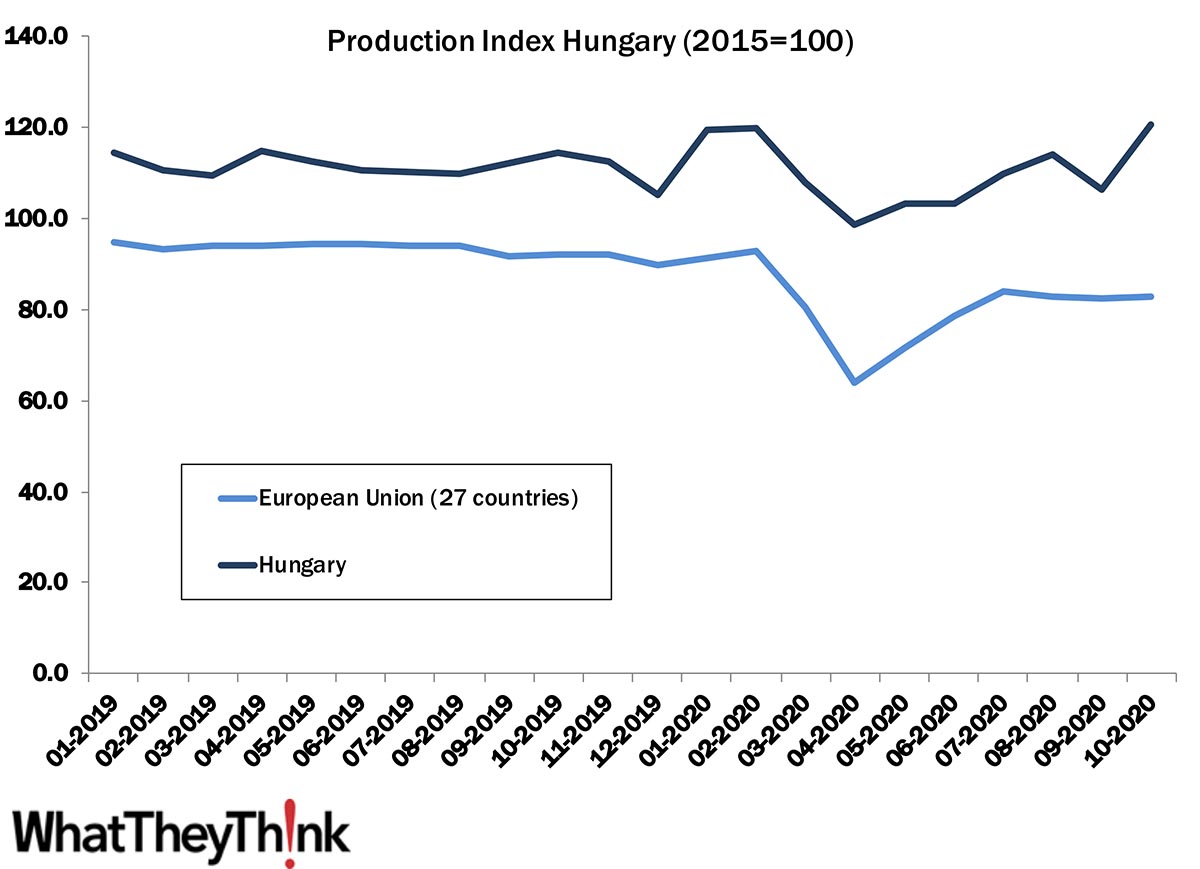
European Print Industry Snapshot: Hungary
Published: January 18, 2021
In this bimonthly series, WhatTheyThink is presenting the state of the printing industry in different European countries based on the latest monthly production numbers. This year kicks off with a look at the printing industry in Hungary. Full Analysis
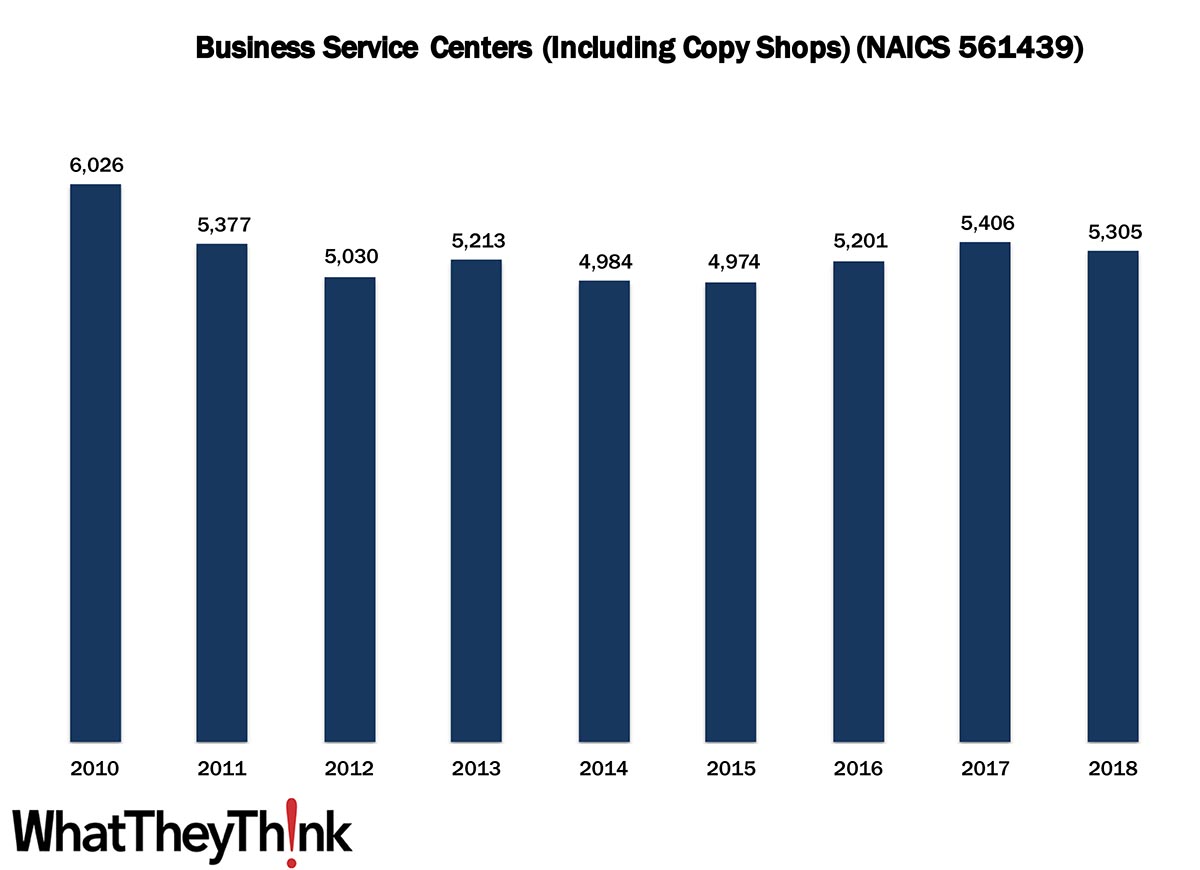
US Copy Center Establishments—2010–2018
Published: January 15, 2021
In 2010, there were 6,026 establishments in NAICS 561439 (Business Service Centers [Including Copy Shops]). By 2018, that number had declined to 5,305. In macro news, weekly initial unemployment claims were at 965,000, an increase of 181,000 from the previous week. Full Analysis
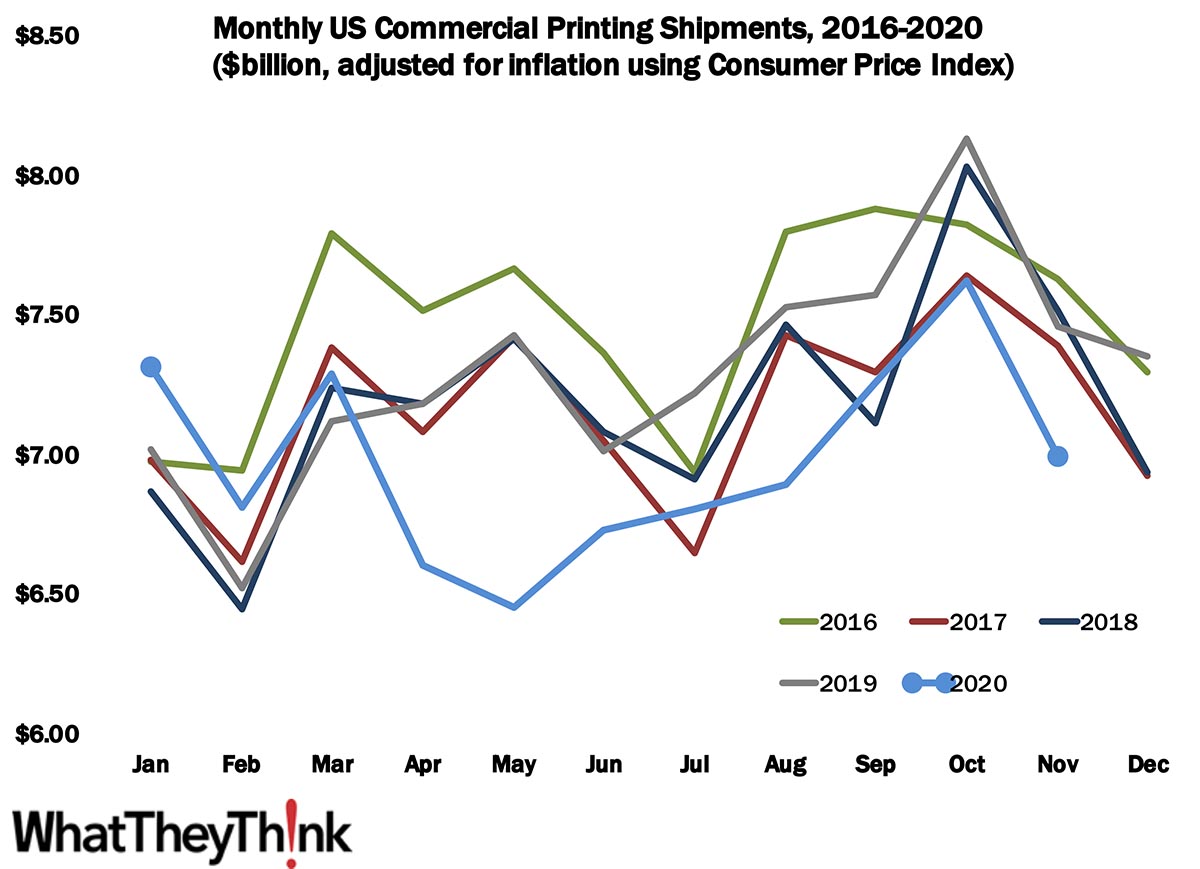
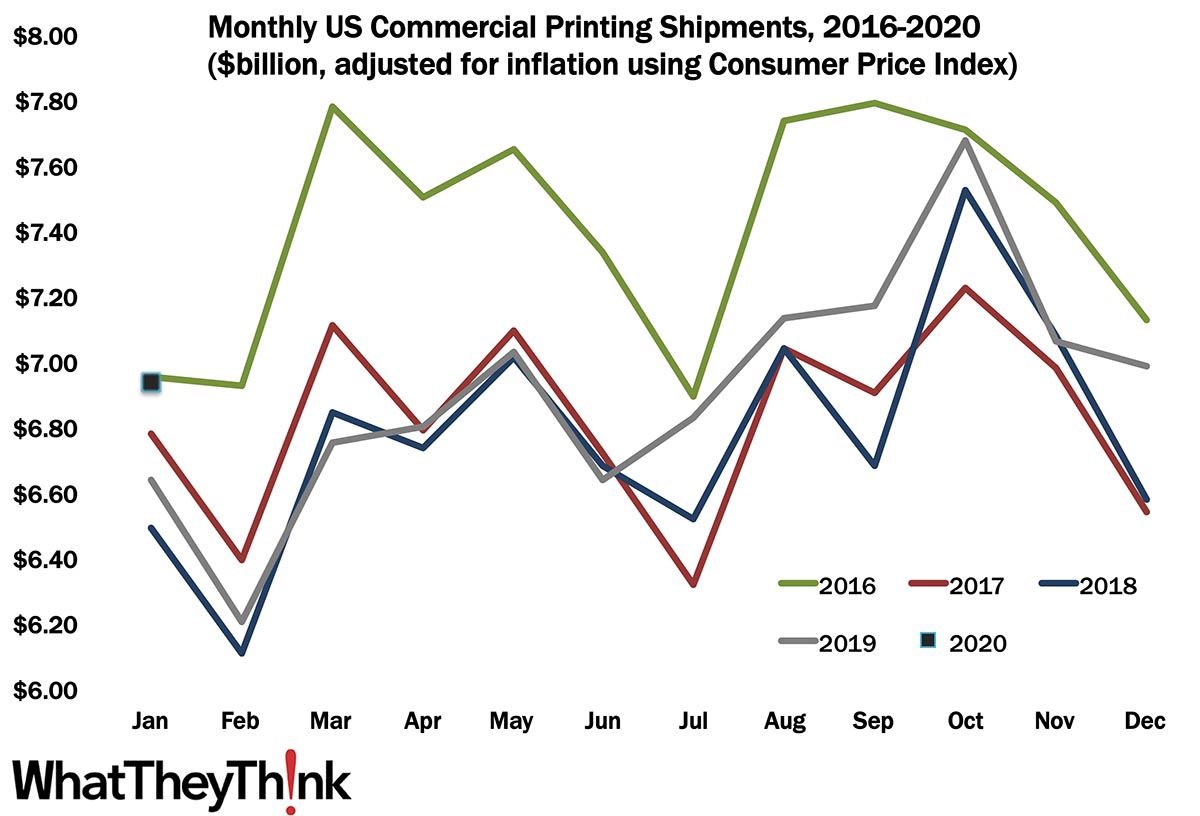
November Printing Shipments—It Was Nice While It Lasted
Published: January 8, 2021
In November 2020, after rising for five straight months, printing shipments plunged from $7.63 billion to $7.0 billion. Full Analysis
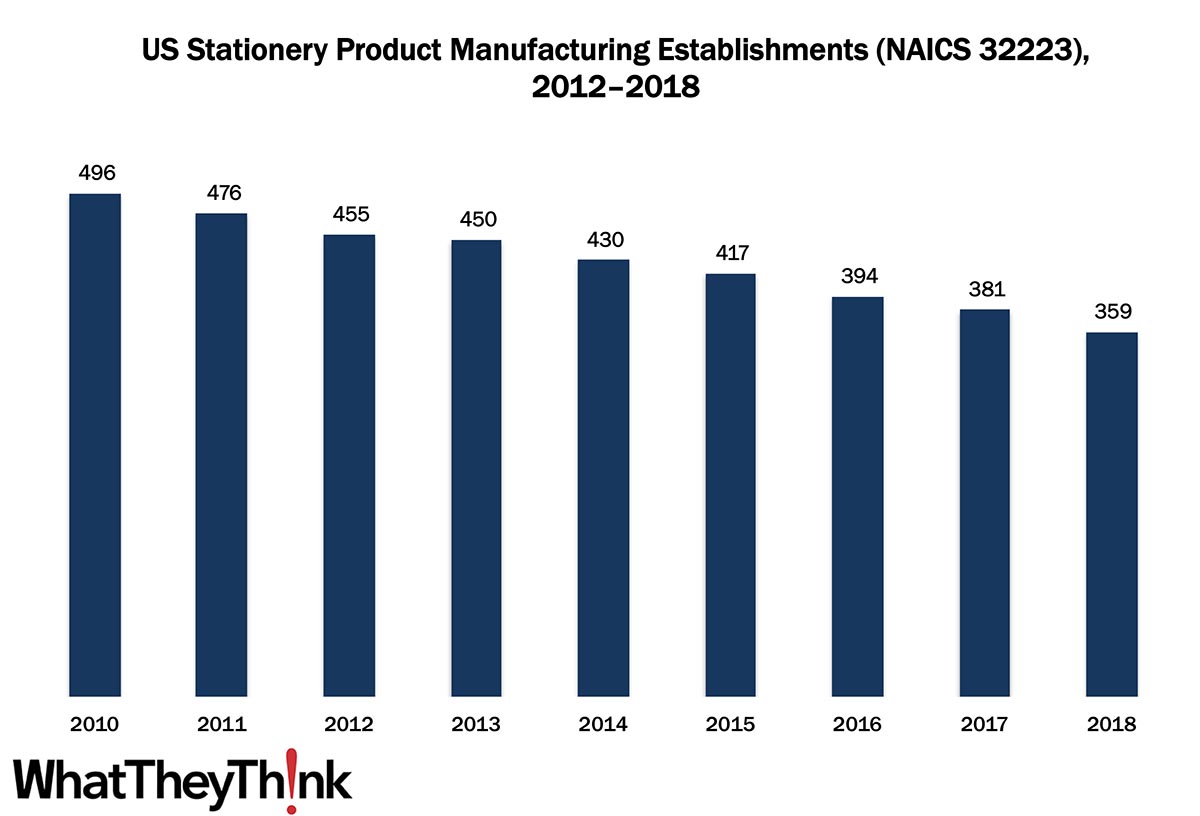
Stationery Product Manufacturing Establishments—2012–2018
Published: December 18, 2020
In 2010, there were 496 establishments in NAICS 32223 (Stationery Product Manufacturing). By 2018, that number had declined to 359. In macro news, retail sales for November took a dip. Full Analysis
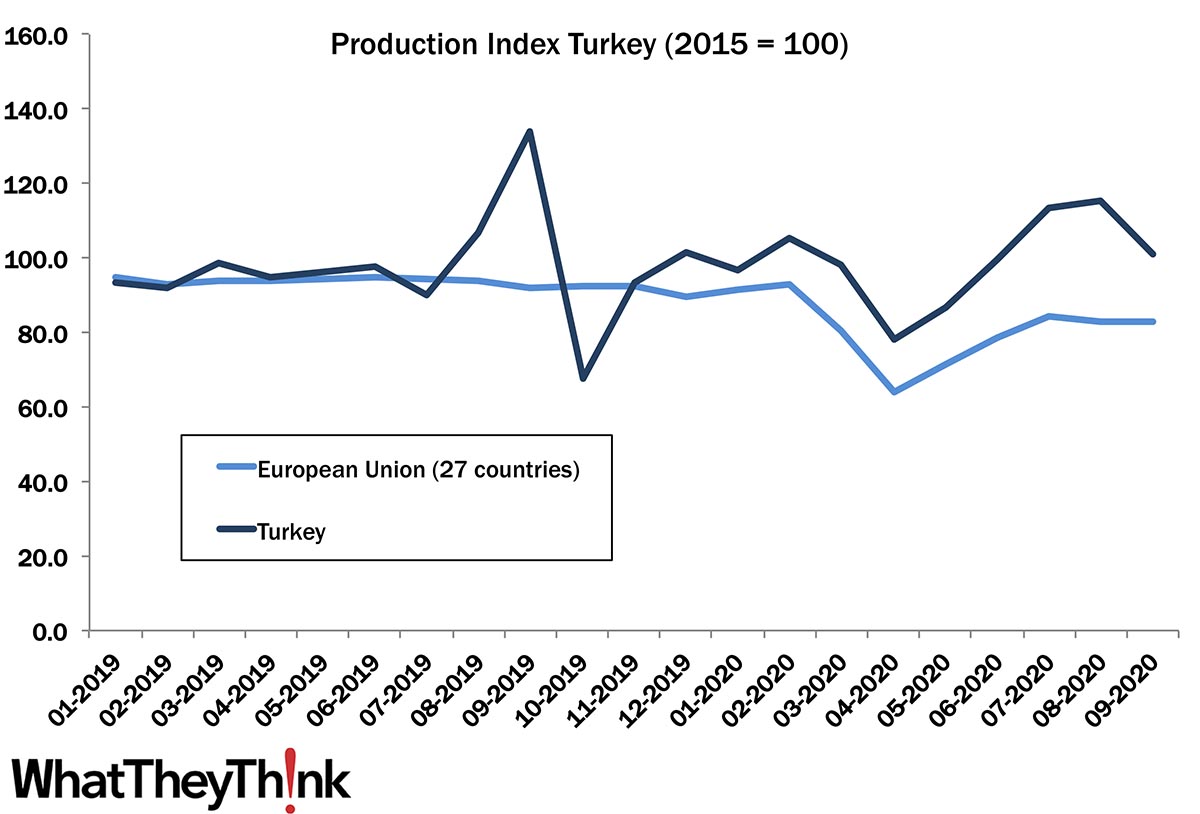
European Print Industry Snapshot: Turkey
Published: December 15, 2020
In this bimonthly series, WhatTheyThink is presenting the state of the printing industry in different European countries based on the latest monthly production numbers. This last installment for 2020 features a look at the printing industry in Turkey. Full Analysis
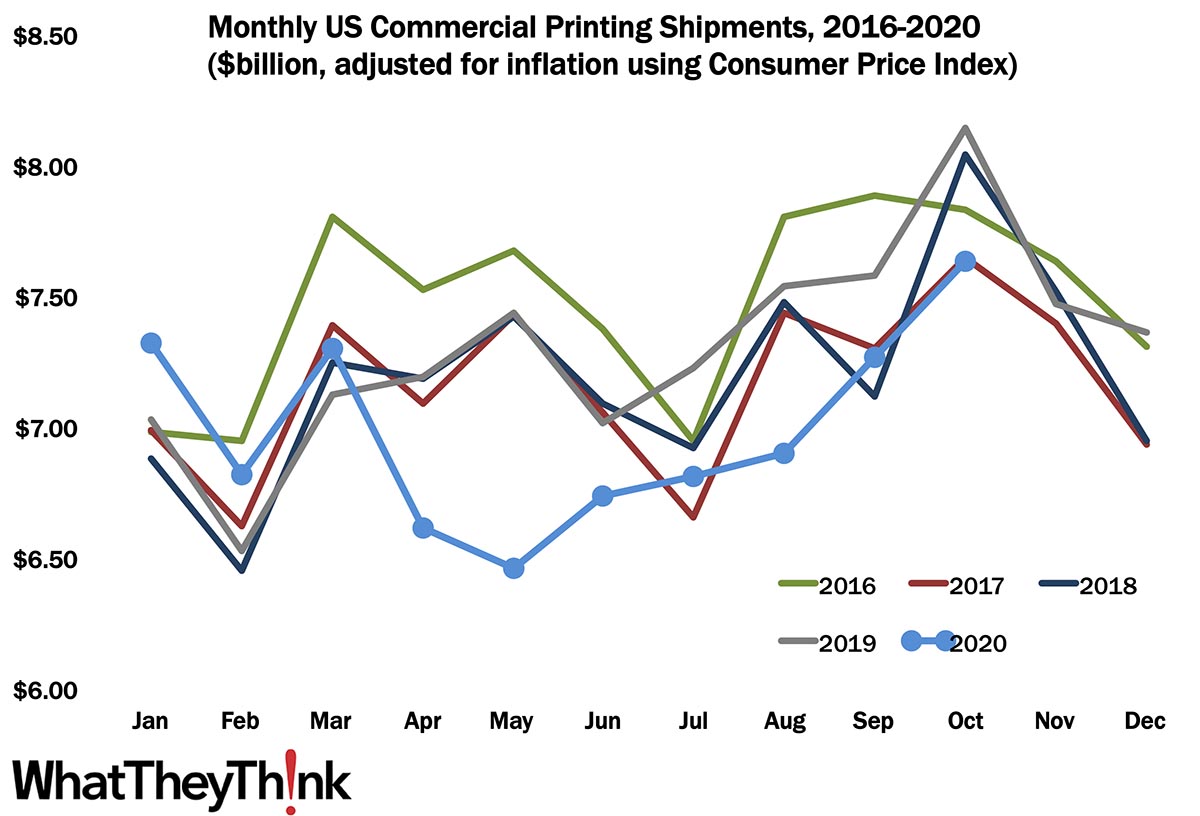
October Printing Shipments—The "Best" October in Five Years?
Published: December 11, 2020
In October 2020, printing shipments rose to $7.63 billion—the fifth straight month of increasing shipments, as the industry rebound from the depths of the spring continues. Full Analysis
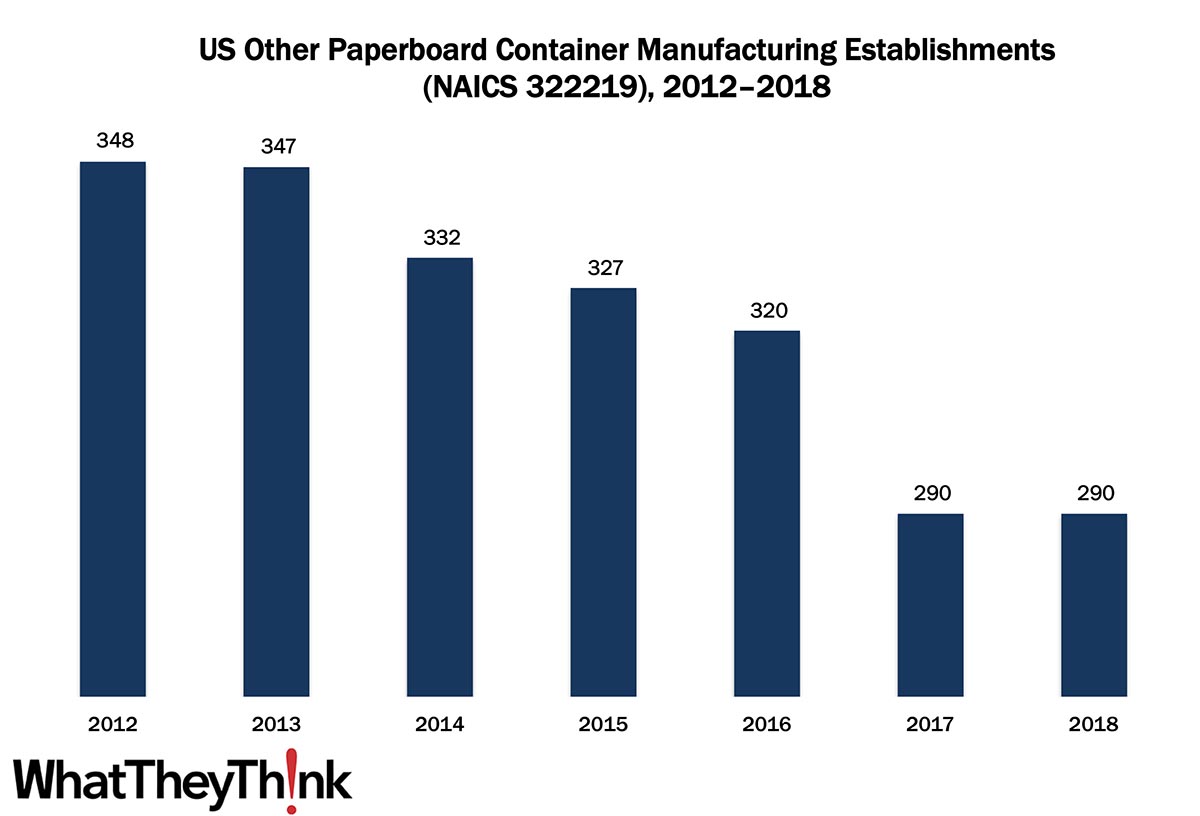
Other Paperboard Container Manufacturing Establishments—2012–2018
Published: December 4, 2020
In 2012, there were 348 establishments in NAICS 322219 (Other Paperboard Container Manufacturing). By 2018, that number had declined to 290. In macro news, highlights (if you want to call them that) from the most recent Federal Reserve “Beige Book.” Full Analysis
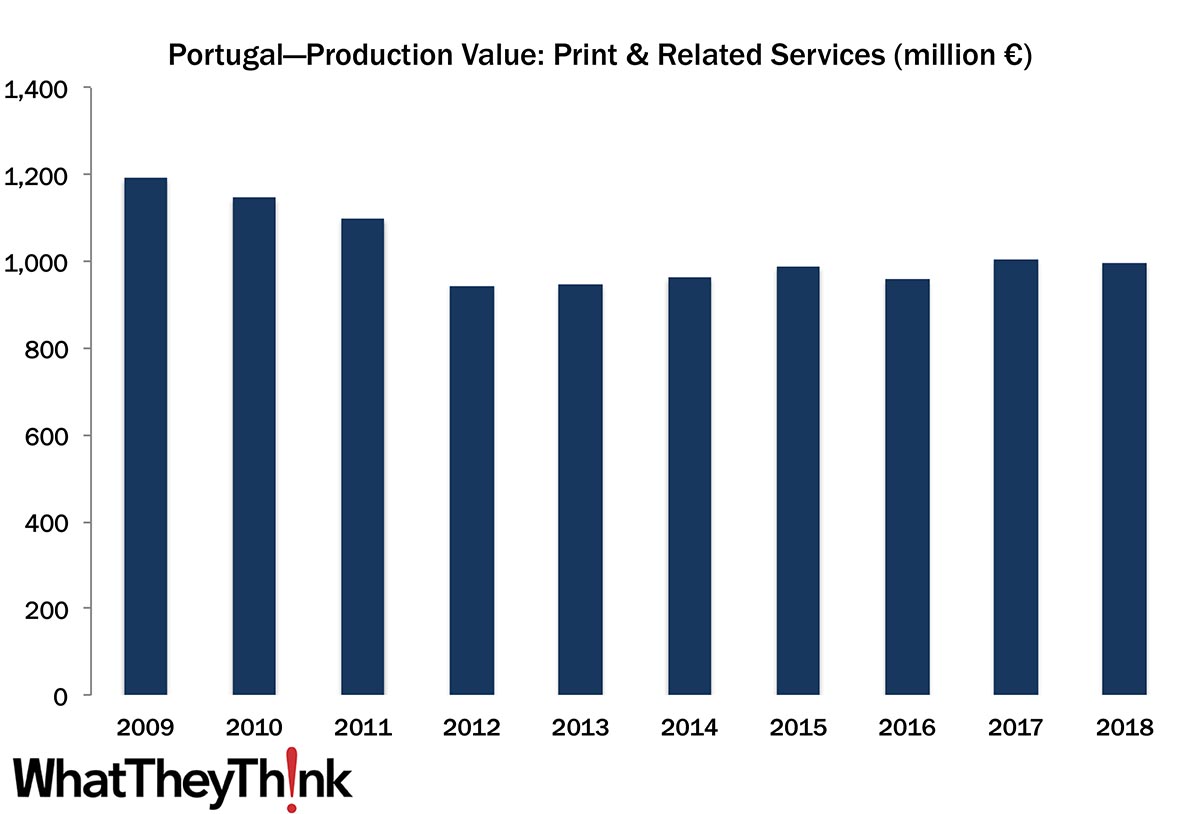
European Print Industry Snapshot: Portugal
Published: December 2, 2020
In this bimonthly series, WhatTheyThink is presenting the state of the printing industry in different European countries based on the latest monthly production numbers. This week features a look at the printing industry in Portugal. Full Analysis
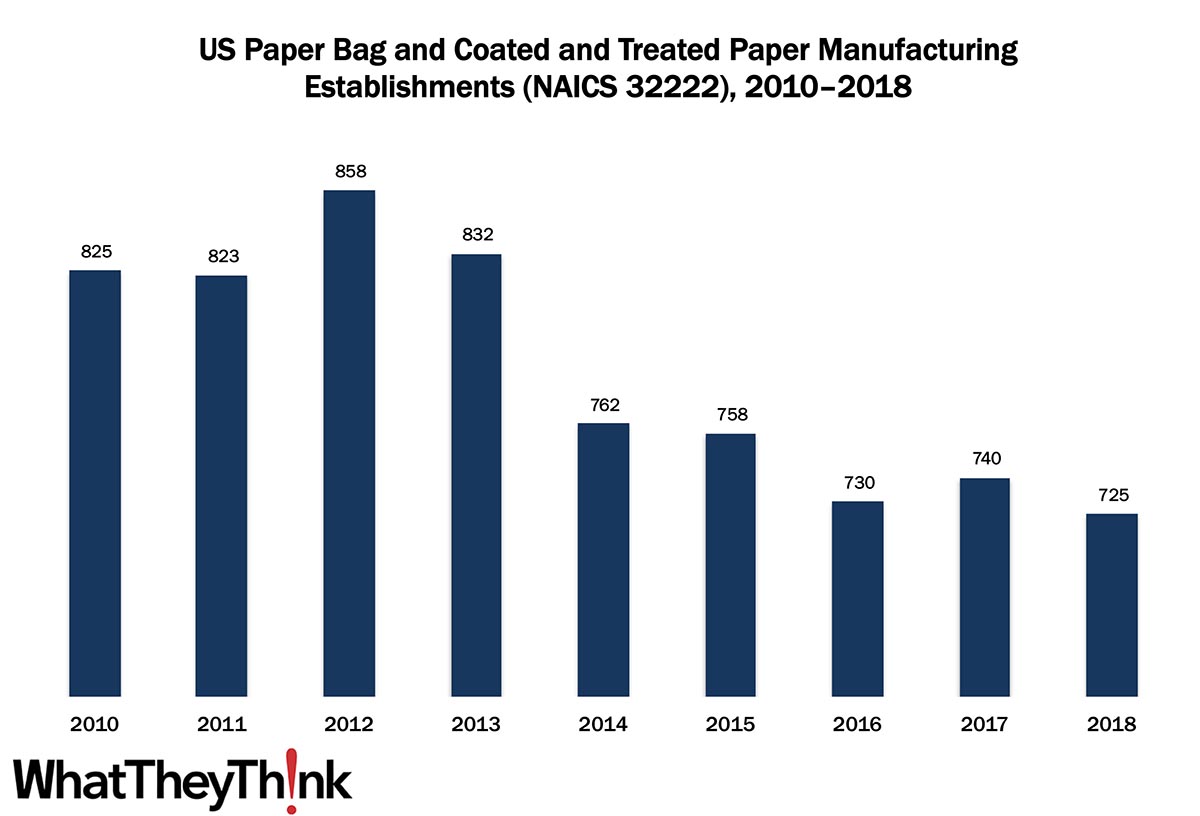
Paper Bag and Coated and Treated Paper Manufacturing Establishments—2010–2018
Published: November 20, 2020
In 2010, there were 825 establishments in NAICS 32222 (Paper Bag and Coated and Treated Paper Manufacturing). By 2018, that number had declined to 725, despite a spurt of growth in 2012. In macro news, initial unemployment claims were 742,000, an increase of 31,000 from the previous week's revised level. Full Analysis
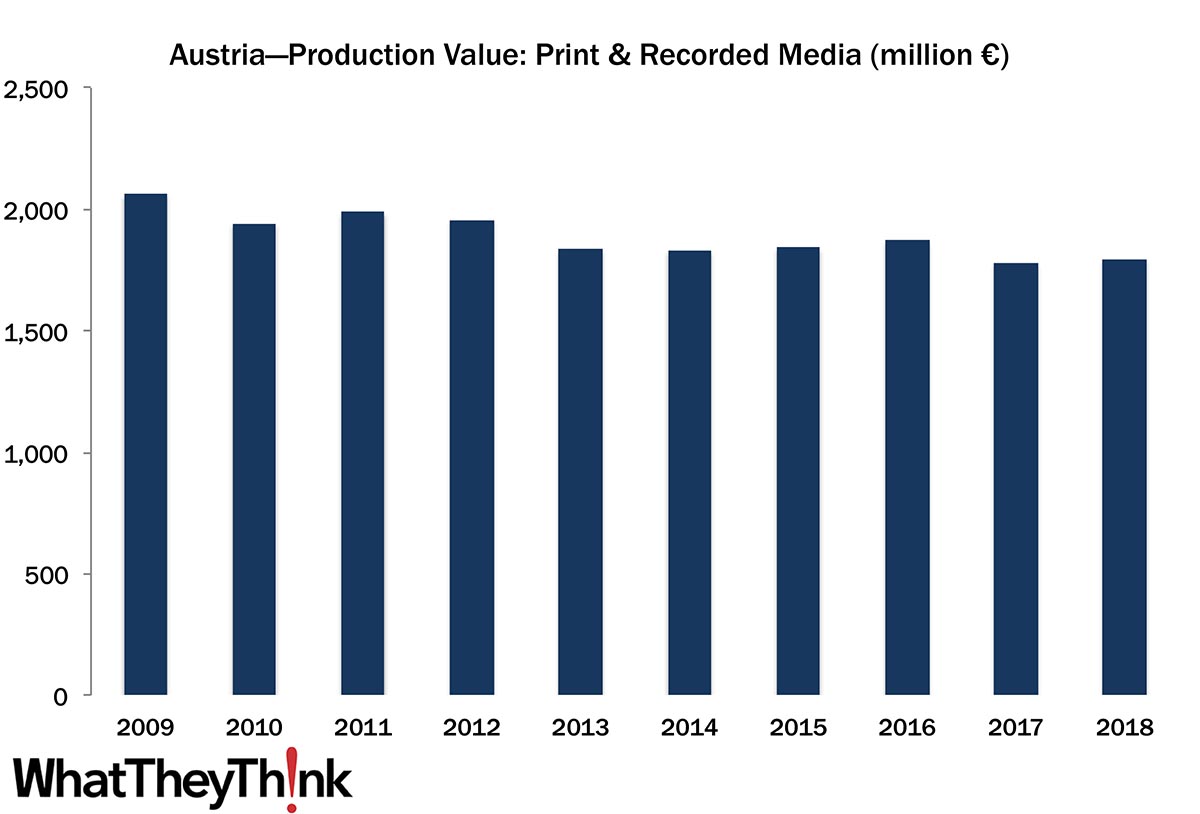
European Print Industry Snapshot: Austria
Published: November 17, 2020
In this bimonthly series, WhatTheyThink is presenting the state of the printing industry in different European countries based on the latest monthly production numbers. This week features a look at the printing industry in Austria. Full Analysis
Graphic Arts Employment—October 2020
Published: November 13, 2020
October 2020 employment figures are at least moving in the right direction from September, albeit slowly; overall printing employment in October was up +0.8% from September, with the gains predominantly in production staff continuing to come back. Let’s not look at year-over-year changes in graphic arts employment. Full Analysis
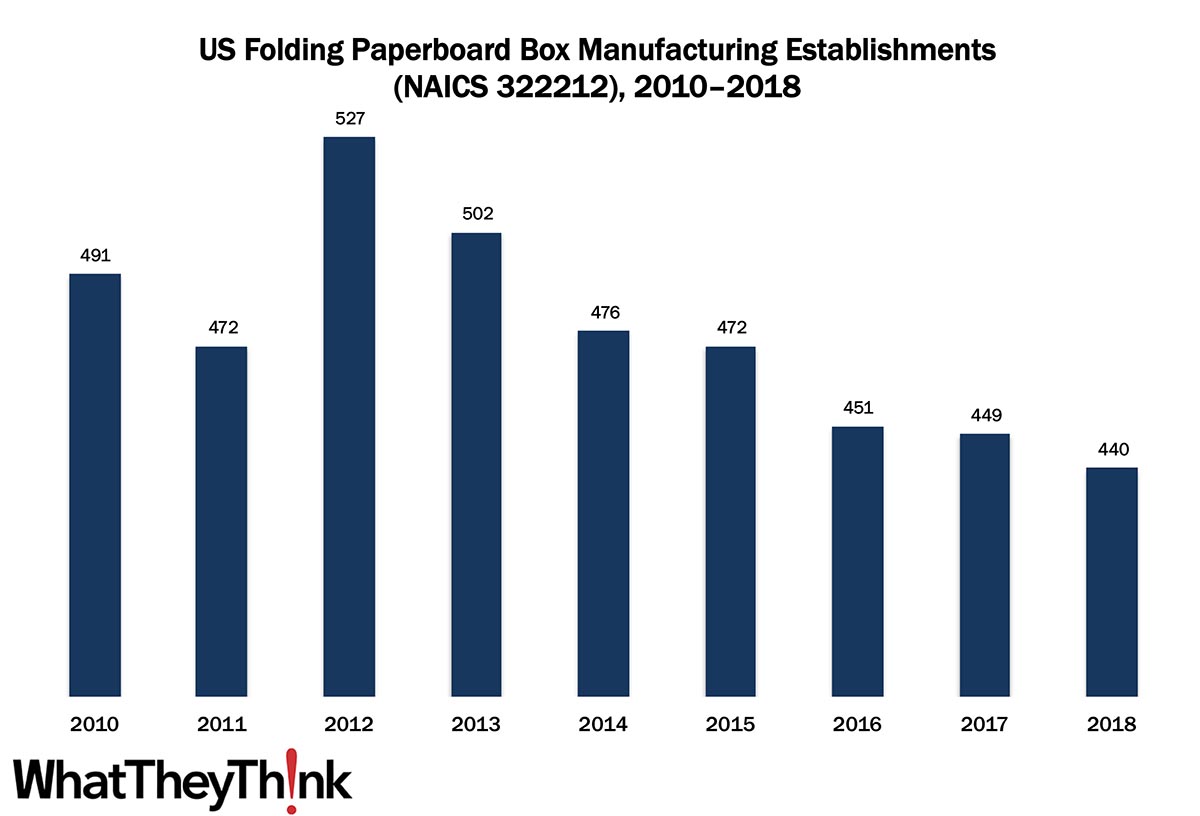
Folding Paperboard Box Manufacturing Establishments—2010–2018
Published: November 6, 2020
In 2010, there were 491 establishments in NAICS 322212 (Folding Paperboard Box Manufacturing). By 2018, that number had declined to 440, despite a spurt of post-recession growth. In macro news, the BEA’s advance estimate of 3Q GDP saw it increasing +33.1%—a climbing out of Q2’s -31.4% hole. Full Analysis
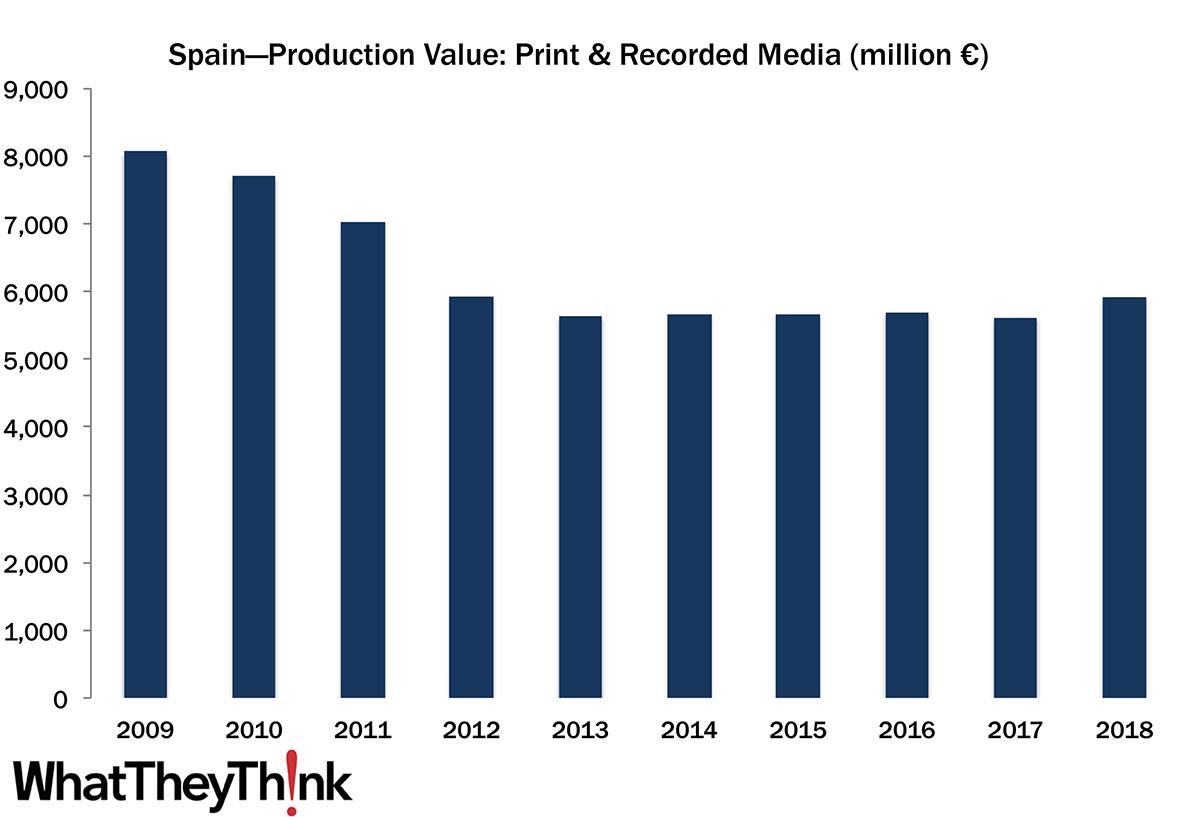
European Print Industry Snapshot: Spain
Published: November 3, 2020
In this bimonthly series, WhatTheyThink is presenting the state of the printing industry in different European countries based on the latest monthly production numbers. This week features a look at the printing industry in Spain. Full Analysis
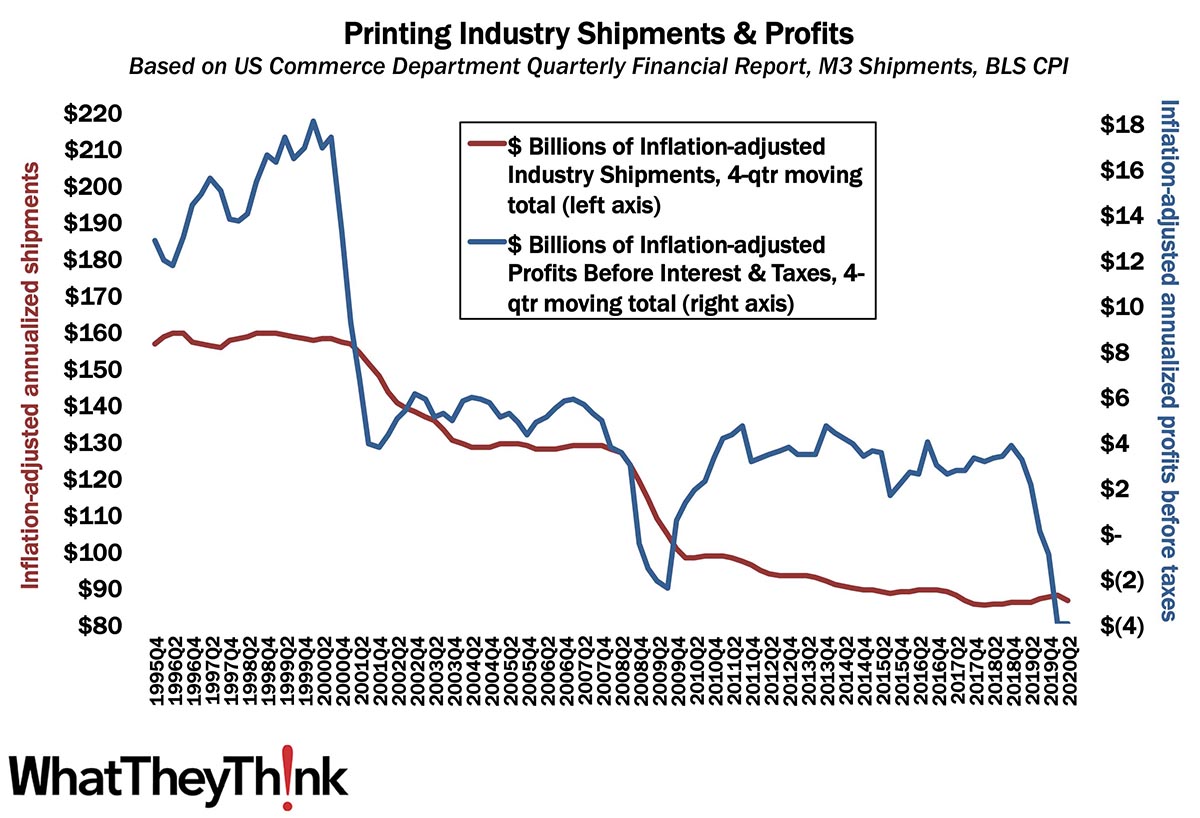
Q2 Profits Unchanged from Q1—But Still Bad
Published: October 30, 2020
Given the lag time in the release of quarterly profits, we have to time travel back to Q2, much as it pains us to do so, where we see that annualized profits for Q2 2020 stayed steady at -$4 billion. Full Analysis
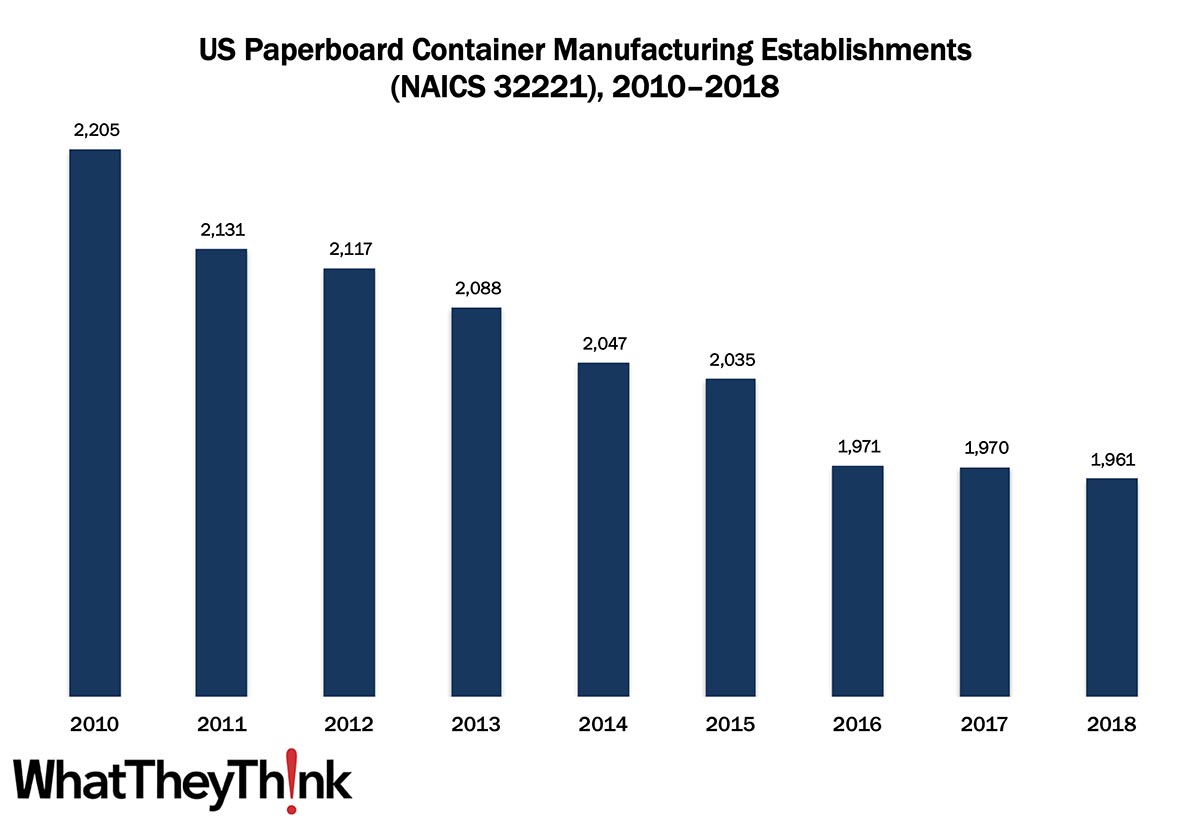
Paperboard Container Manufacturing Establishments—2010–2018
Published: October 23, 2020
In 2010, there were 2,205 establishments in NAICS 32221 (Paperboard Container Manufacturing). By 2018, that number had declined -11% to 1,961. In macro news, the American Institute of Architects’ Architecture Billings Index (ABI) score was up in September. This is a leading indicator for the economy in general, but also for the signage market in particular. Full Analysis
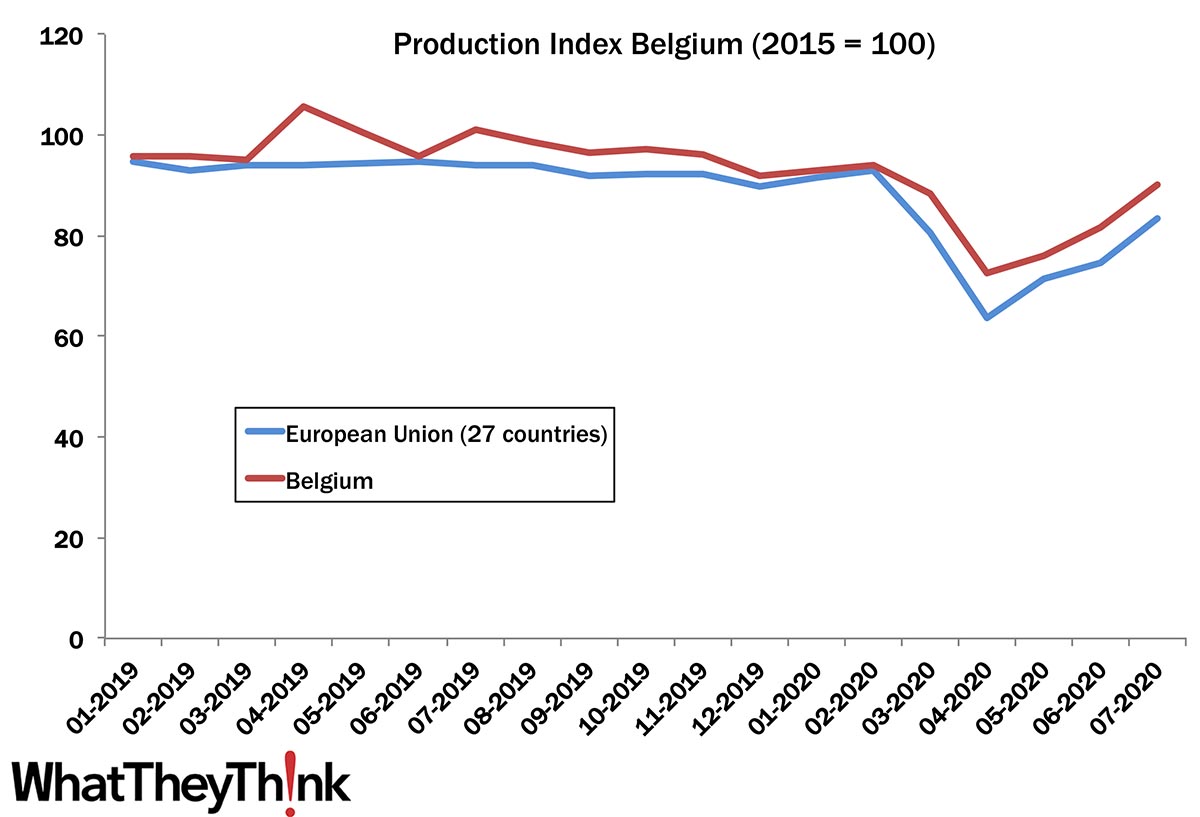
European Print Industry Snapshot: Belgium
Published: October 20, 2020
According to the Eurostat production index, the printing industry in Belgium did fairly well in 2019 and even during the COVID-19 crisis in 2020, despite the country being hit hard by the virus. Although production volumes in 2019 were down compared to 2015, Belgium did better than the European Union average in the production index for printing and recorded media. Full Analysis
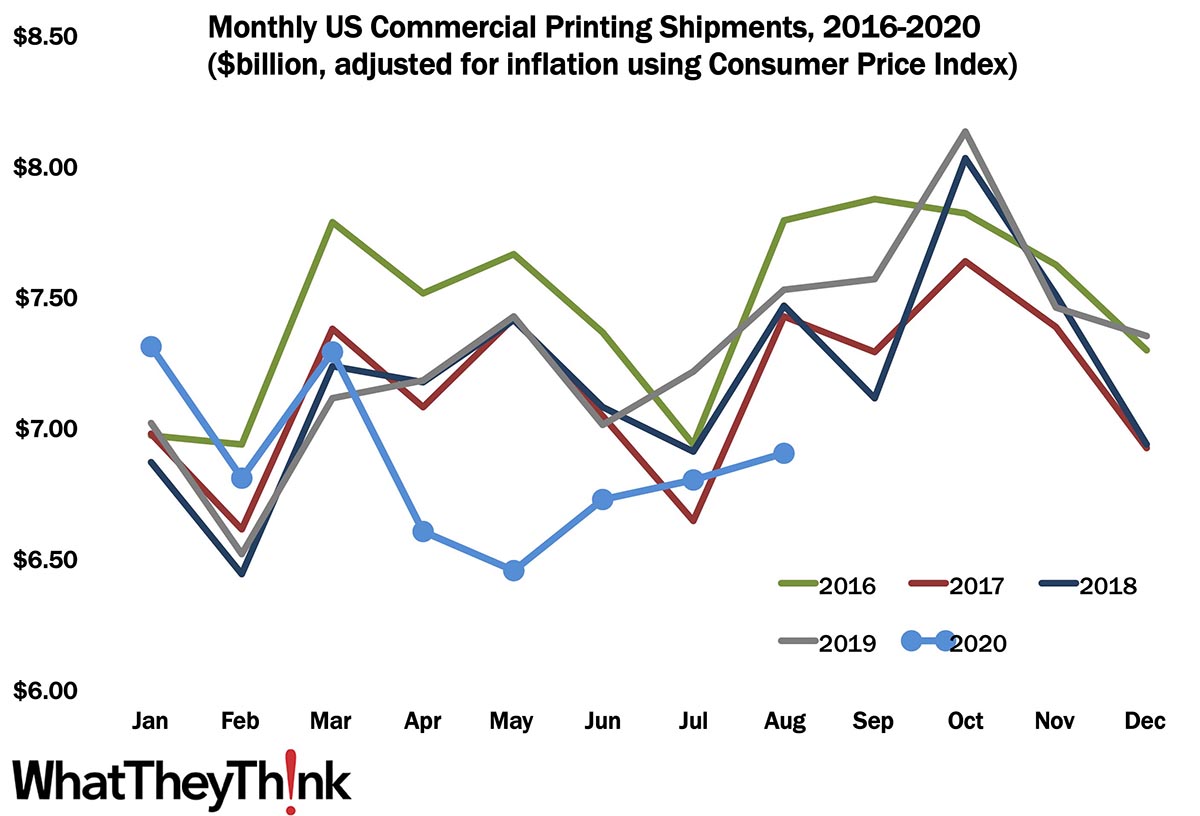
August Printing Shipments—The Rebound Continues
Published: October 16, 2020
In August 2020, printing shipments rose to $6.90 billion—the third straight month of increasing shipments—and while it’s still well below August 2019’s $7.52 billion, given where we came from, that ain’t bad. Full Analysis
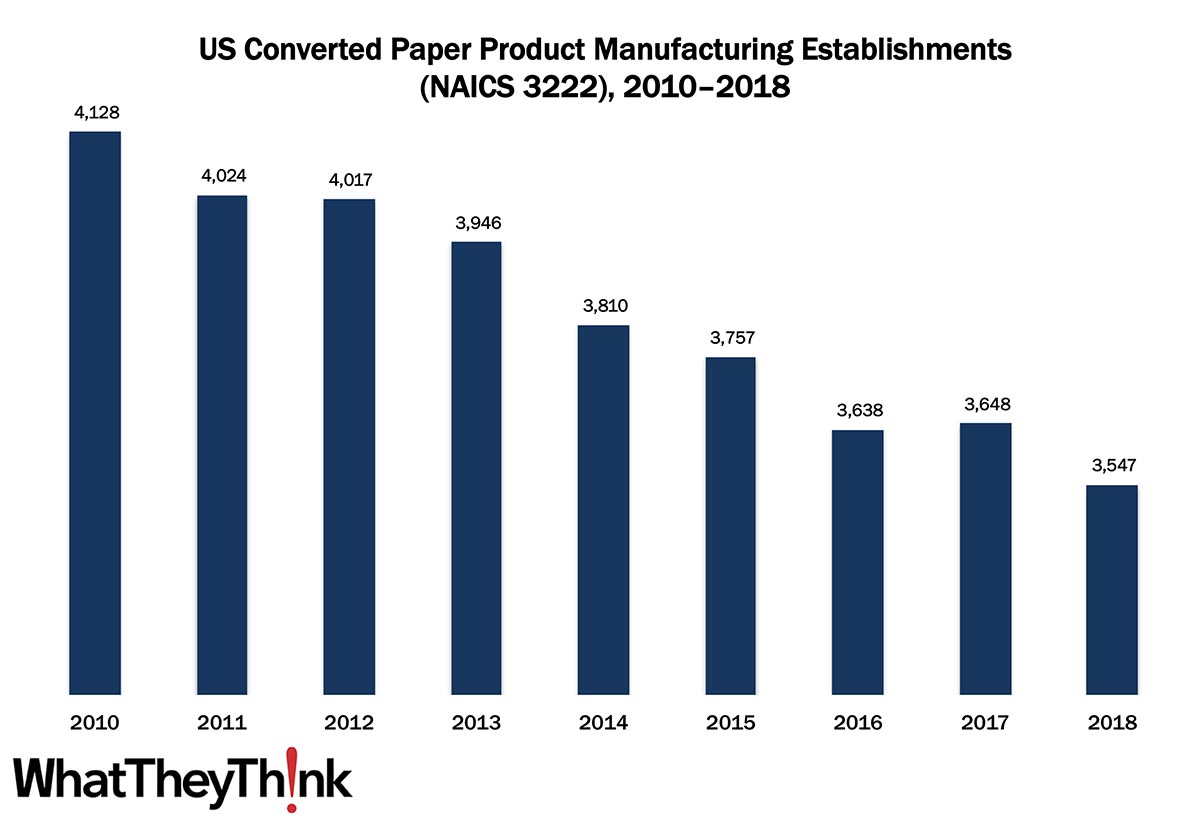
Converted Paper Product Manufacturing Establishments—2010–2018
Published: October 9, 2020
In 2010, there were 4,128 establishments in NAICS 3222 (Converted Paper Product Manufacturing). By 2018, that number had declined -12% to 3,547. In macro news, the unemployment rate drops, but not entirely for the right reasons. Full Analysis
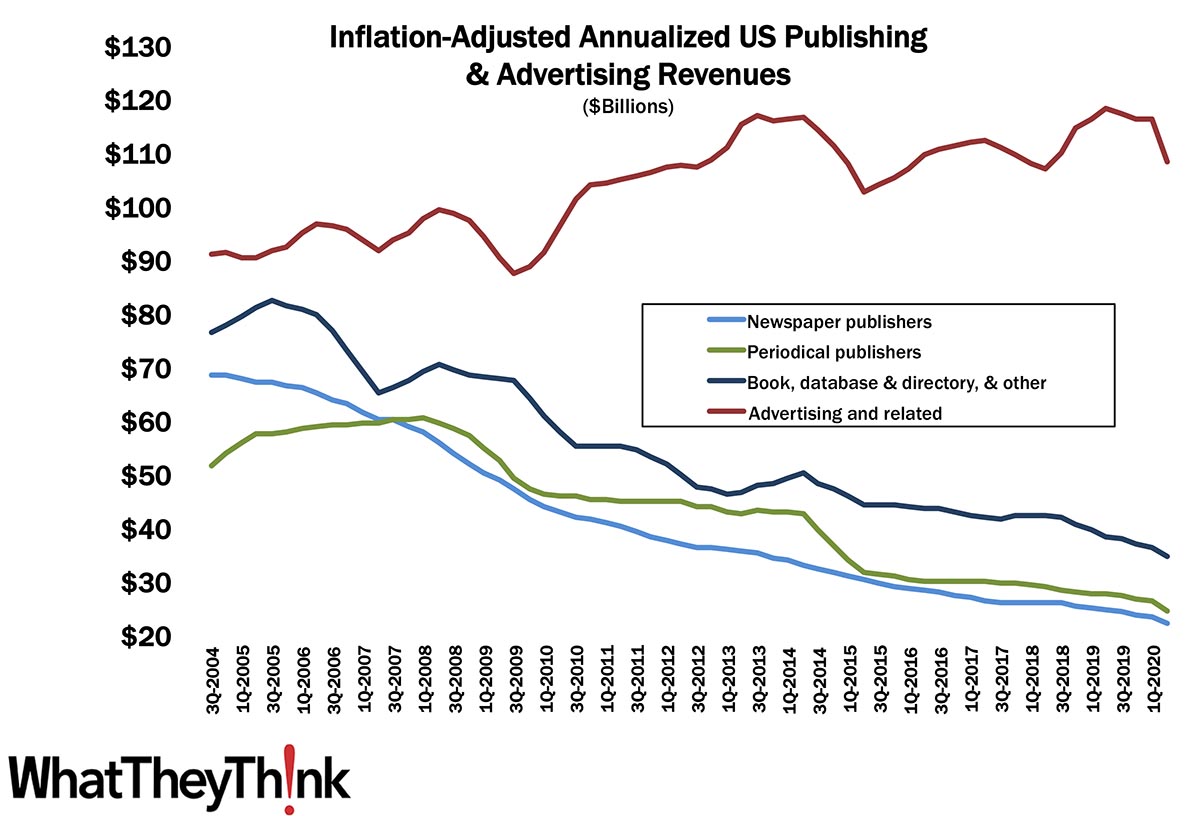
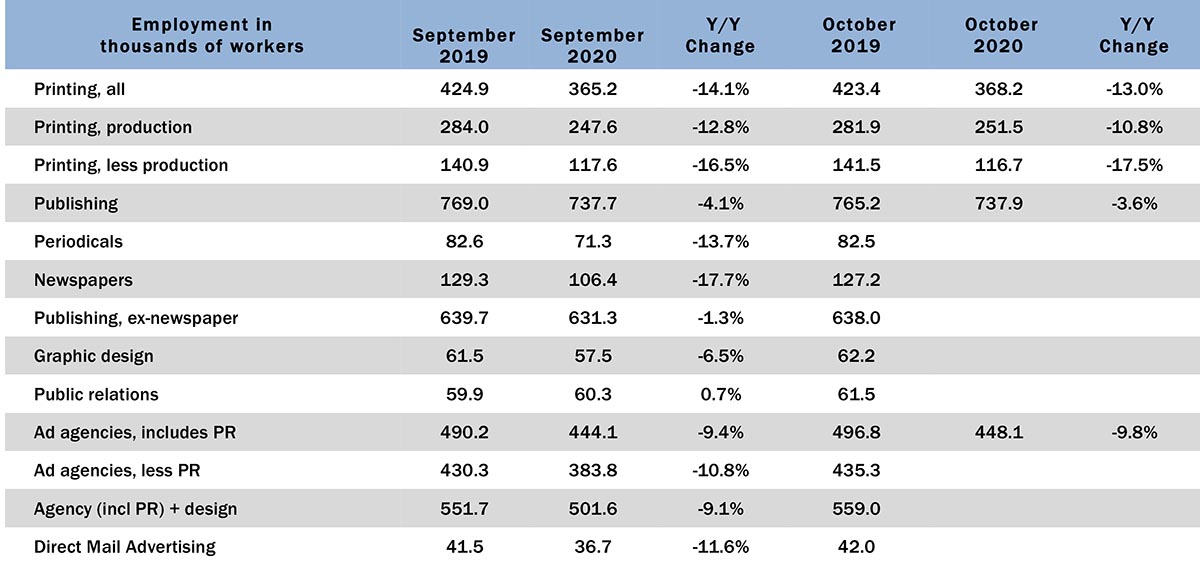
Q2 Publishing and Advertising Revenues
Published: October 2, 2020
From Q1 to Q2, book, periodical, and newspaper publishers, as well as advertising and related markets, saw quarterly revenues drop, some quite abruptly. For some of these markets, the pandemic only accelerated trends that had been long-ongoing. Full Analysis
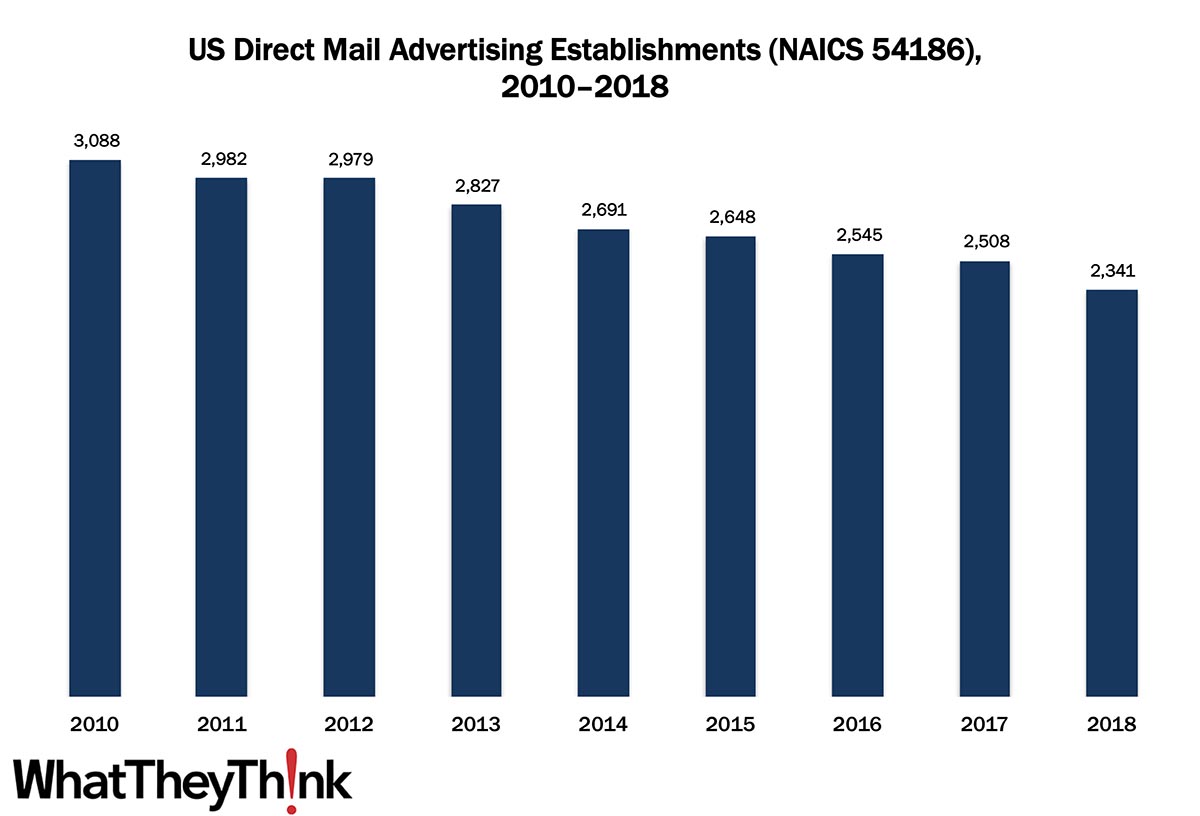
Direct Mail Advertising—2010–2018
Published: September 25, 2020
In 2010, there were 3,088 establishments in NAICS 54186 (Direct Mail Advertising). By 2018, the number of these establishments had dropped to 2,341. In macro news: initial unemployment claims rise again. Full Analysis
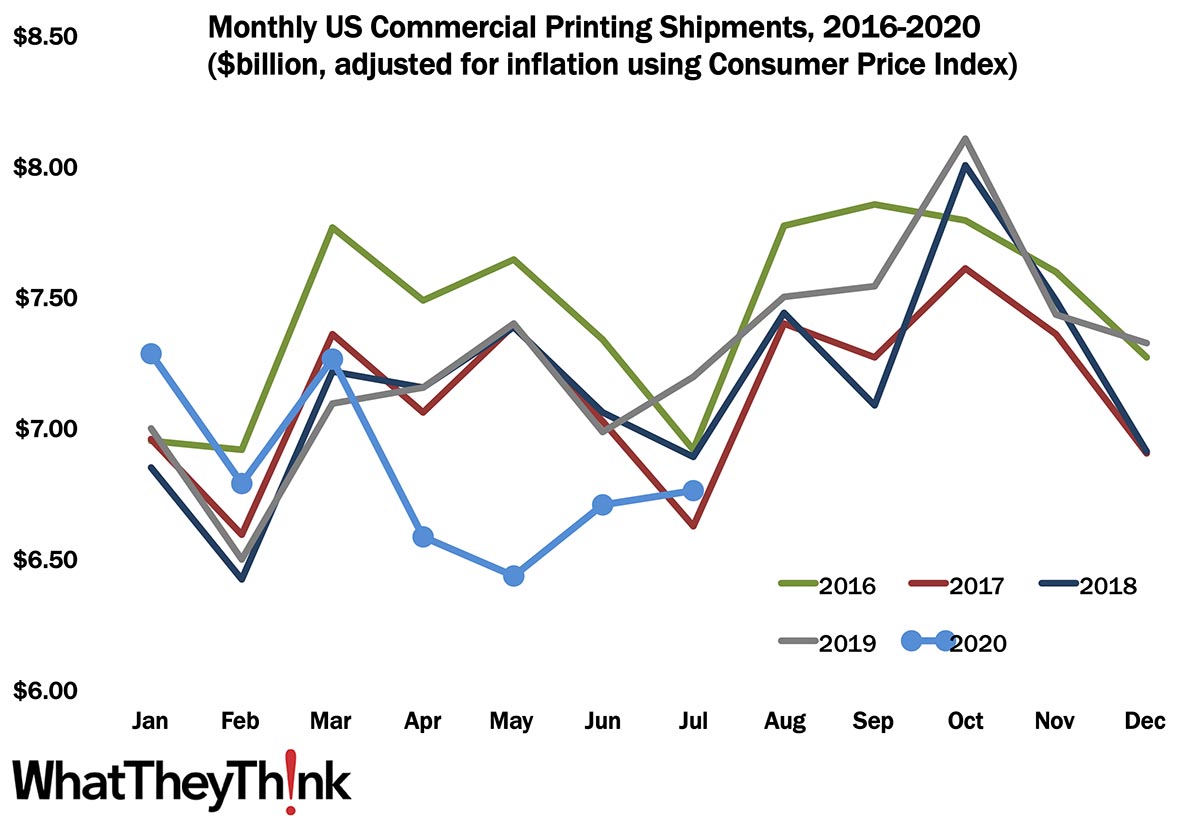
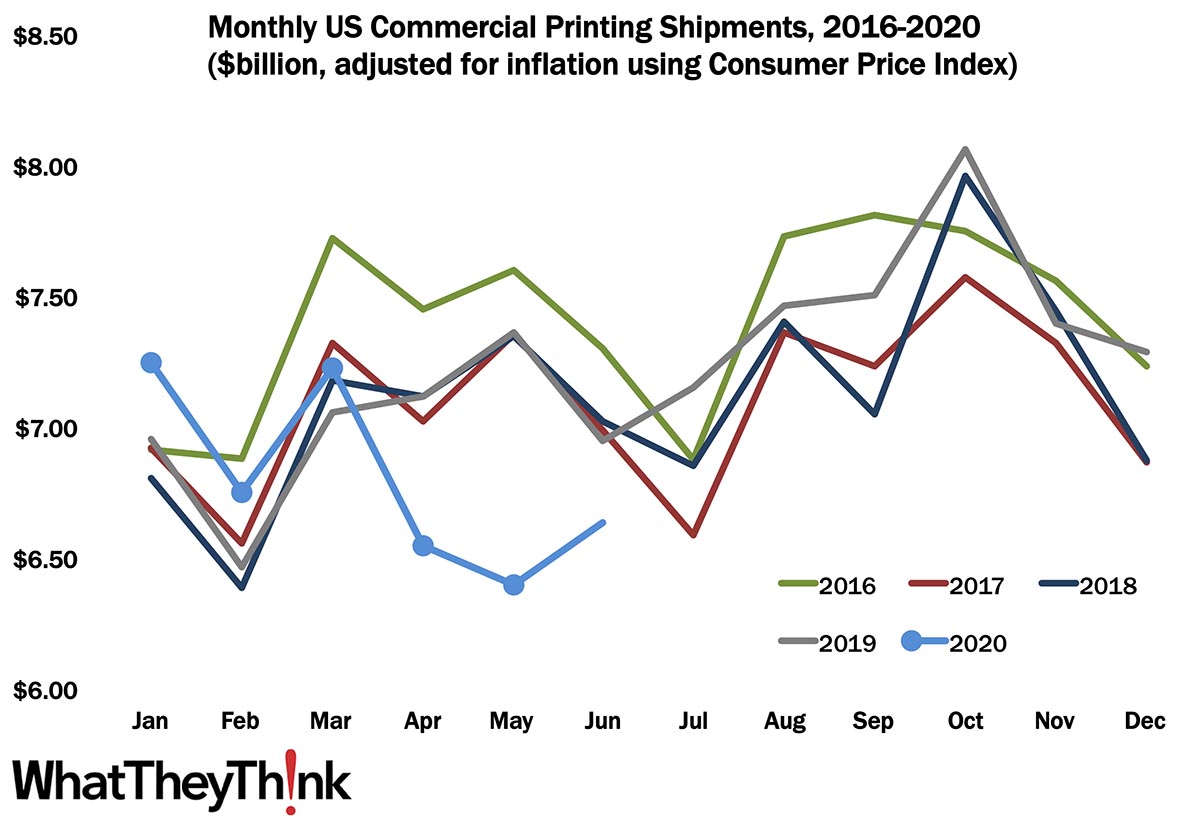
Printing Shipments: Summer’s Almost Gone
Published: September 18, 2020
Printing shipments continued to rebound in July, coming in at $6.75 billion, up from June’s $6.63 billion. We remain hopeful, but as we have been seeing lately, we are far from out of the woods virus-wise and we may see shipments start to decline again come the fall. Full Analysis
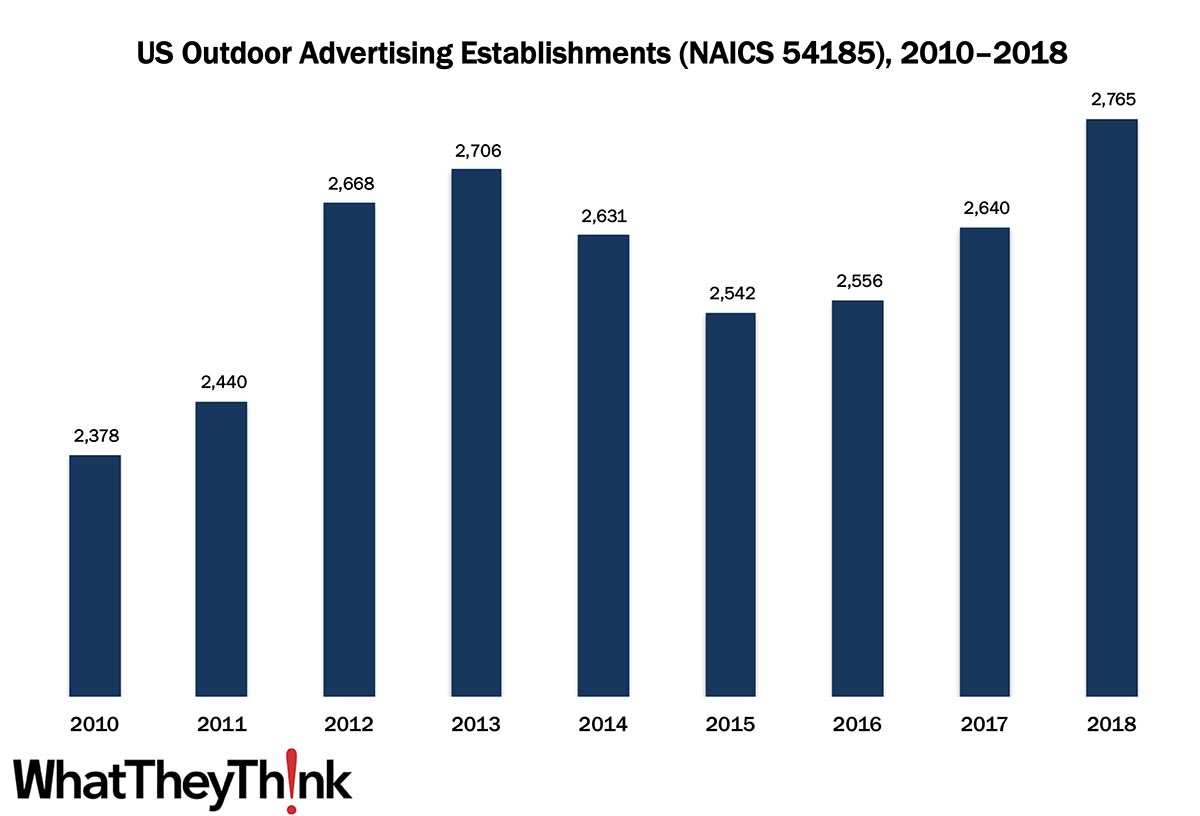
Outdoor Advertising—2010–2018
Published: September 11, 2020
In 2010, there were 2,378 establishments in NAICS 54185 (Outdoor Advertising, although until 2012 this category was referred to as “Display Advertising”). Establishments dipped in the mid-2010s, but hit a new peak in 2018 at 2,765 establishments. In macroeconomic news: unemployment is down, but unemployment claims data paint a dark picture. Full Analysis
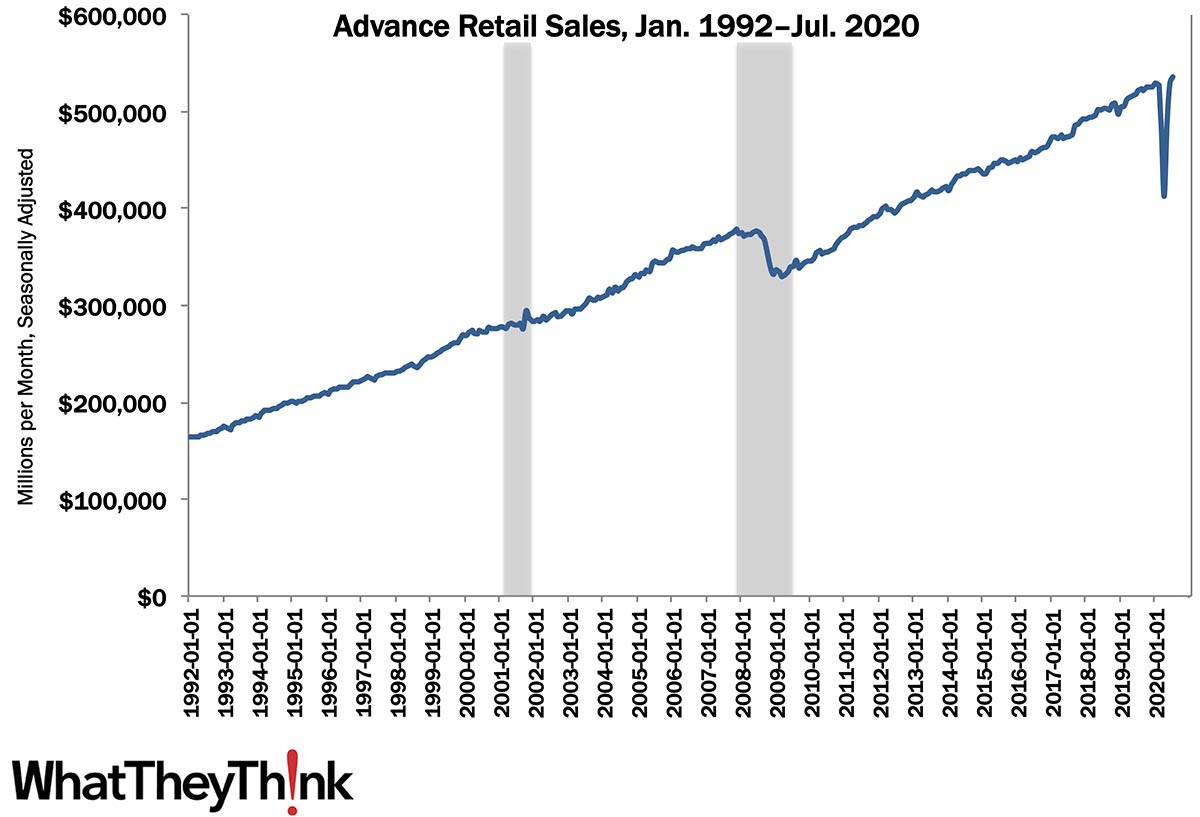
Retail Sales: A V-Shaped Recovery?
Published: September 4, 2020
The Census Bureau recently released its monthly report on retail sales, and after a dramatic plummeting, July retail sales were $536.0 billion, up 1.2% from June (seasonally adjusted), and 2.7% above July 2019. But this may paint a rosier picture of retail than is warranted. Full Analysis
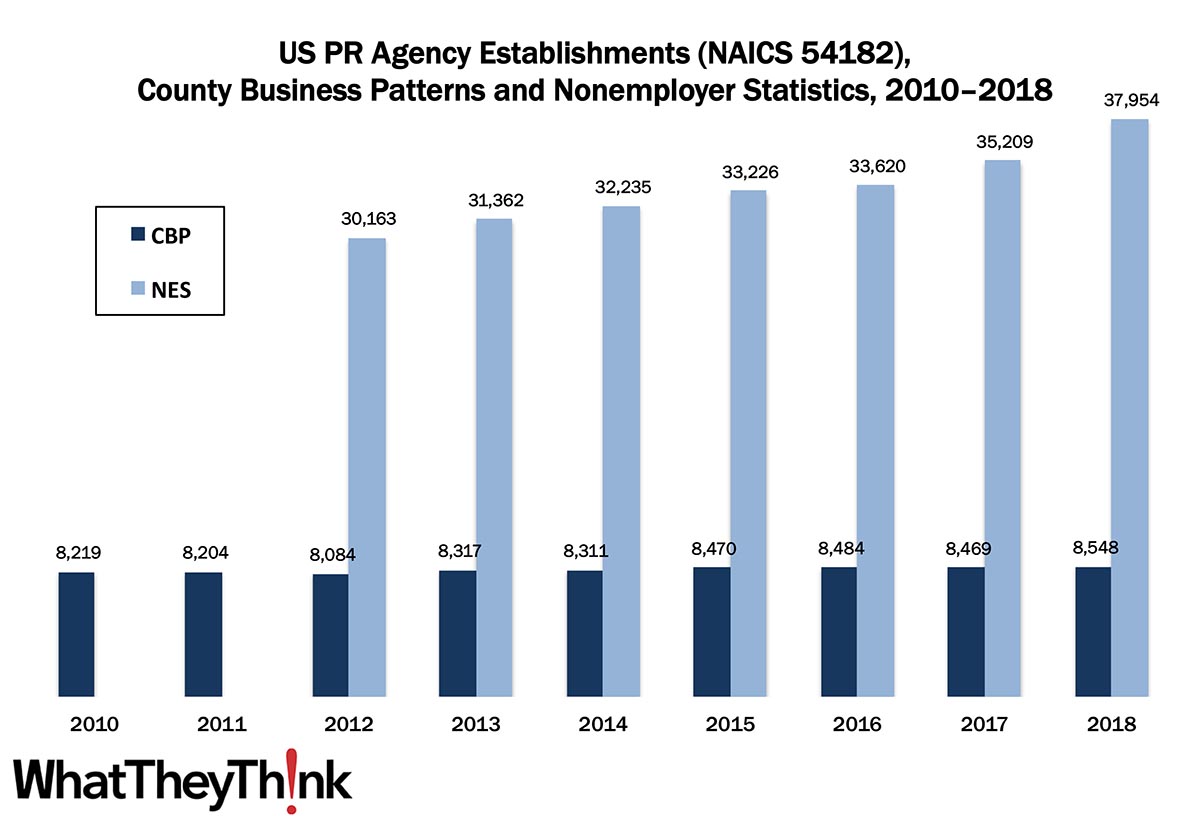
PR Agencies—2010–2018
Published: August 28, 2020
In 2010, there were 8,219 establishments in NAICS 54182 (Public Relations Agencies). After a slight contraction due to the Great Recession, PR agencies started to grow again, peaking at 8,548 establishments in 2018. In addition, we estimate there were an additional 37,954 freelance or sole proprietor PR agency establishments in 2018. In macro news: Q2 GDP revised up. Full Analysis
Printing Shipments On the Rebound: Will It Last?
Published: August 21, 2020
After a dismal April and May, printing shipments rebounded in June to $6.63 billion. It’s a hopeful sign, but the COVID-19 crisis is far from over. It’s going to be a tense fall. Full Analysis
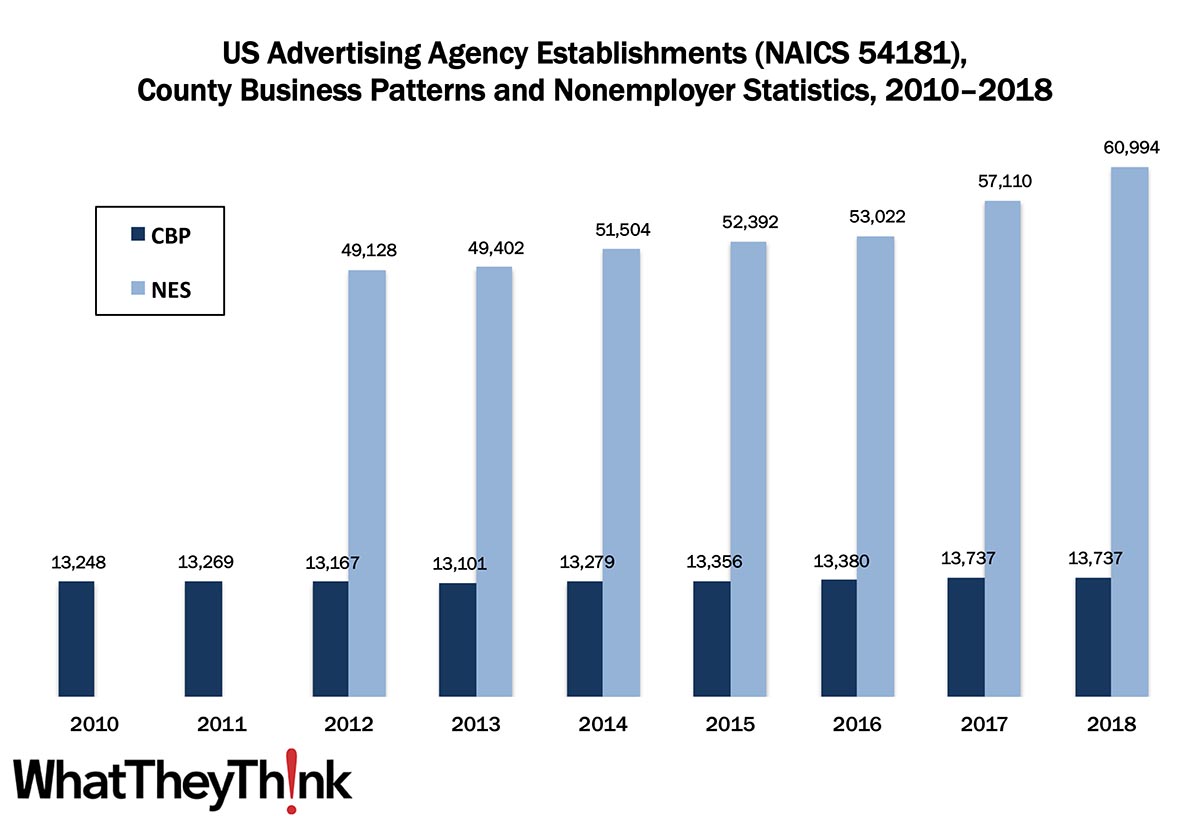
Advertising Agencies—2010–2018
Published: August 14, 2020
In 2010, there were 13,248 establishments in NAICS 54181 (Advertising Agencies). After a slight contraction due to the Great Recession, agencies started to grow again, peaking at 13,737 establishments in 2018. In addition, we estimate there were an additional 60,994 freelance or sole proprietor agency establishments in 2018. In macro news: initial unemployment claims dip below 1 million. Full Analysis
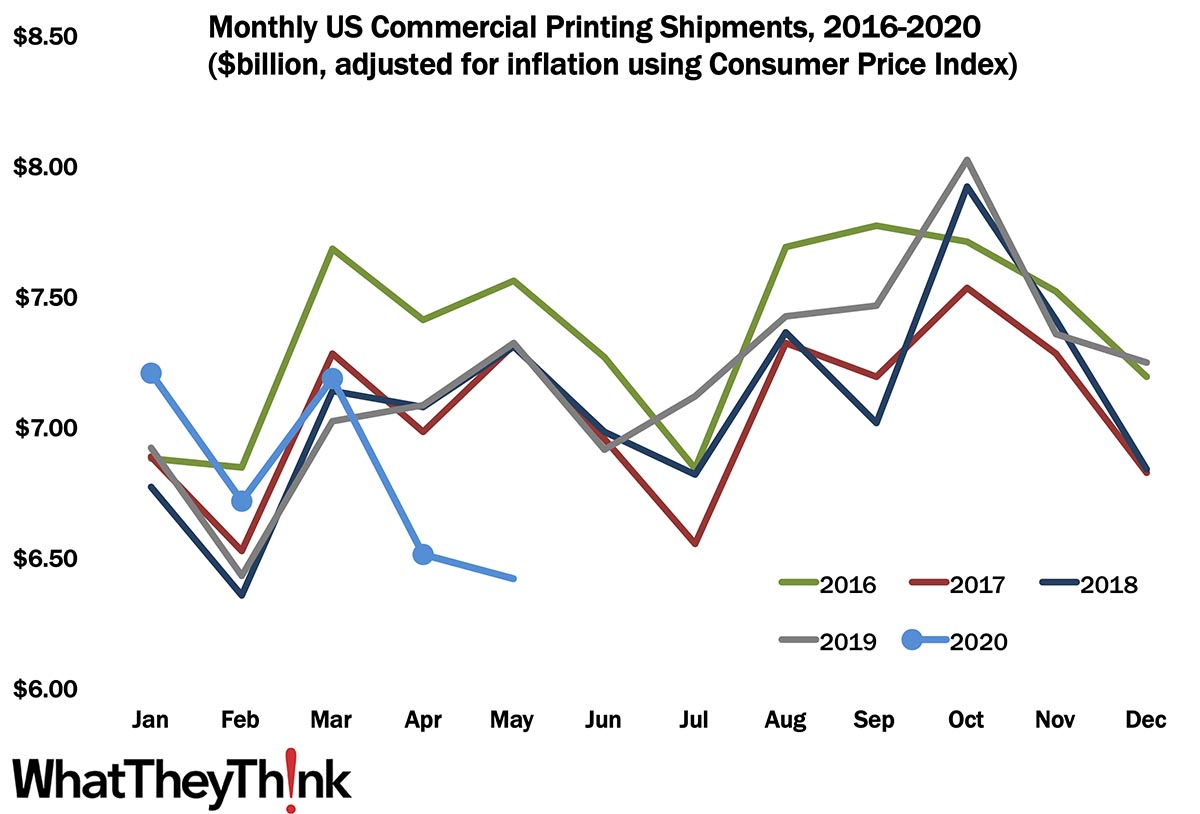
May Printing Shipments—Now It’s Serious
Published: August 7, 2020
Printing shipments for May 2020 came in at $6.42 billion, down from $6.51 in April and way down from $7.21 billion back in January. This may be as dire as shipments get, but we don’t expect to break $7 billion again for a long while. Full Analysis
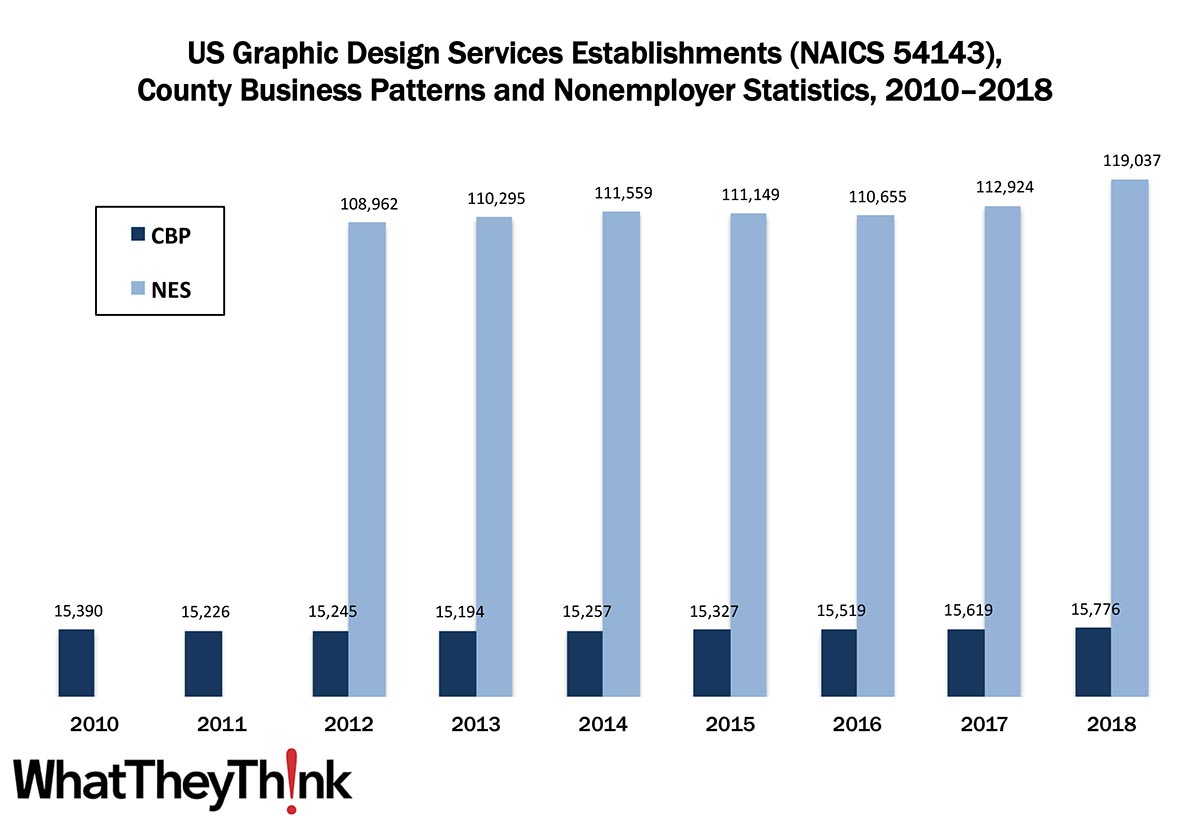
Graphic Design Services—2010–2018
Published: July 31, 2020
In 2010, there were 15,390 establishments in NAICS 54143 (Graphic Design Services). After something of a contraction due to the Great Recession, graphic design establishments started to grow again, peaking at 15,776 establishments in 2018. In addition, we estimate there were an additional 119,037 freelance graphic design establishments in 2018. In macro news: GDP falls off the cliff. Full Analysis
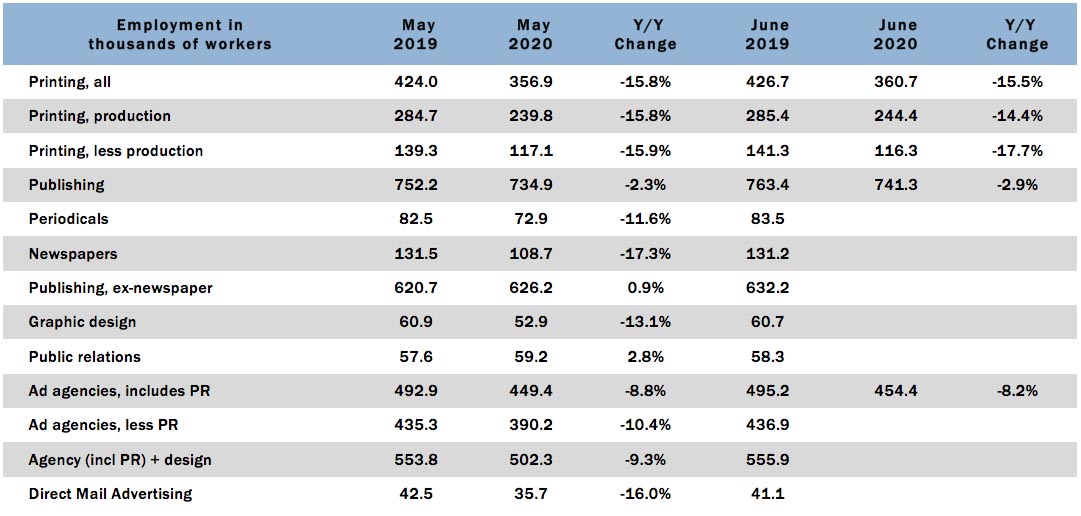
Graphic Arts Employment—June 2020
Published: July 24, 2020
As the song goes, “getting better all the time (can’t get any worse)”: in June 2020, overall printing employment is up +1.1% from May, although down -15.5% from June 2019. So a lot of the April damage is continuing to reverse itself. Full Analysis
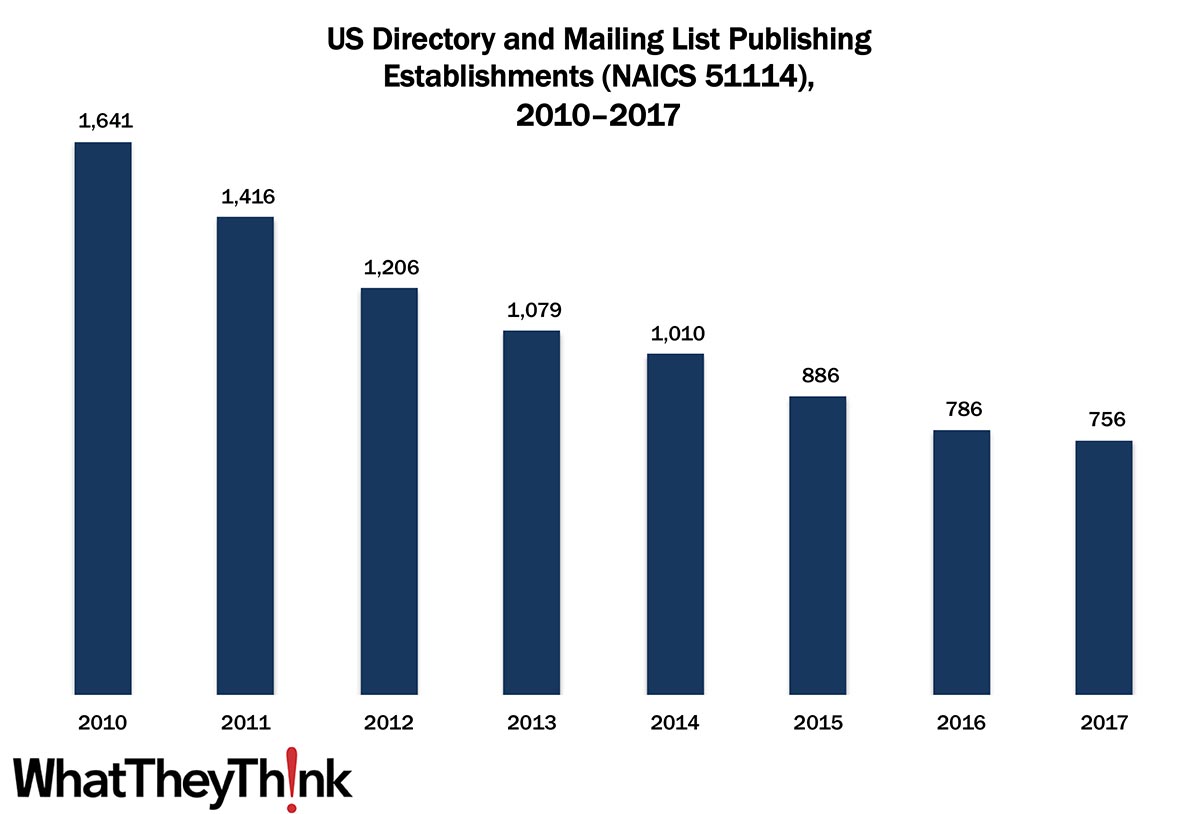
Directory and Mailing List Publishing Establishments—2010–2017
Published: July 17, 2020
In 2010, there were 1,641 US directory and mailing list publishing establishments; by 2017, that number had plummeted to 756. Full Analysis
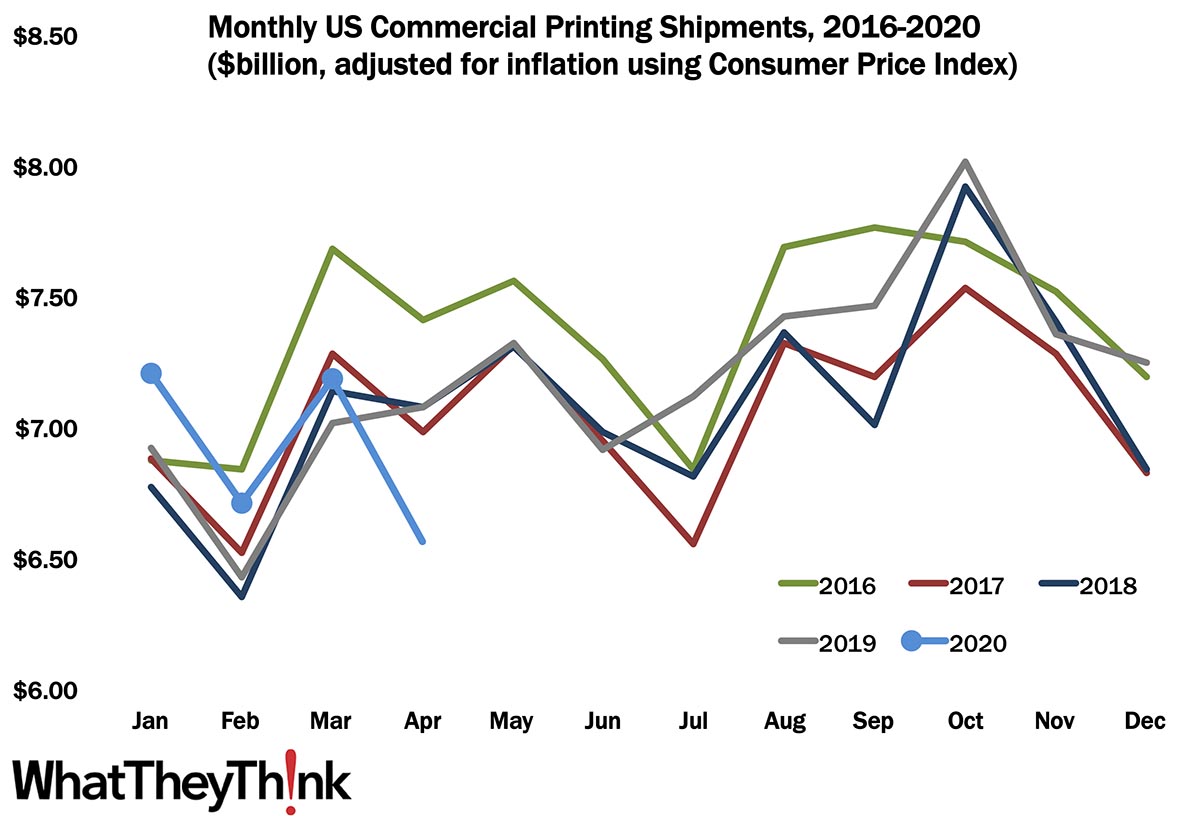
April Printing Shipments—Here We Go
Published: July 10, 2020
As we expected, April 2020 printing shipments took a tumble—falling from $7.18 billion in March down to $6.56 billion. Hmm...what could have caused that? Full Analysis
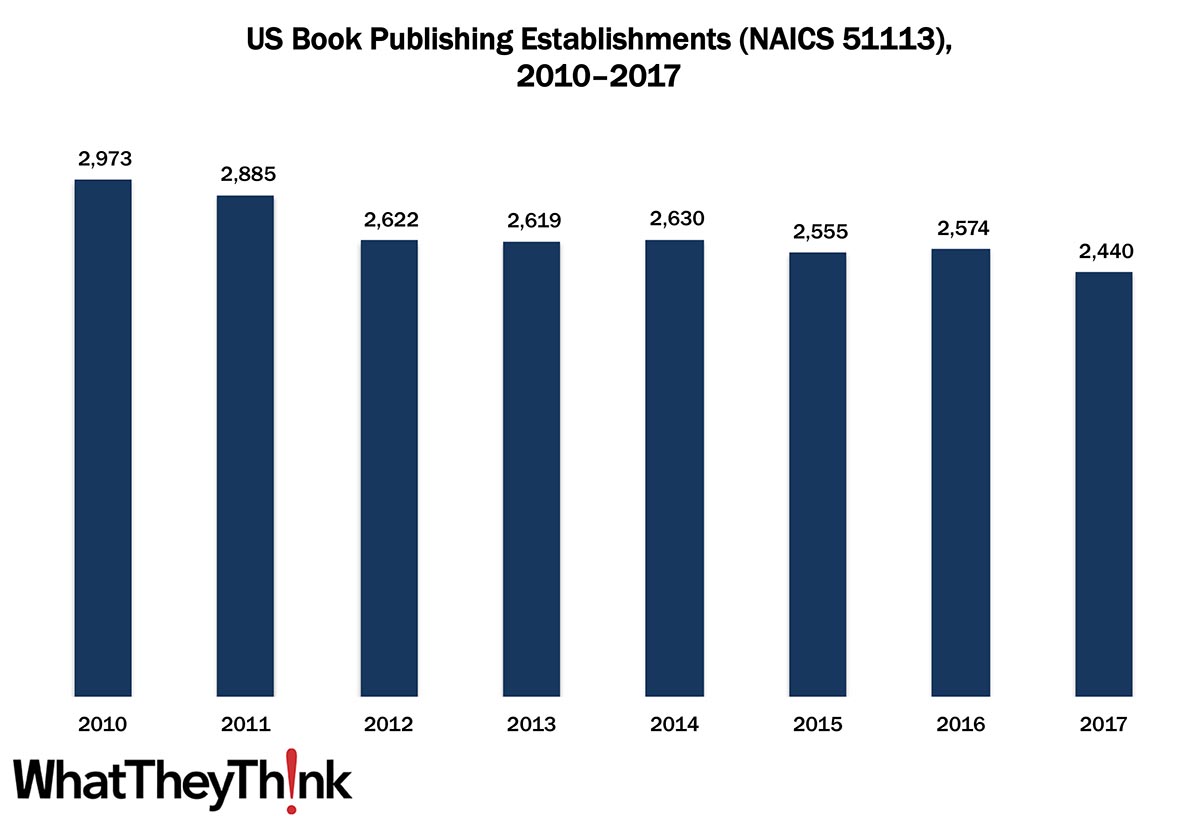
Book Publishing Establishments—2010–2017
Published: June 26, 2020
In 2010, there were 2,973 US book publishing establishments; by 2017, that number had dropped to 2,440. Book publishers are especially well-represented in Non-Employer Statistics. Full Analysis

A Tale of Two Cities: The Pandemic Years
Published: June 19, 2020
Annualized profits for Q1 2020 took a nosedive from $990 million to -$4 billion. Sure, the pandemic hit in the last three weeks of the quarter, but this is an old story that predates COVID. Full Analysis
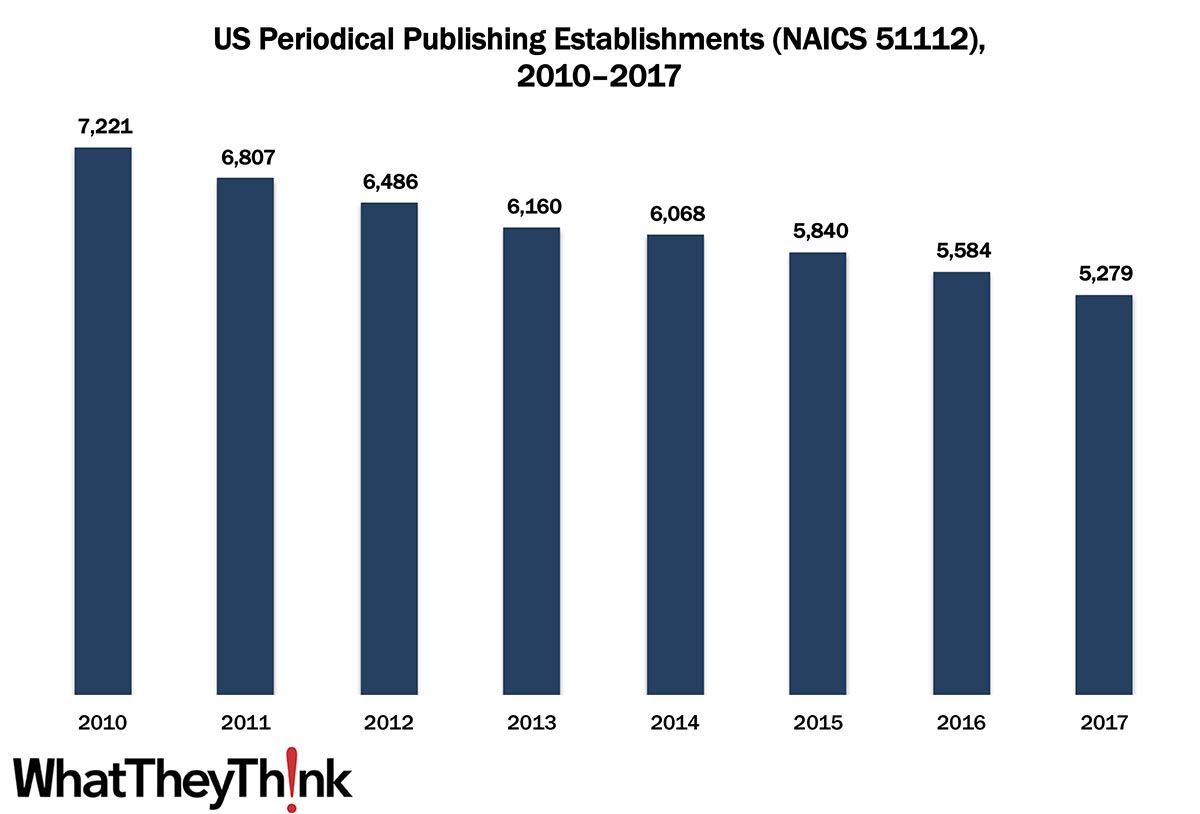
Periodical Publishing Establishments—2010–2017
Published: June 12, 2020
In 2010, there were 7,221 US periodical publishing establishments; by 2017, that number had dropped to 5,279. Magazines have been struggling in the Internet age, with closures and consolidations, but also have been seeing a shift in what constitutes “periodical publishing.” Also: we’re officially in a recession (surprise). Full Analysis
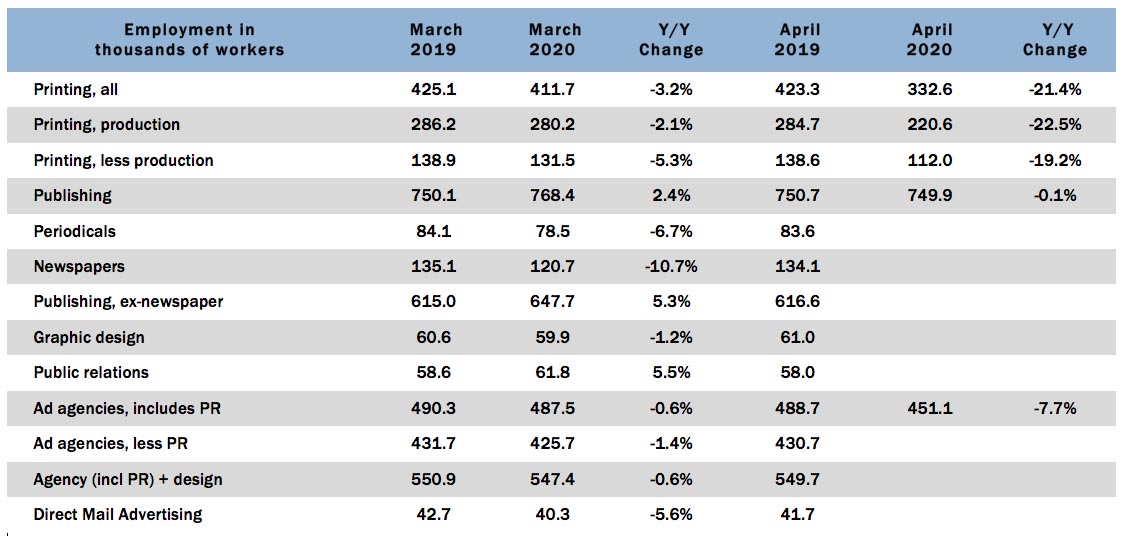
Graphic Arts Employment—April 2020
Published: June 5, 2020
Here we go: in April 2020, the overall printing employment was down -19.2% from March and down -21.4% from April 2019. We’ve been expecting this. Full Analysis
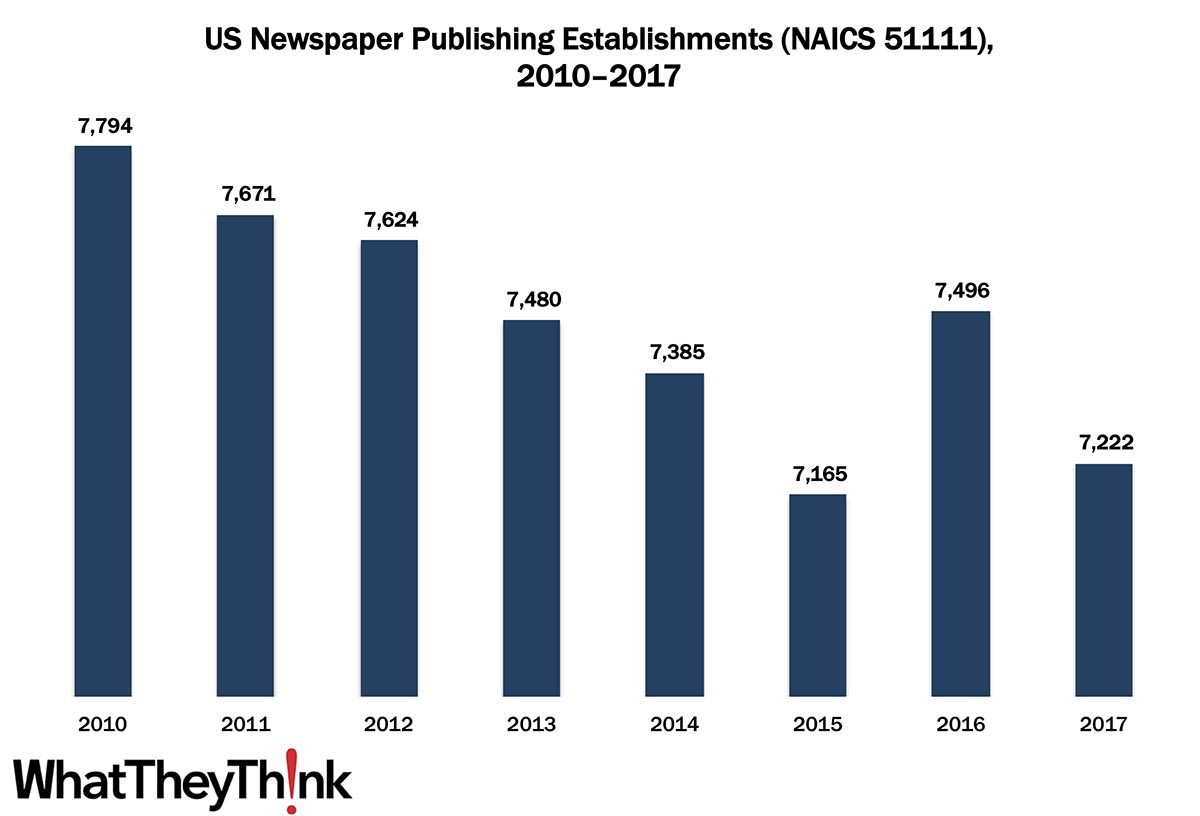
Newspaper Publishing Establishments—2010–2017
Published: May 29, 2020
In 2010, there were 7,794 US newspaper publishing establishments; by 2017, that number had dropped to 7,222. The newspaper industry’s woes have been well-documented, but the trouble started well before the Internet era. Also: Q1 GDP revised down. Full Analysis
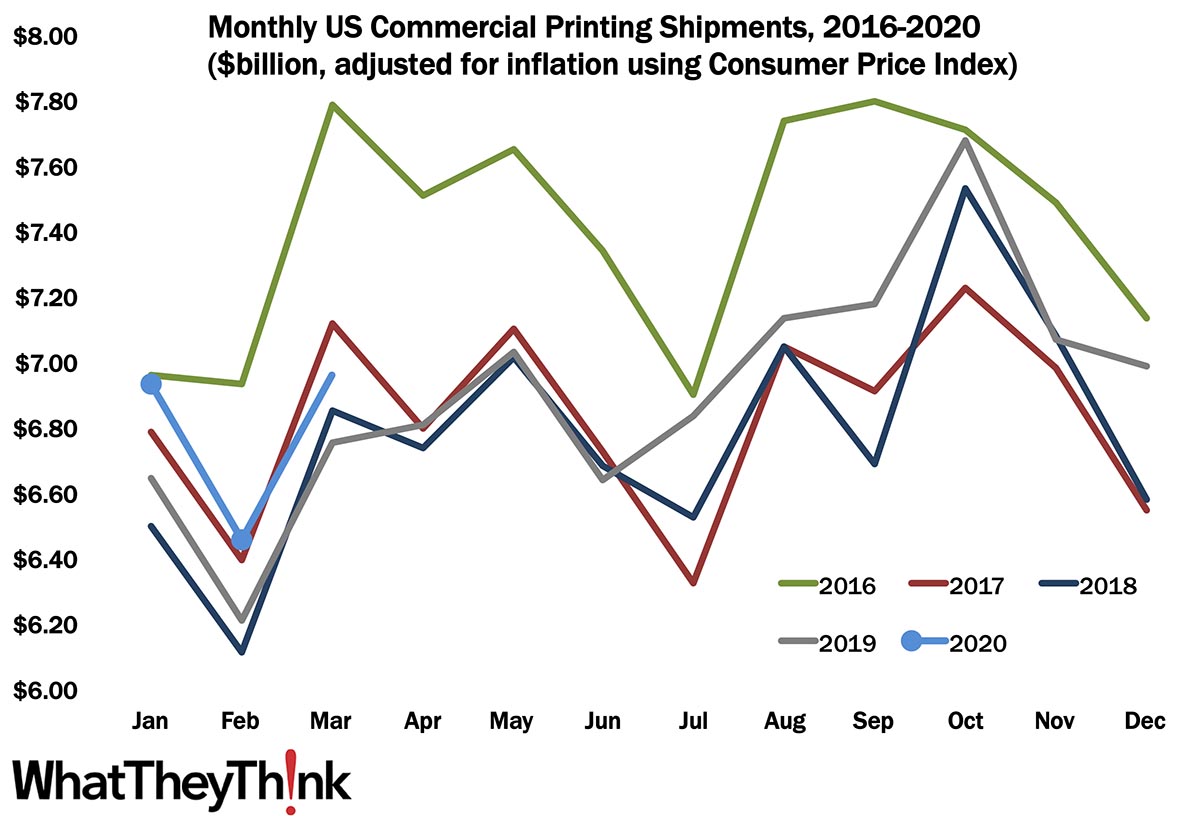
March Shipments—Crest of a Wave
Published: May 22, 2020
As we kind of expected, at $6.96 billion, March shipments were up from February’s $6.48 billion, and well enough above March 2019’s $6.75 billion. Full Analysis
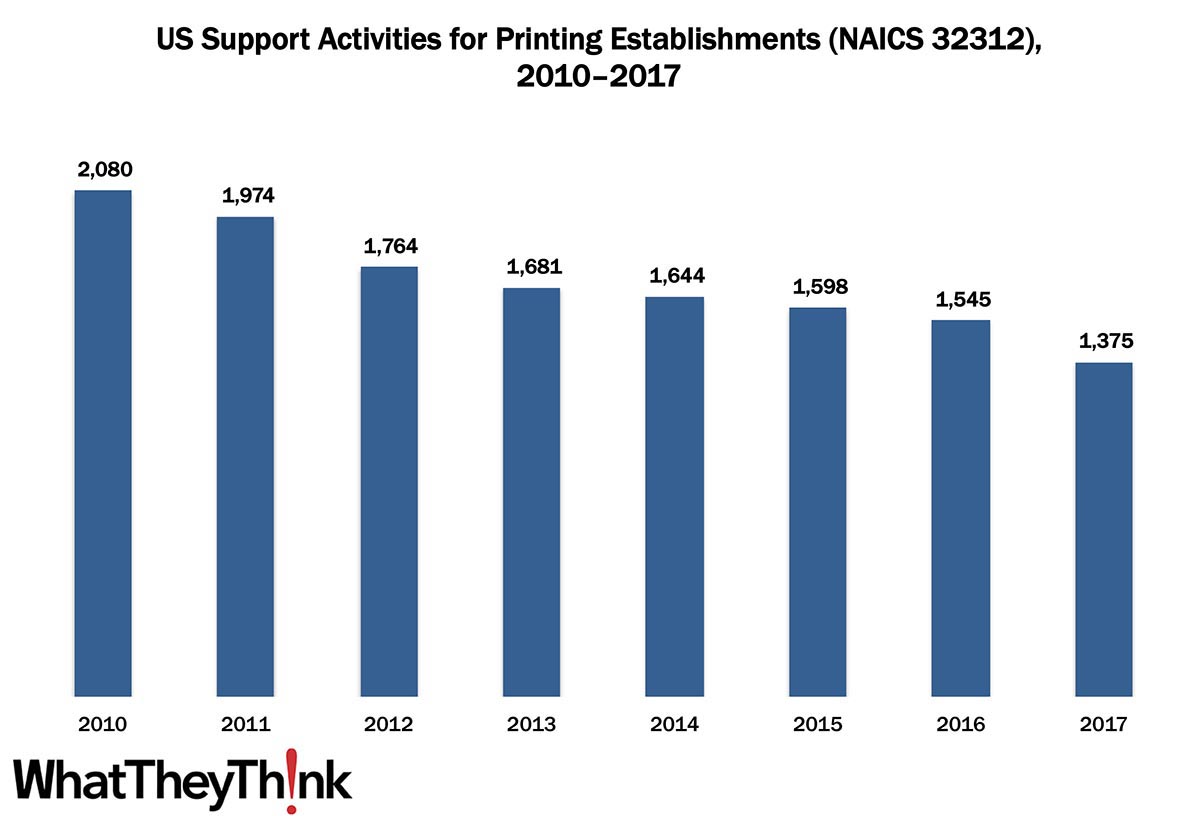
Prepress and Postpress Services Establishments—2010–2017
Published: May 15, 2020
In 2010, there were 2,080 establishments offering prepress and/or postpress services; by 2017, that number had dropped to 1,375. It’s not difficult to understand why the number of these establishments has been dropping: prepress is being absorbed into the printing process itself (especially in digital printing), and more print businesses are acquiring their own finishing capabilities. Full Analysis
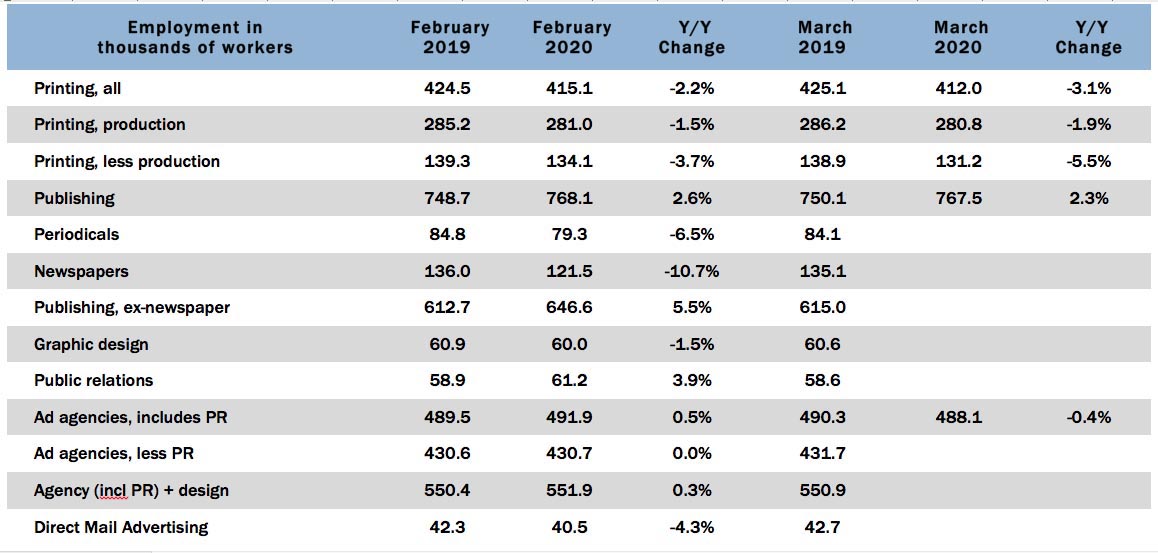
Graphic Arts Employment—March 2020
Published: May 8, 2020
Another of the Scenes from the Before Times: in March 2020, the overall printing employment was virtually unchanged from February (-0.7%) and on a year-over-year basis is down -3.1%. Obviously, this is the calm before the storm. Full Analysis
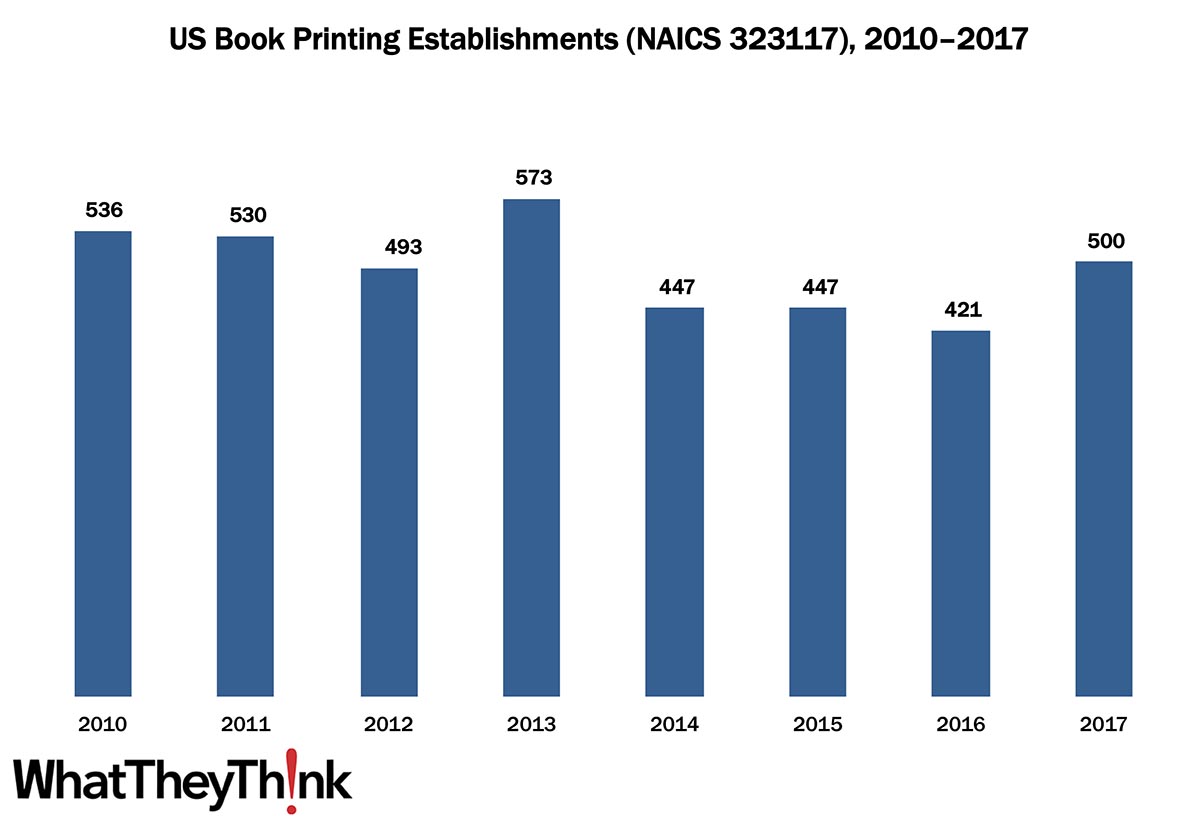
Book Printing Establishments—2010–2017
Published: May 1, 2020
According to the latest edition of County Business Patterns, in 2017 there were 500 establishments in NAICS 323117 (Book Printing Establishments). This represents an decline of -6.7% since the decade began. In other data news, the BEA released Q1 2020 GDP growth. Click on through, if you dare. Full Analysis
February Shipments: Tales from The Before Times
Published: April 24, 2020
At $6.48 billion, February shipments were down from January’s $6.94 billion, but well above February 2019’s $6.22 billion—and indeed was the best February we’ve had since 2016. Ah, well... Full Analysis
Printing Profits Plunged—Even Before the Crisis
Published: April 10, 2020
Annualized profits for Q4 2019 took a nosedive from $720 million to -$170 million in the latest chapter in our “tale of two cities” narrative, this time with the profitability gap between large and small printers narrowing. Full Analysis
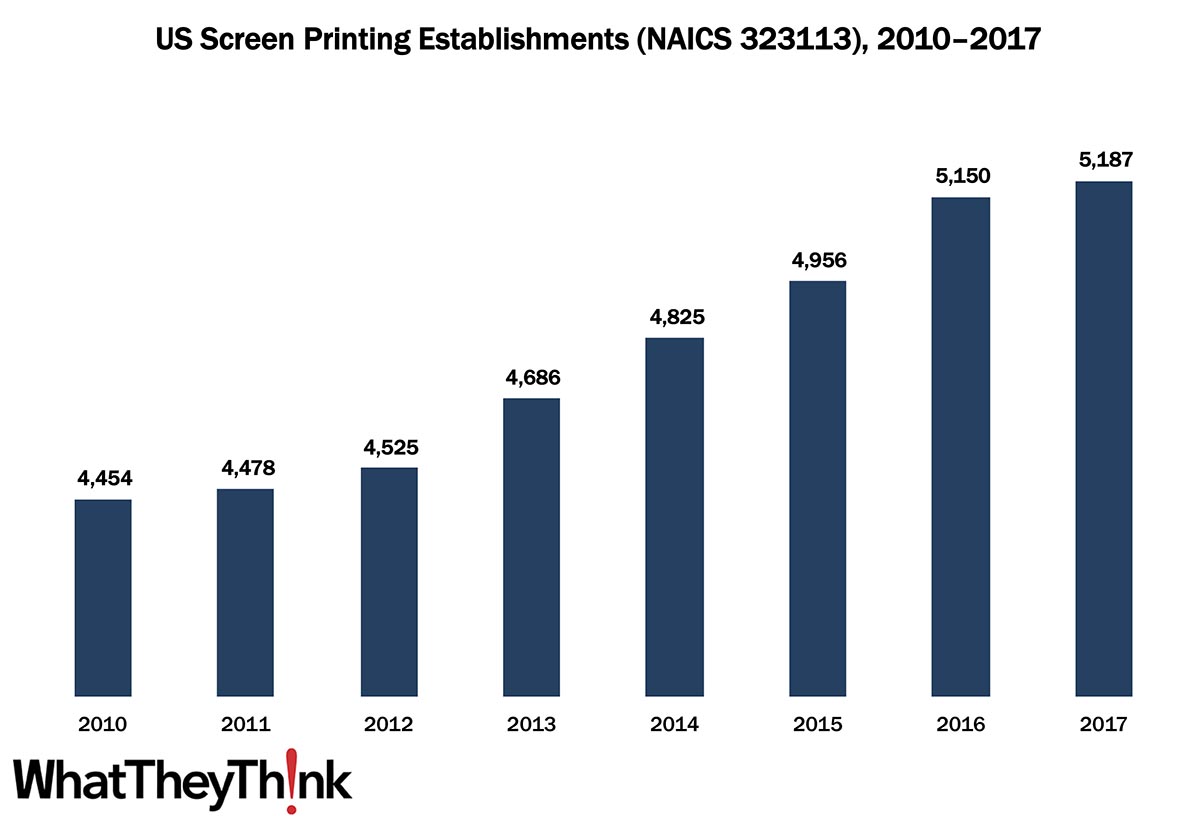
Screen Printing Establishments—2010–2017
Published: April 3, 2020
According to the latest edition of County Business Patterns, in 2017 there were 5,187 establishments in NAICS 323113 (Commercial Screen Printing). This represents an increase of +16% since the decade began. Full Analysis
January Shipments: Well, We Started Great
Published: March 27, 2020
At $6.94 billion, January shipments were down a little from December’s $6.98 billion, but that was just slightly lower than January 2016’s $6.95 billion—the best January we have had since then. But, elephant in the room... Full Analysis
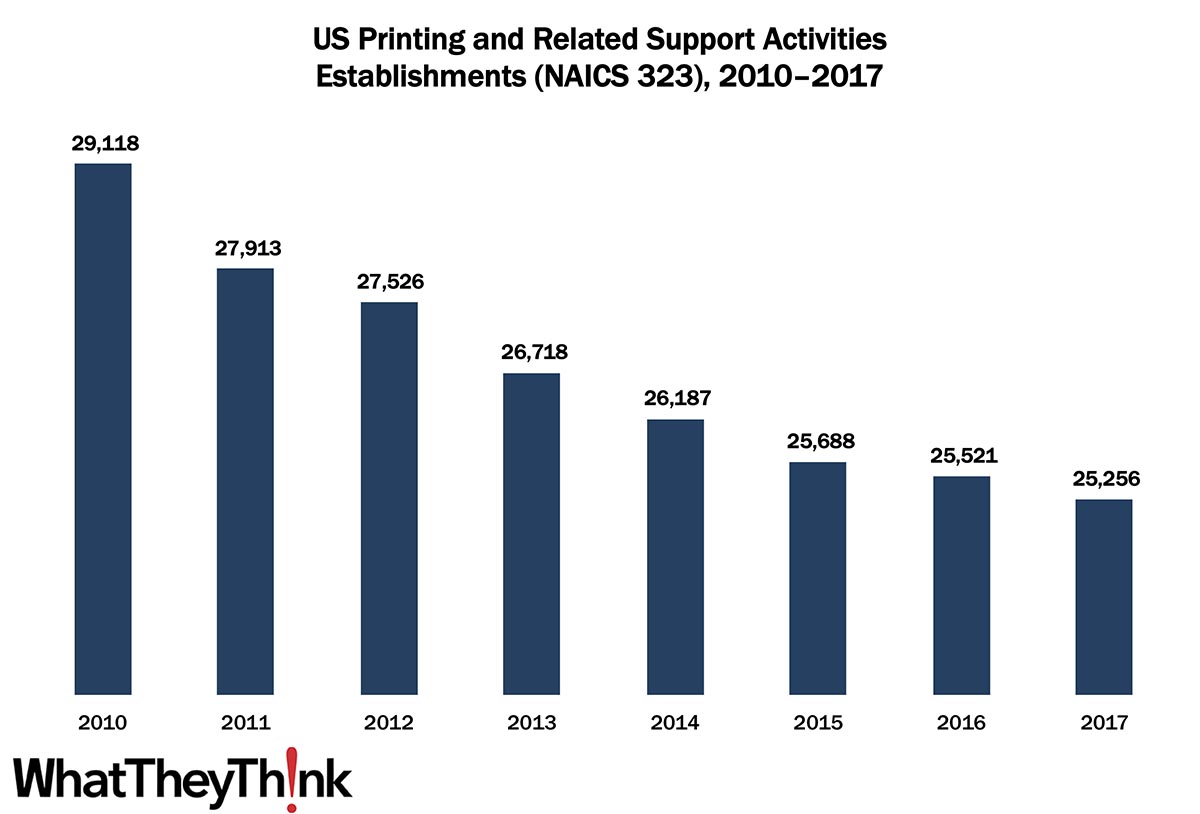
Printing Establishments—2010–2017
Published: March 20, 2020
According to the latest edition of County Business Patterns, in 2017 there were 25,256 establishments in NAICS 323 (Printing and Related Support Activities). This represents a decline of 13% since the decade began. Full Analysis
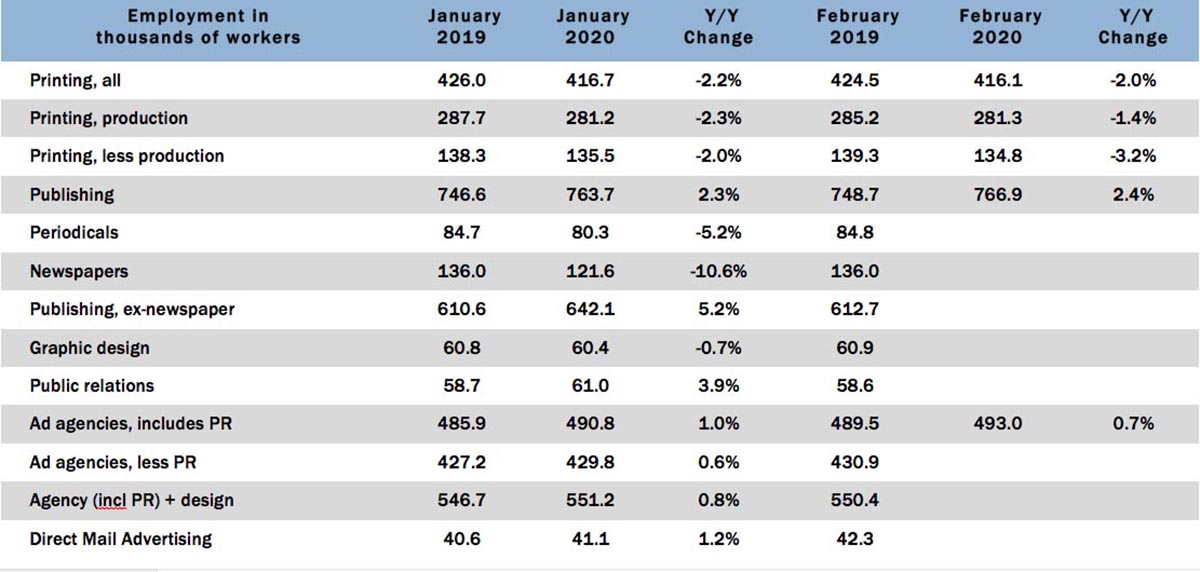
Graphic Arts Employment—February 2020
Published: March 13, 2020
In February 2020, overall printing employment was virtually unchanged from January (-0.1%) and on a year-over-year basis was down -2.0%. Interestingly, production employment was up, albeit infinitesimally. Full Analysis
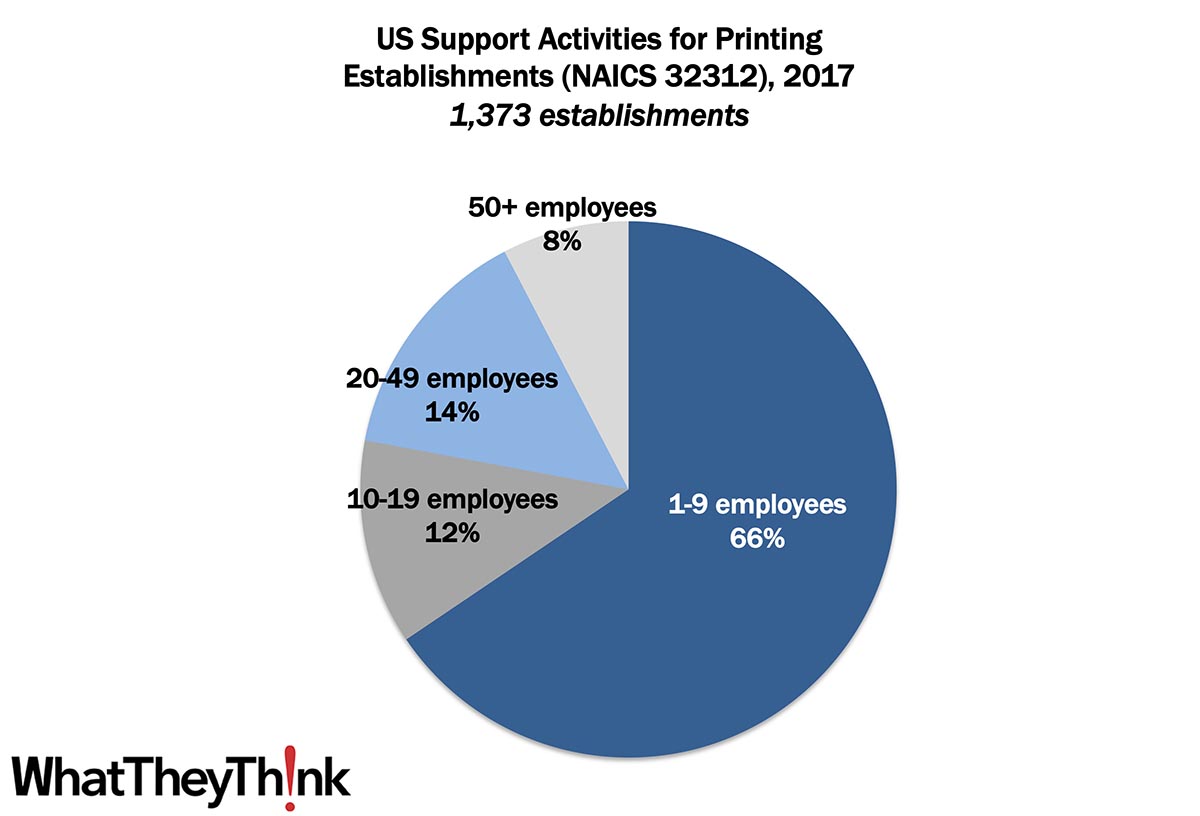
Prepress and Postpress Establishments—2017
Published: March 6, 2020
According to the latest edition of County Business Patterns, in 2017 there were 1,373 establishments in NAICS 32312 (Support Activities for Printing). The majority of these establishments (66%) had fewer than 10 employees. Full Analysis
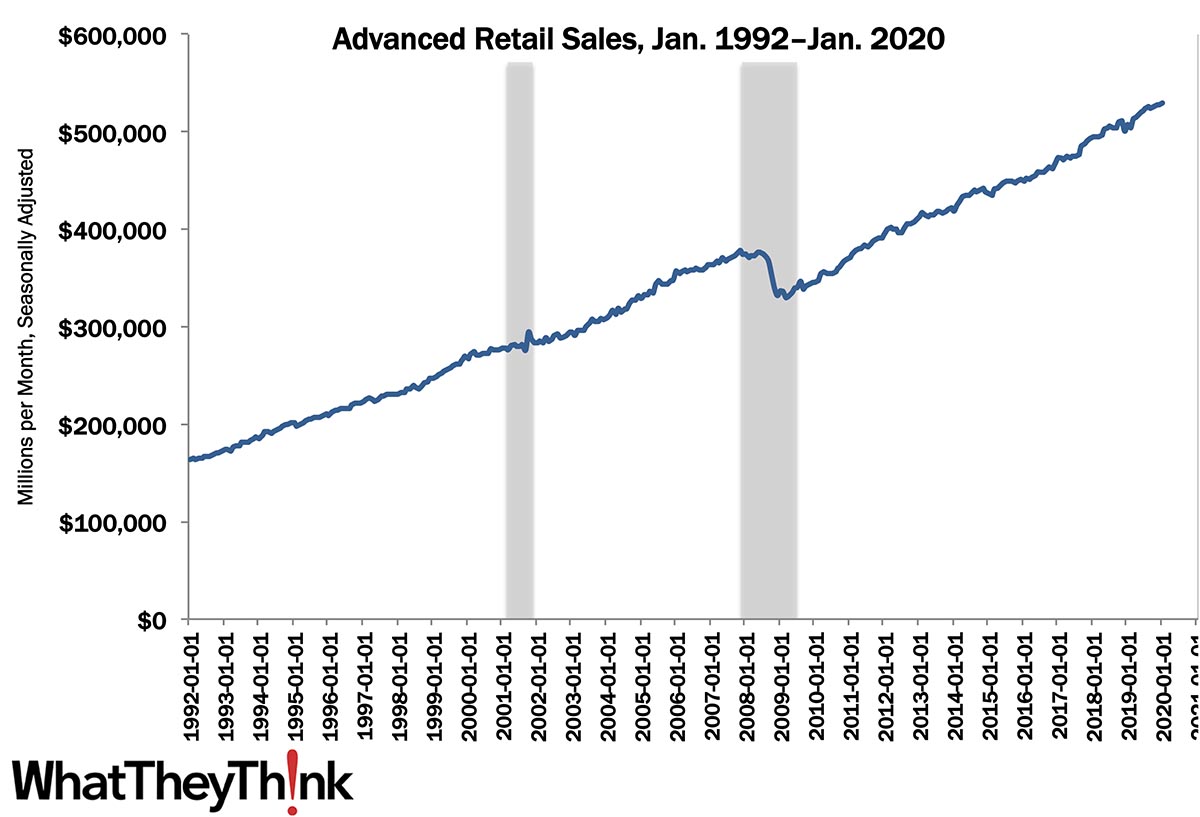
Retail Sales—January 2020
Published: February 28, 2020
Advance estimates of U.S. retail and food services sales for January 2020, adjusted for seasonal variation and holiday and trading-day differences, but not for price changes, were $529.8 billion, an increase of +0.3% (±0.4%) from the previous month, and +4.4% (±0.7%) above January 2019. Retail drives a lot of printing and packaging volume, so it’s important to keep an eye on that sector. Full Analysis


![]()
- The Future of AI In Packaging
- Inkjet Integrator Profiles: DJM
- Spring Inkjet Update – Webinar
- Security Ink Technologies for Anti-Counterfeiting Measures
- Komori unveils B2 UV Inkjet
- Keeping Nozzles Fresh with Flow
- Komori to Unveil the J-throne 29 Next Generation Digital Press at drupa 2024
- Inkjet drives convergence of transactional and graphic arts applications

WhatTheyThink is the official show daily media partner of drupa 2024. More info about drupa programs
© 2024 WhatTheyThink. All Rights Reserved.