Data Analysis
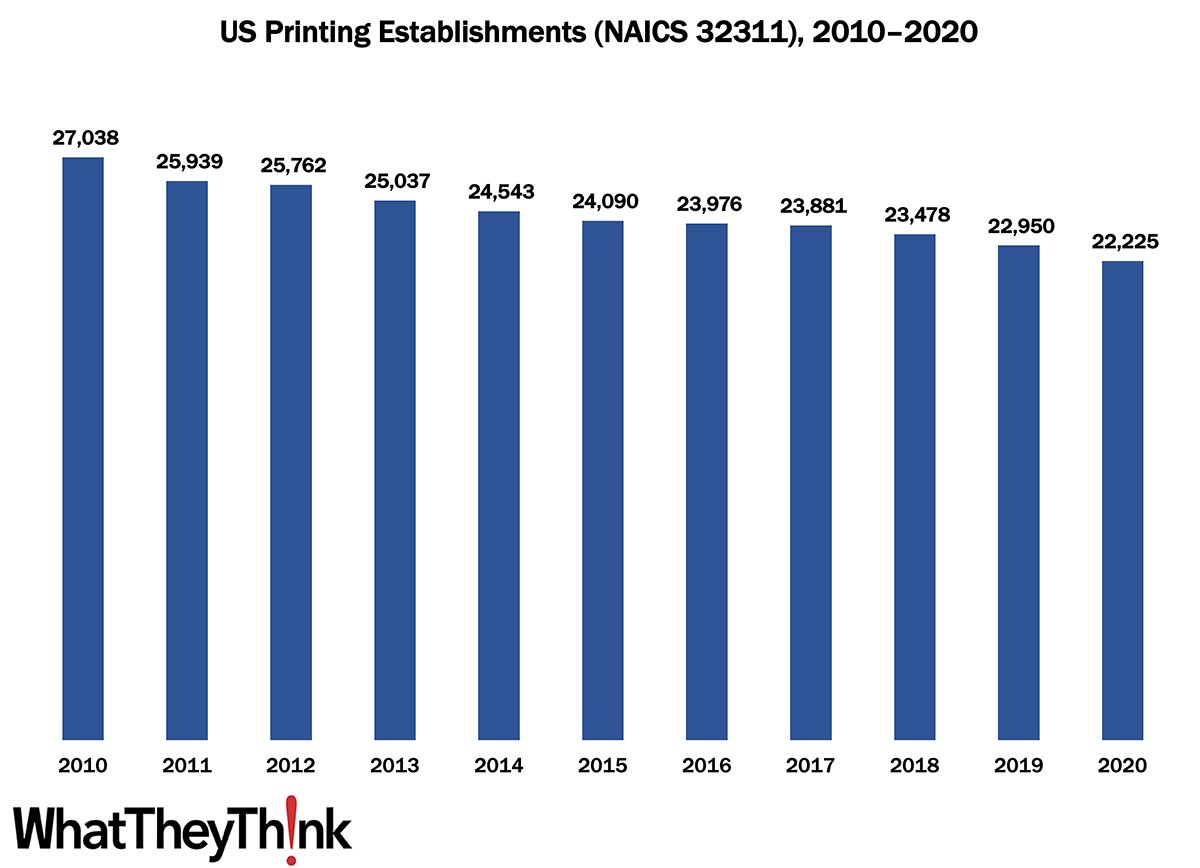
Printing Establishments—2010–2020
Published: July 29, 2022
According to the latest, just-released edition of County Business Patterns, in 2020 there were 22,225 establishments in NAICS 32311 (Printing). This represents a decline of 18% since 2010. In macro news, Q2 GDP declined -0.9%. Full Analysis
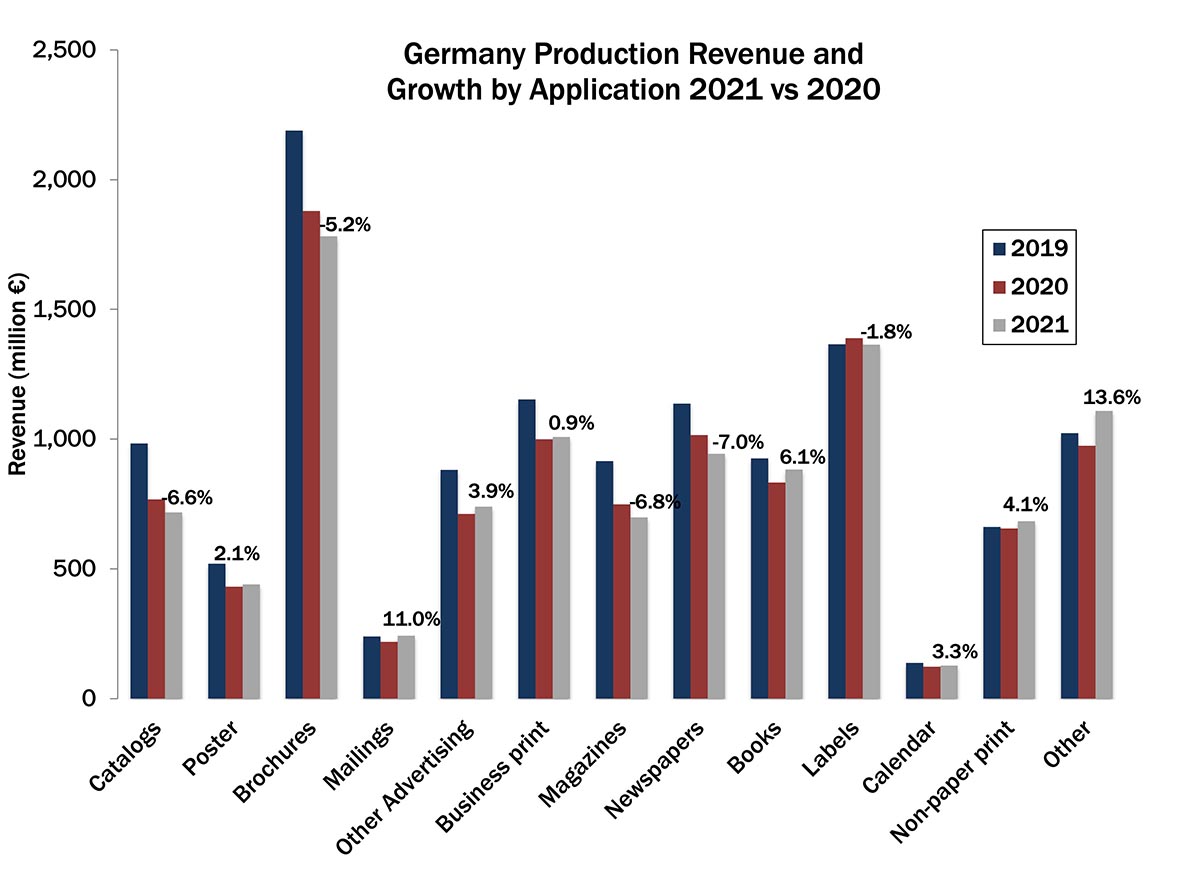
Post-Pandemic Print Applications in Germany—No Drop, No Growth
Published: July 26, 2022
The German printing industry association (BVDM) recently published its 2021 print industry statistics, which includes an overview of print application revenues. Ralf Schlözer takes a look at print revenue growth in Germany and the impact the pandemic and post-pandemic recovery had on individual print applications. Full Analysis
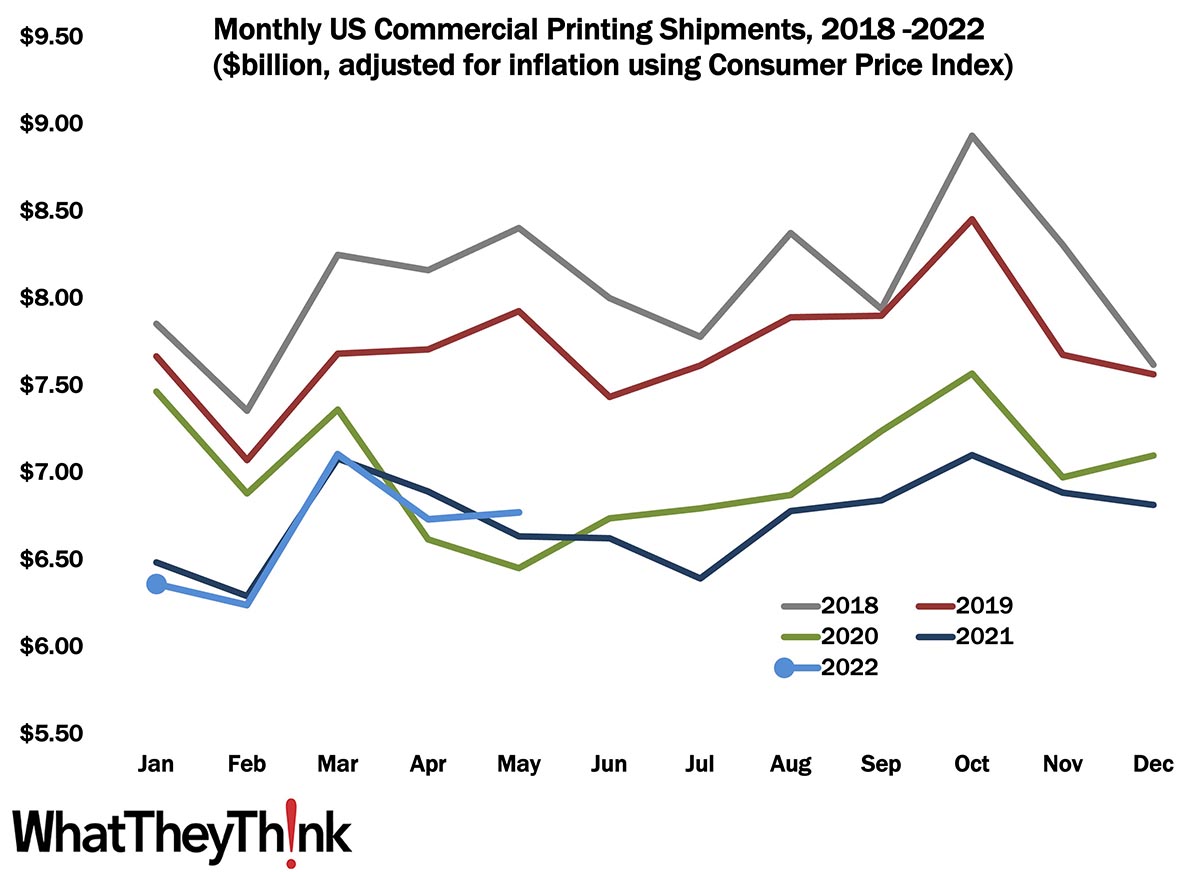
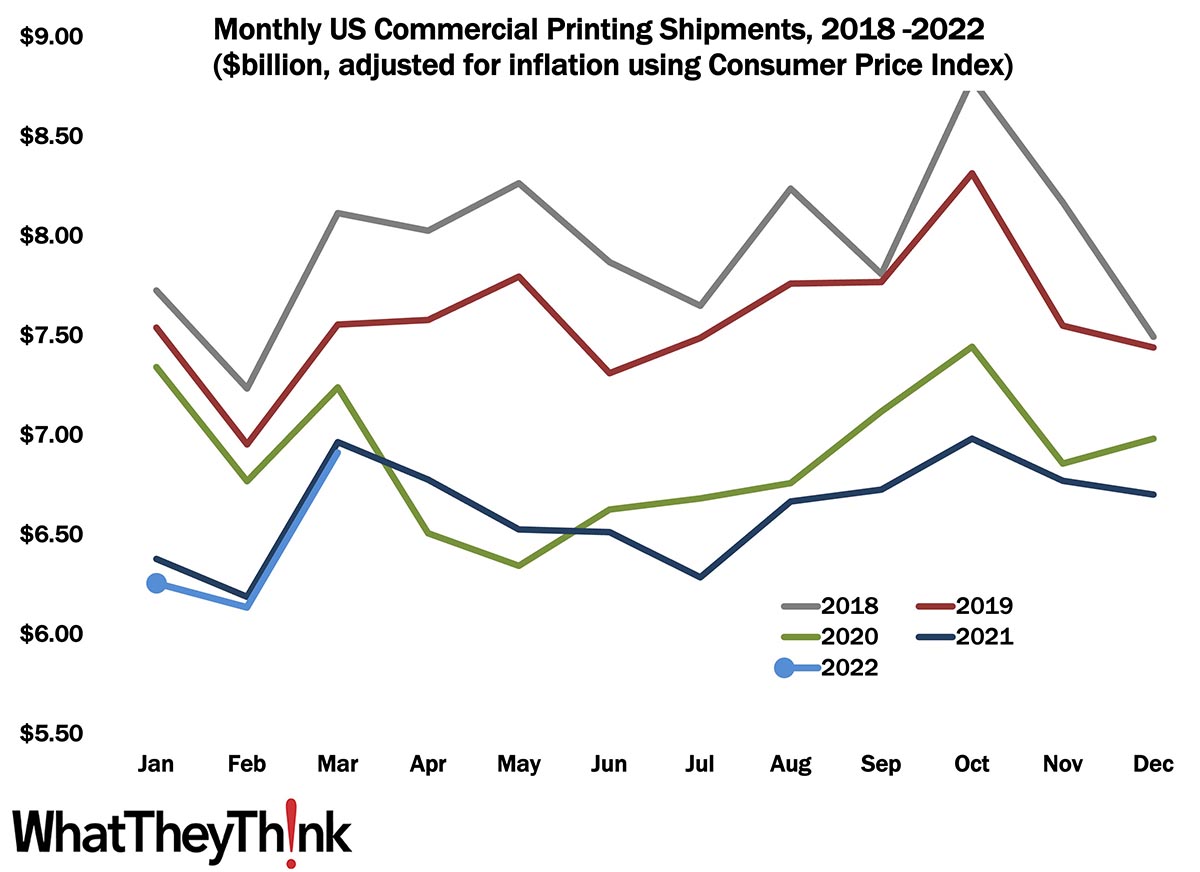
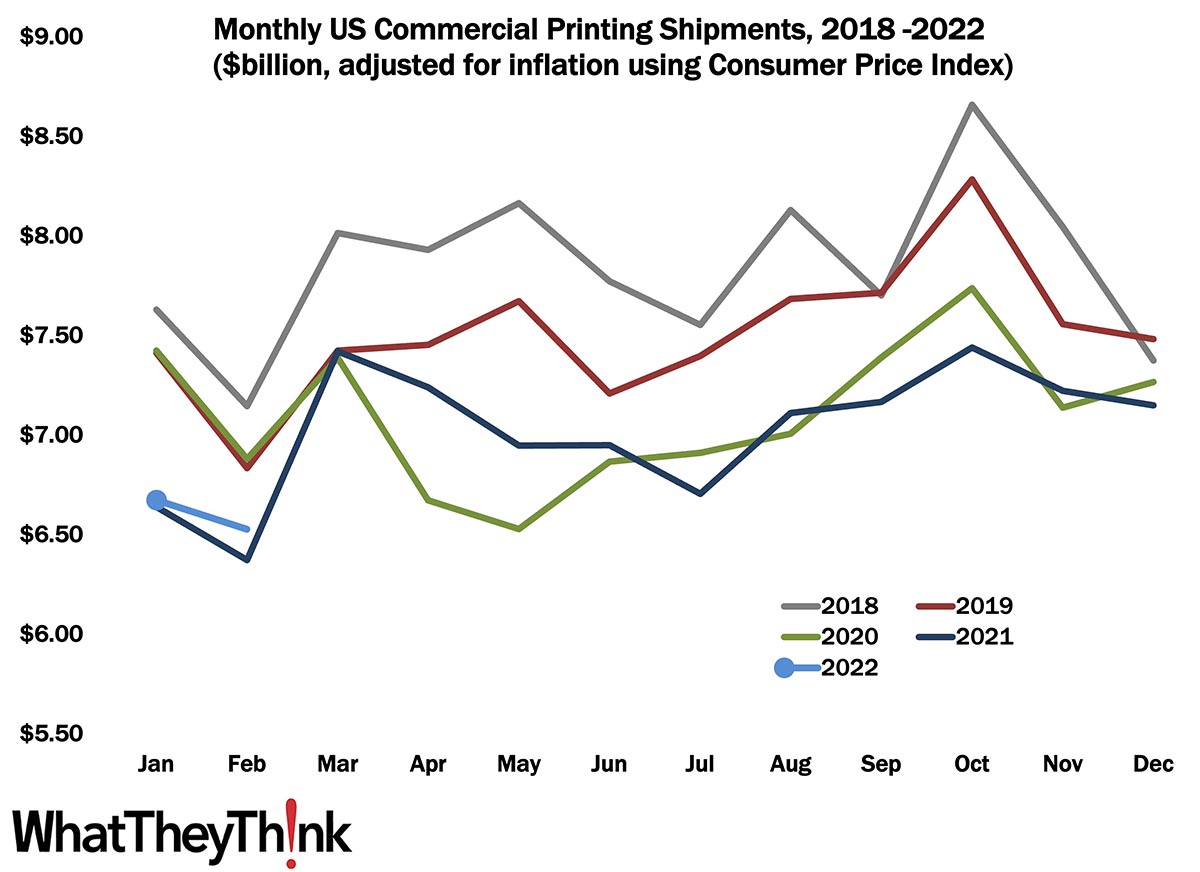
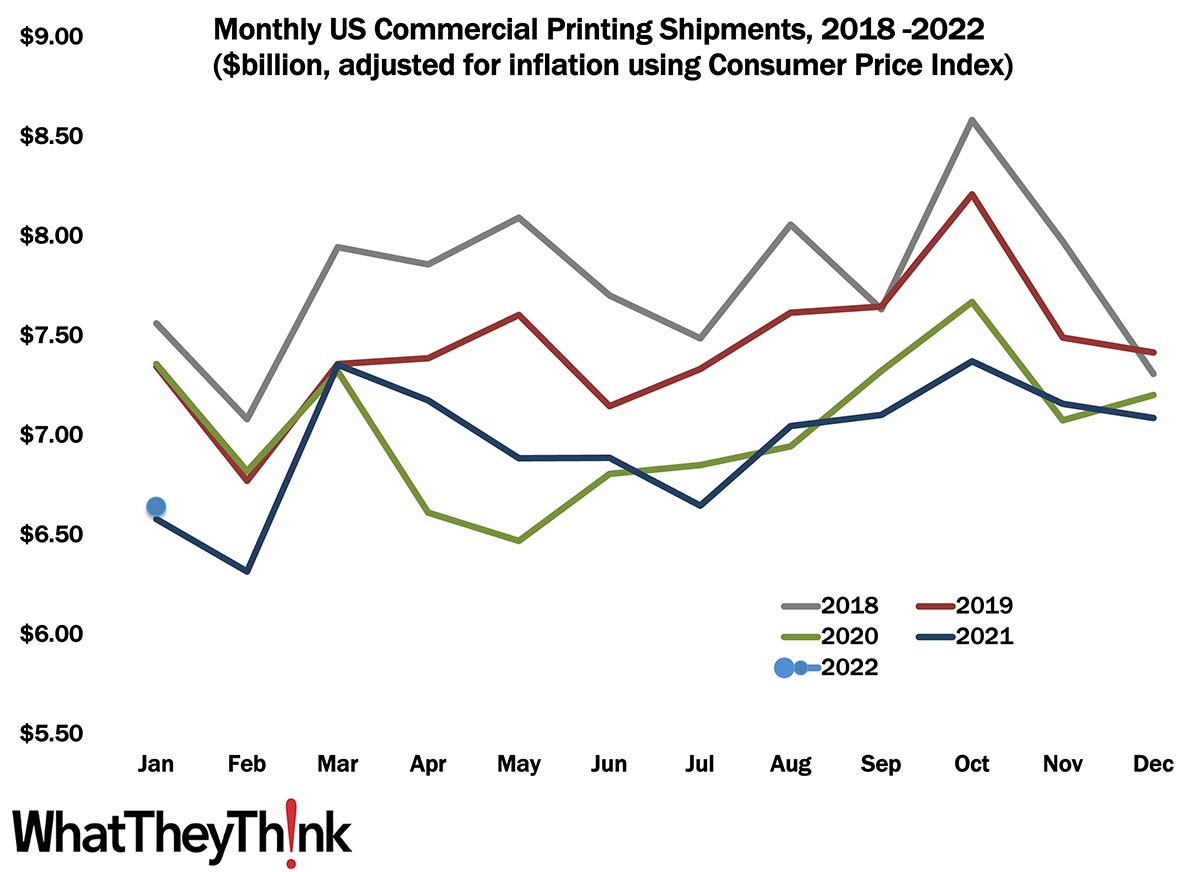
Printing Shipments: The Best May Since the Before Times
Published: July 22, 2022
May 2022 shipments came in at $6.77 billion, up from April’s $6.73 billion. This is the best May the industry has had since 2019—although it’s well below that month’s $7.92 billion. Full Analysis
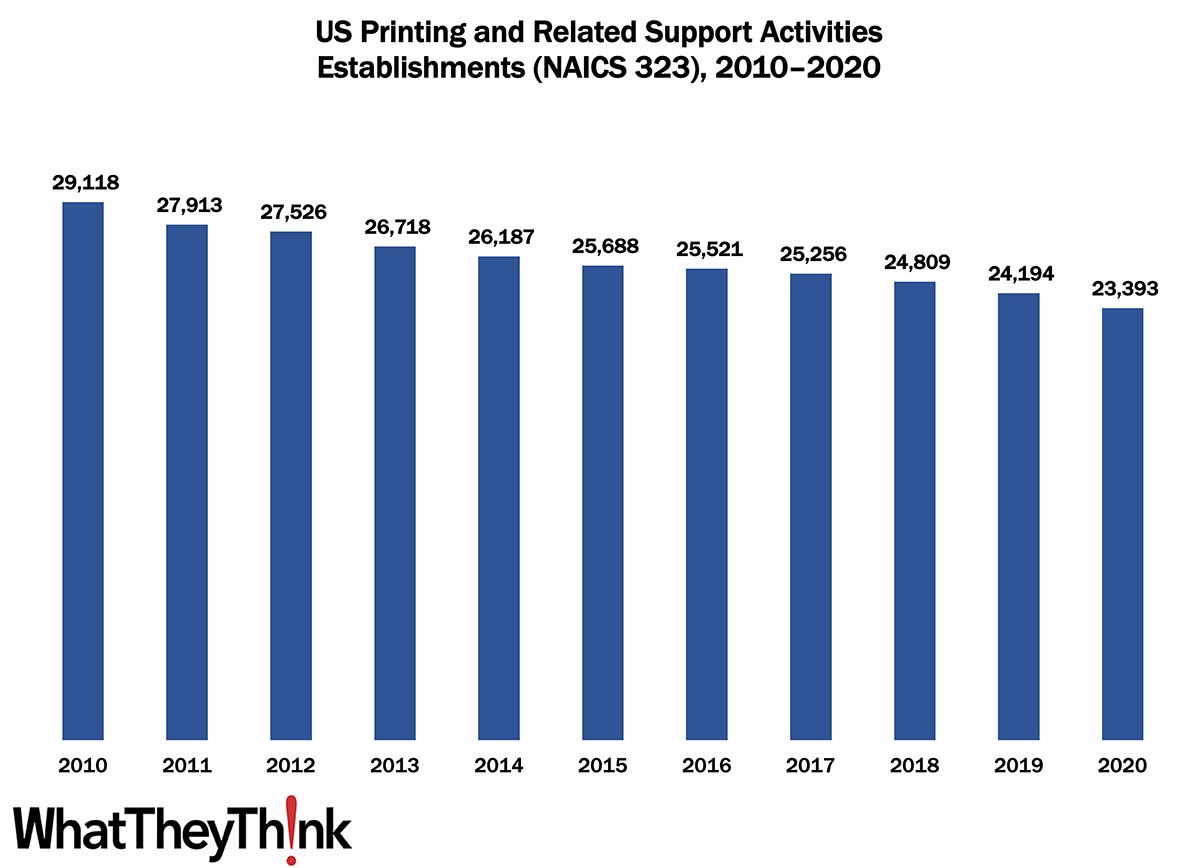
Printing Establishments—2010–2020
Published: July 15, 2022
According to the latest, just-released edition of County Business Patterns, in 2020 there were 23,393 establishments in NAICS 323 (Printing and Related Support Activities). This represents a decline of 20% since 2010. In macro news, Q2 GDP estimates are bearish—but that may not be cause for concern. Full Analysis
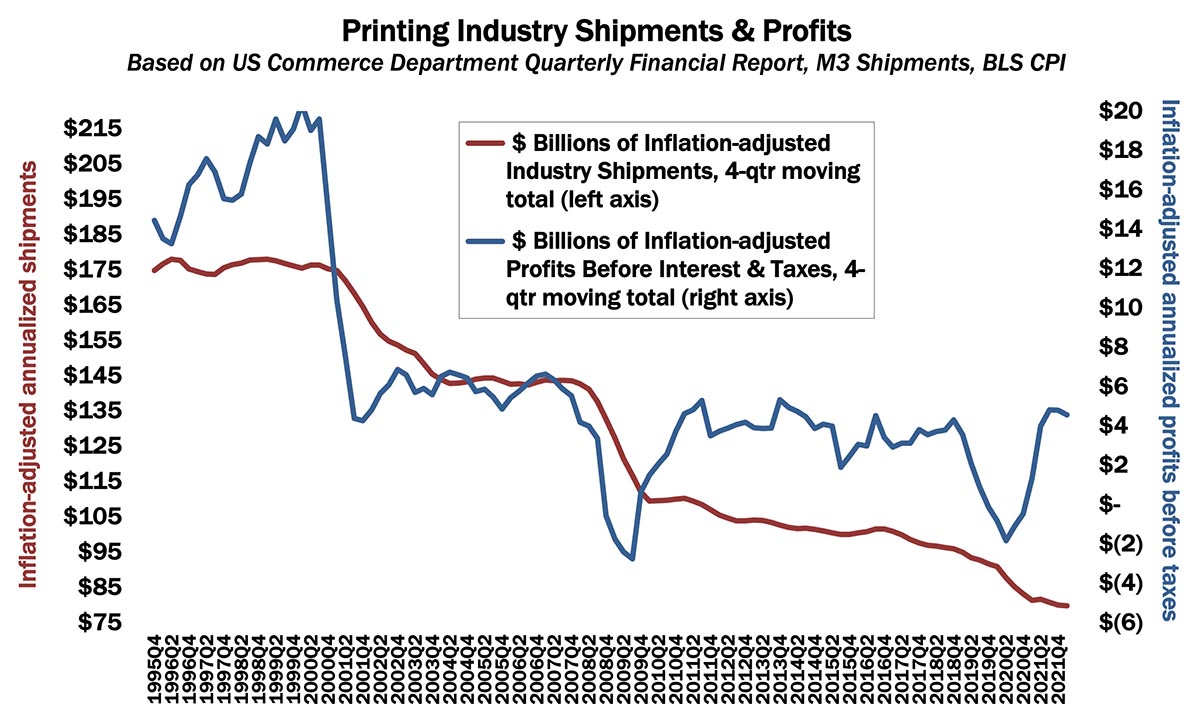
Printing Profits: Back to Pre-Pandemic Levels
Published: July 1, 2022
Despite COVID, printing industry profits have been pretty good, with annualized profits for Q1 2022 coming in at $4.55 billion, down from $4.79 billion in Q4 2021. Full Analysis
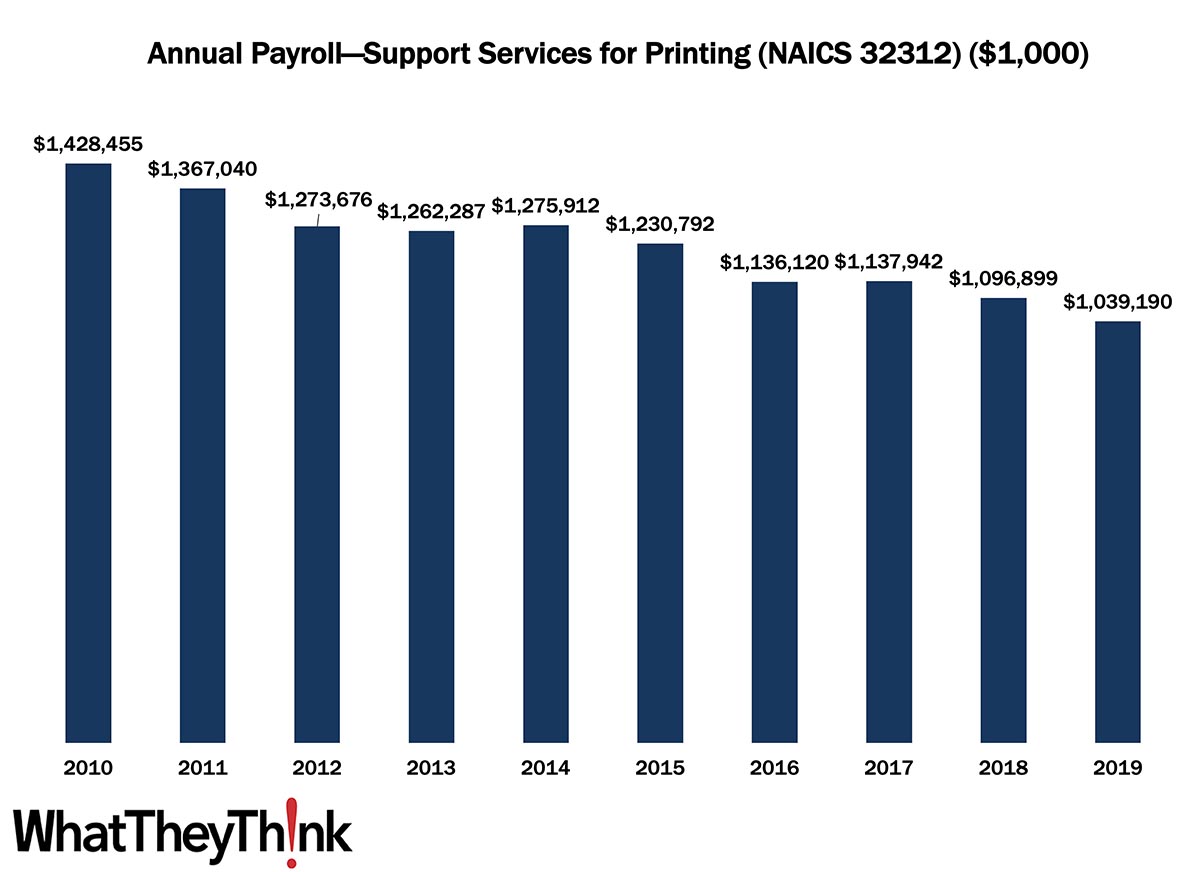
Support Activities for Printing Annual Payroll—2010–2019
Published: June 24, 2022
According to County Business Patterns, in 2010, US establishments in NAICS 32312 had an annual payroll of $1.4 billion. Payrolls declined steadily over the course of the 2010s, closing out the decade at $1.0 billion in 2019. However adjusting for inflation, payrolls declined by -38% over the course of the decade. In macro news: AIA’s Architecture Billings Index (ABI) indicates that demand for design services remains strong, boding well for commercial real estate construction and thus signage projects. Full Analysis
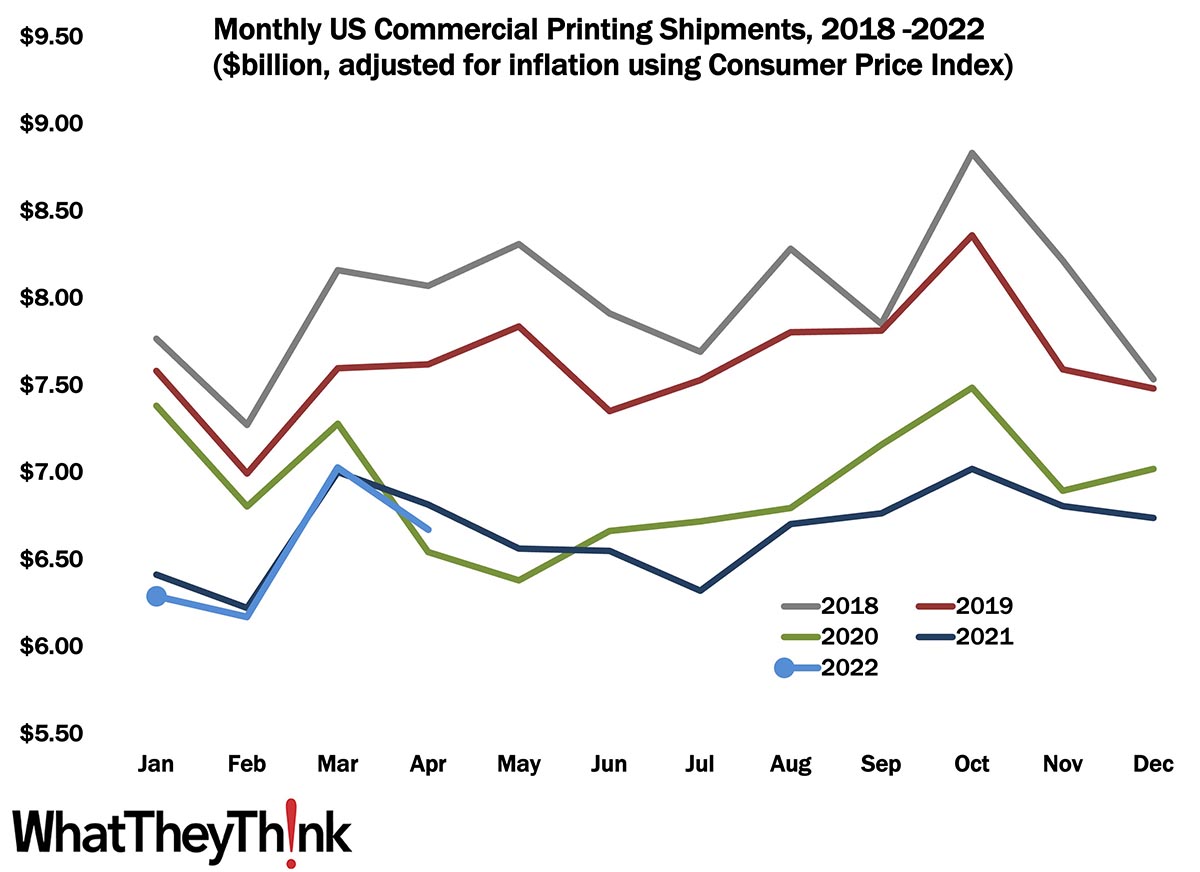
April Shipments: Returning to Regular Seasonality
Published: June 17, 2022
April 2022 shipments came in at $6.67 billion, down from March’s $7.03 billion. The general trend in all but two of the last seven years has been for April shipments to decline from March’s. That’s not really good news but suggests we’re at least getting back to normal. Full Analysis
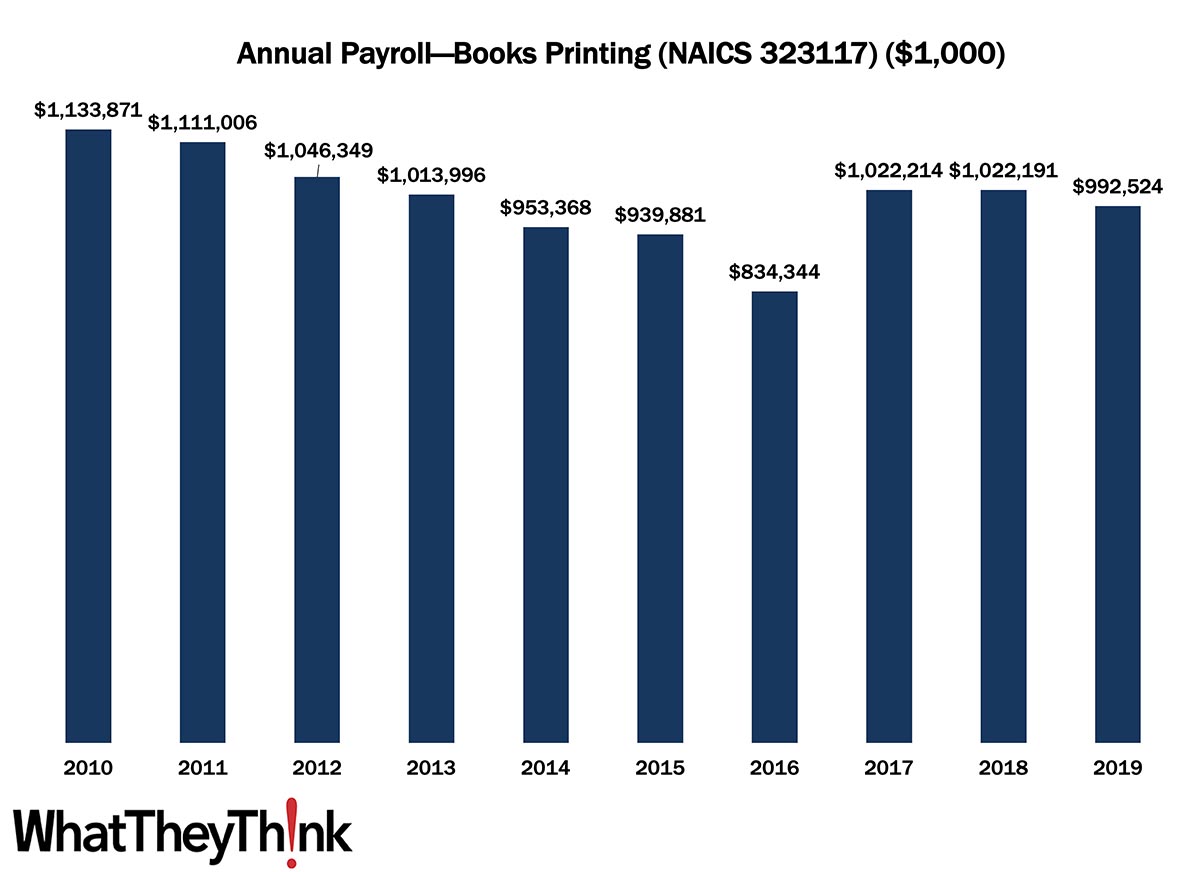
Book Printing Annual Payroll—2010–2019
Published: June 10, 2022
According to County Business Patterns, in 2010, US establishments in NAICS 323117 had an annual payroll of $1.1 billion. Payrolls declined over the first half of the 2010s, at least on a current dollar basis, but started to rise again, closing out the decade at $993 million in 2019. However adjusting for inflation, payrolls declined by -25% over the course of the decade. In macro news: what’s going on with the real estate market? Full Analysis
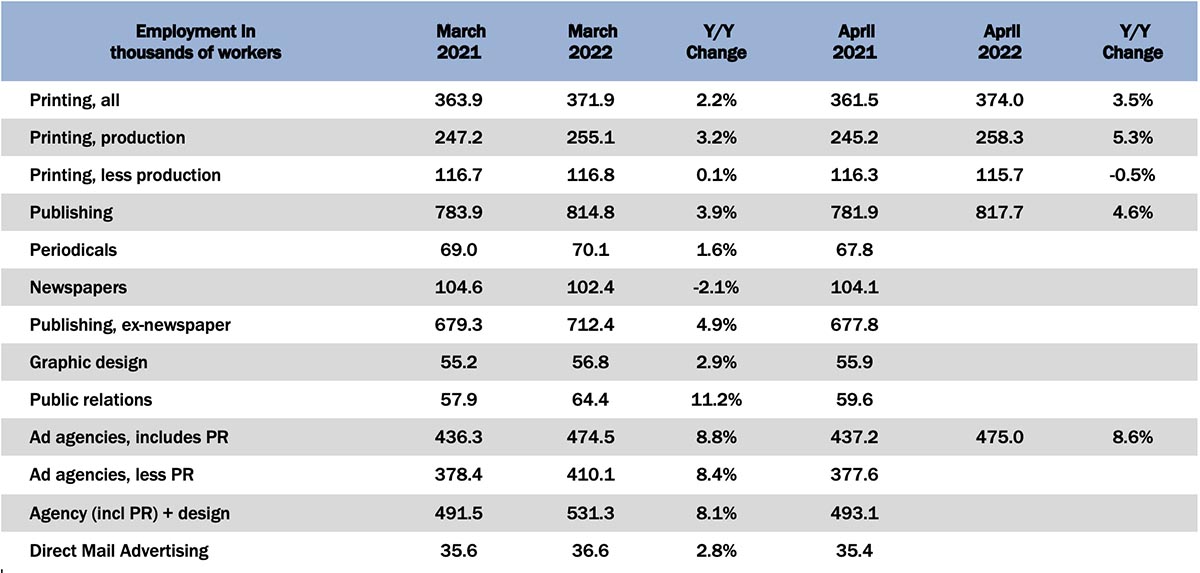
April Graphic Arts Employment—Print Production Up from March, Non-Production Down Slightly
Published: June 3, 2022
In March 2022, all printing employment was up +0.6% from March. This time, it was production employment that was up (+1.6%) and non-production employment that was down (-0.9%). Full Analysis
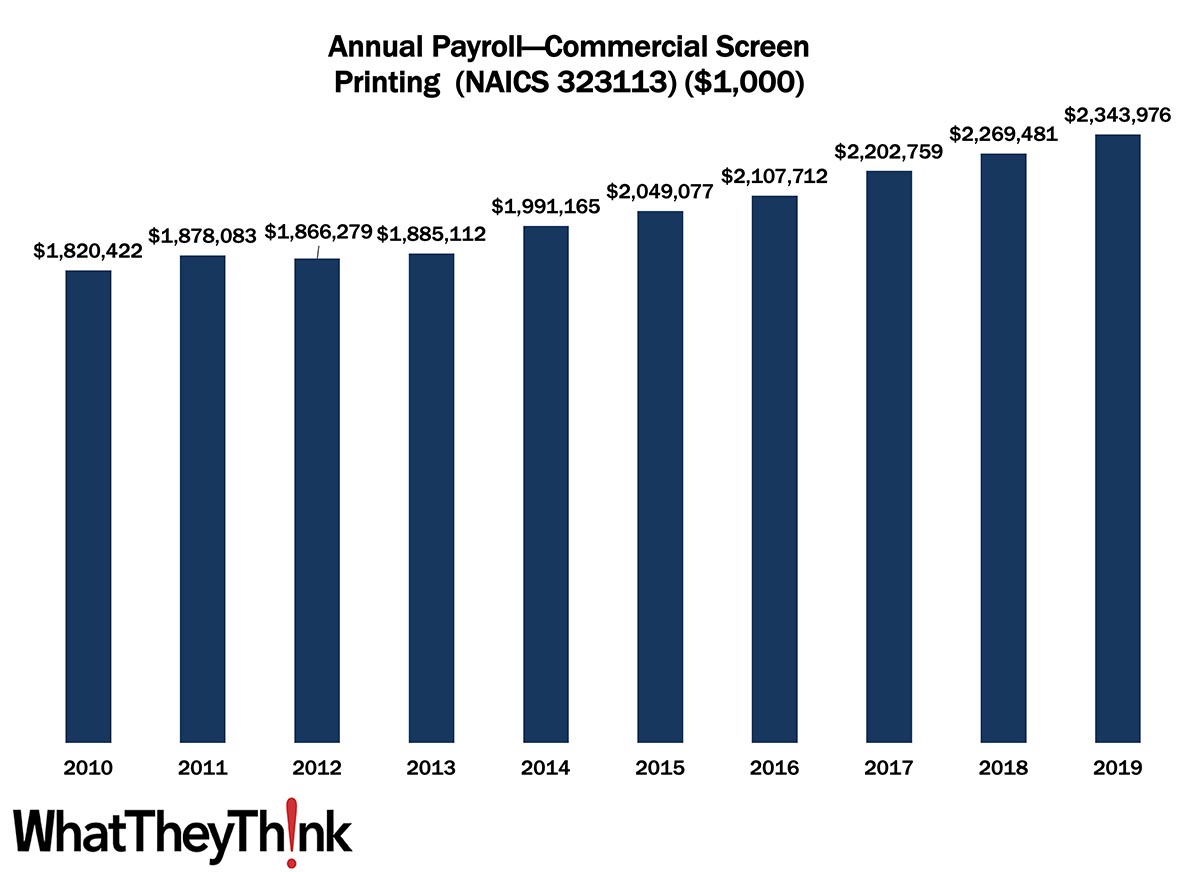
Commercial Screen Printing Annual Payroll—2010–2019
Published: May 27, 2022
According to County Business Patterns, in 2010, US establishments in NAICS 323113 had an annual payroll of $1.8 billion. Payrolls were generally unaffected by the Great Recession and rose over the course of the 2010s, at least on a current dollar basis, finishing out the decade at $2.3 billion in 2019. However adjusting for inflation, payrolls declined by -10% over the course of the decade. In macro news: Q1 GDP revised down. Full Analysis
March Shipments: It’s Déjà Vu All Over Again
Published: May 20, 2022
March 2022 shipments came in at $6.91 billion, up from February’s $6.14 billion. So far, it looks like 2022 is closely mirroring 2021—which isn’t necessarily a bad thing. Full Analysis
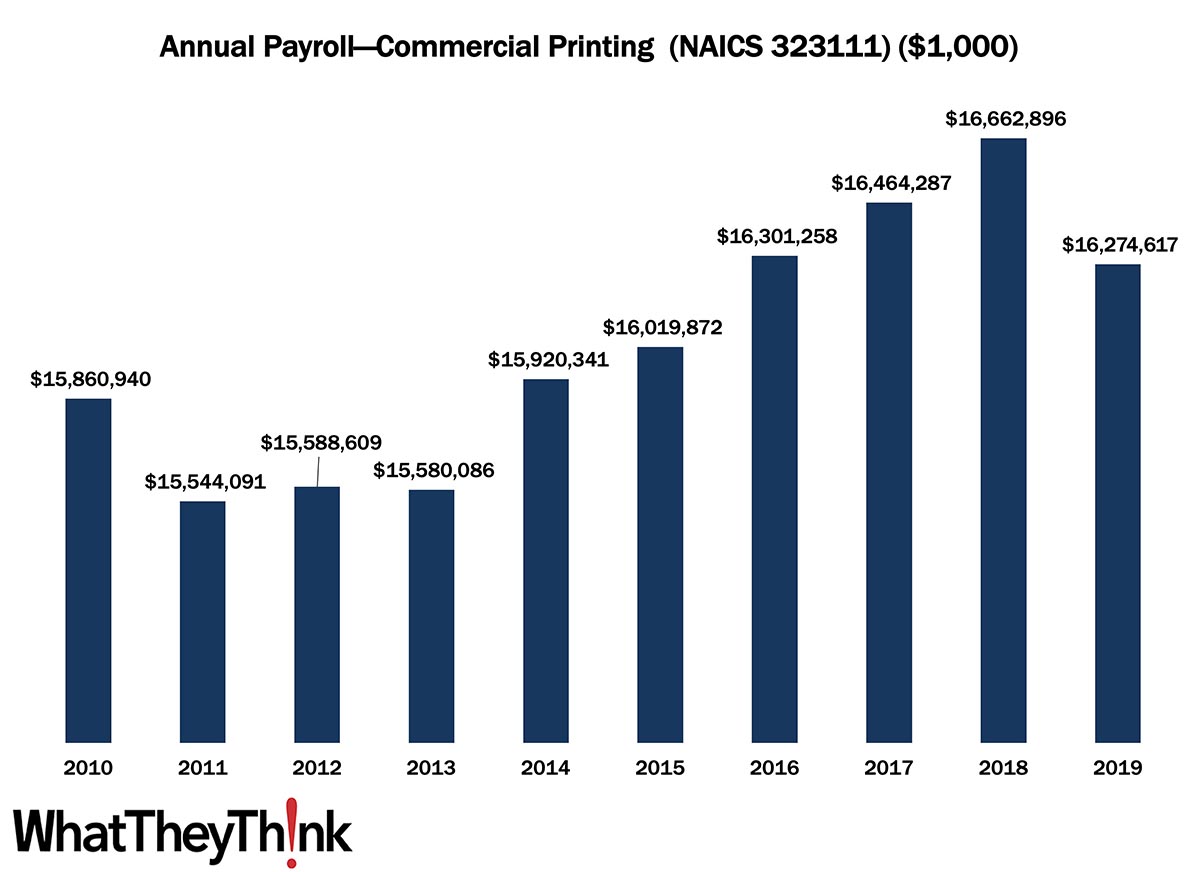
Commercial Printing Annual Payroll—2010–2019
Published: May 13, 2022
According to County Business Patterns, in 2010, US establishments in NAICS 323111 had an annual payroll of $15.9 billion. Payrolls dipped during and in the aftermath of the Great Recession and then rose, at least on a current dollar basis, over the latter half of the decade before dropping in 2019, finishing out the decade at $16.3 billion in 2019. However adjusting for inflation, payrolls declined by -12% over the course of the decade. In macro news: inflation is starting to slow ever so slightly. Full Analysis
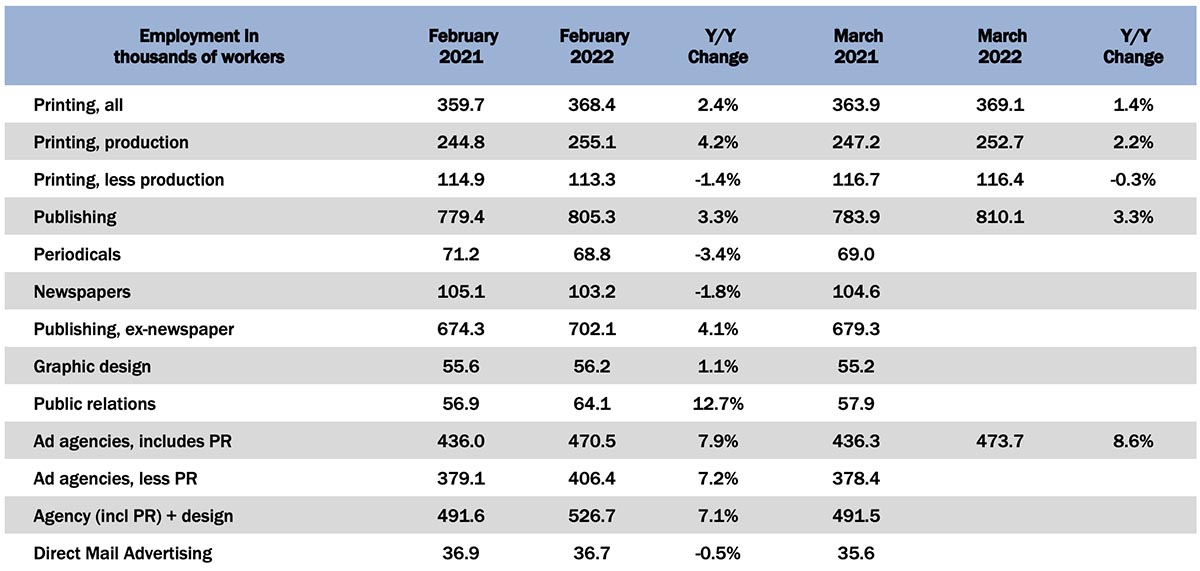
March Graphic Arts Employment—Print Production Drops from February, Non-Production Up a Bit
Published: May 6, 2022
In March 2022, all printing employment was up +0.2% from February. Non-production printing employment was up +2.7%, but production employment was down -0.9%. Full Analysis
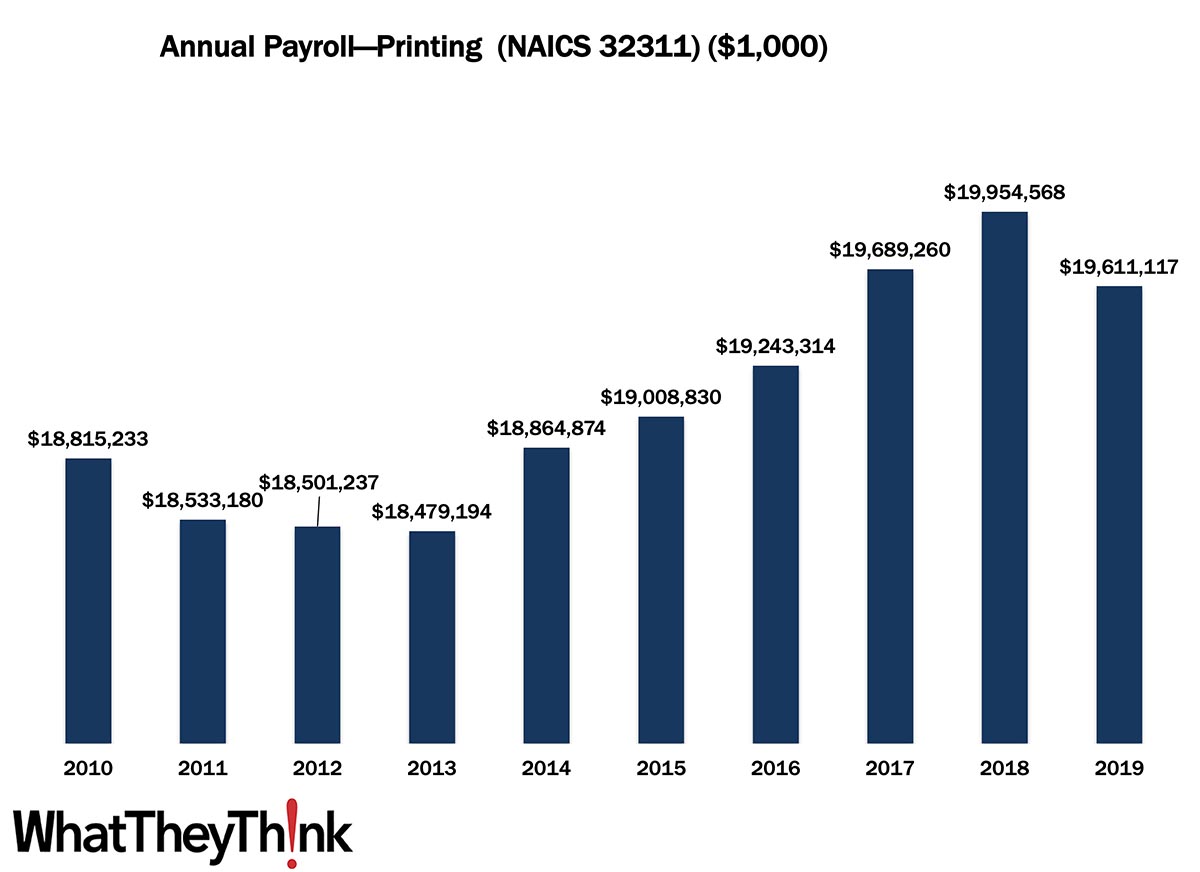
Printing Annual Payroll—2010–2019
Published: April 29, 2022
According to County Business Patterns, in 2010, US establishments in NAICS 32311 had an annual payroll of $18.8 billion. Payrolls dipped during and in the aftermath of the Great Recession and then rose, at least on a current dollar basis, over the latter half of the decade, coming in at $19.6 billion in 2019. However adjusting for inflation, payrolls declined by -11% over the course of the decade. In macro news: GDP decreased by 1.4% in Q1 2022. Full Analysis
February Shipments: OK, About What We Expected
Published: April 22, 2022
February 2022 shipments came in at $6.53 billion, down from January’s $6.67 billion. As we remarked last month we’re starting the year better than we did 2021 and reverting back to our normal seasonality trends. Full Analysis
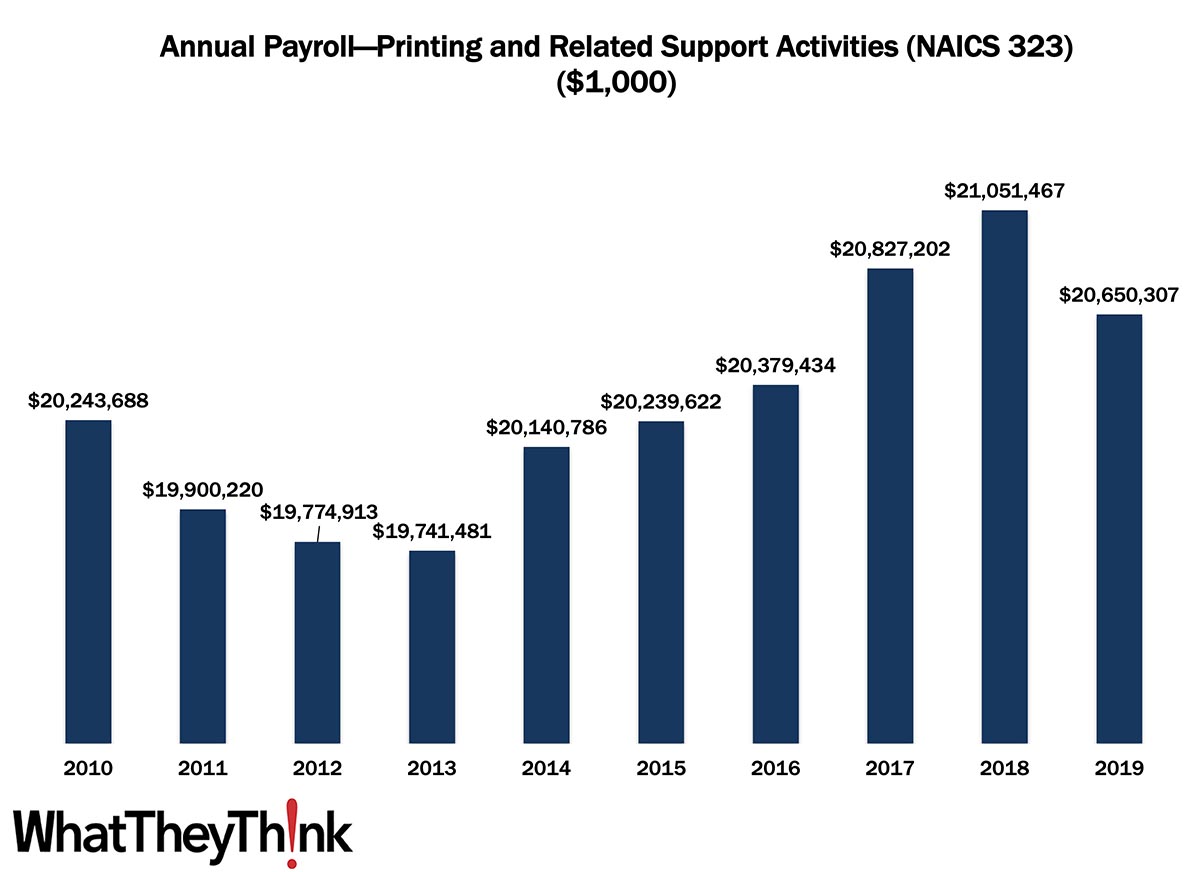
Printing Industry Annual Payroll—2010–2019
Published: April 8, 2022
According to County Business Patterns, in 2010, US establishments in NAICS 323 had an annual payroll of $20.2 billion. Payrolls dipped during and in the aftermath of the Great Recession. They rose, at least on a current dollar basis, over the latter half of the decade, coming in at $20.7 billion in 2019. However adjusting for inflation, payrolls declined by -13% over the course of the decade. In macro news: forecasters are not expecting a happy Q1 GDP report. Full Analysis
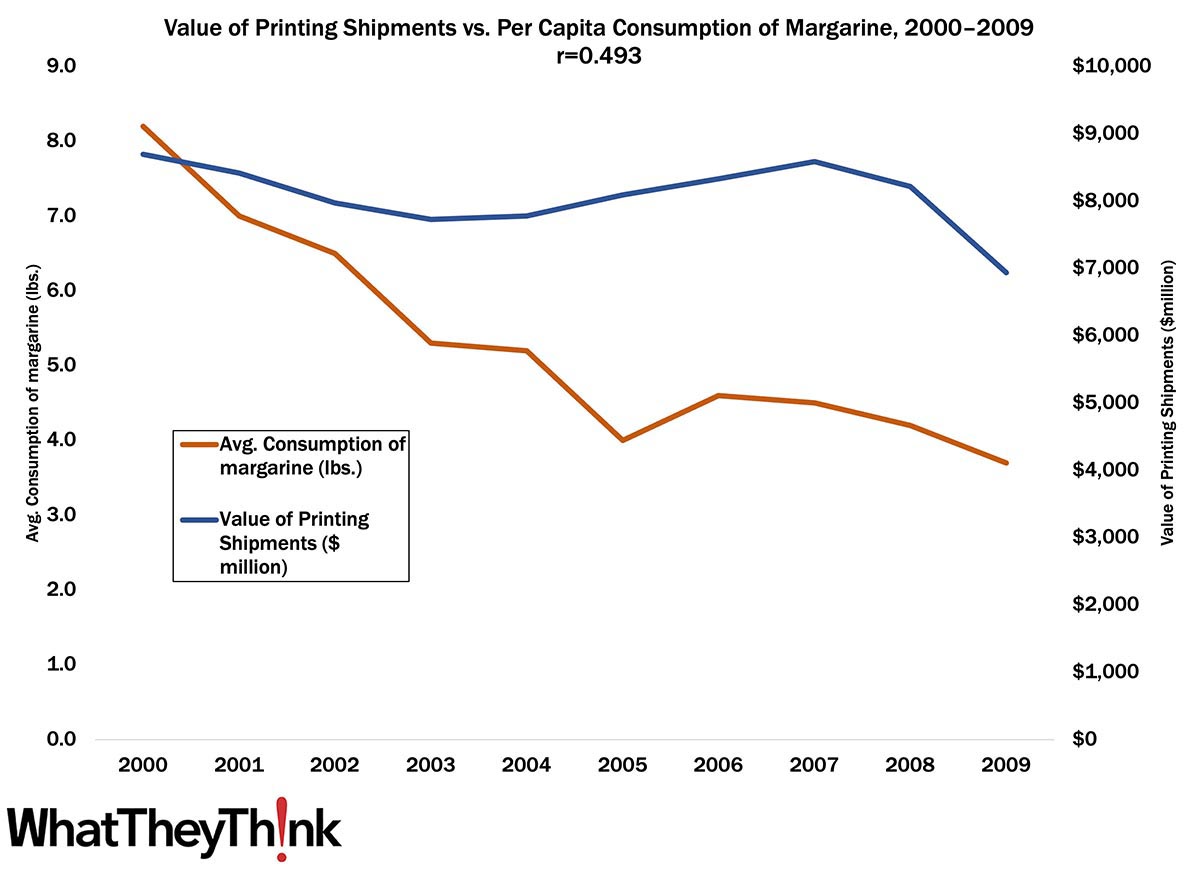
Now it Can be Told: Why Printing Shipments Declined! (April Fools 2022 Edition)
Published: April 1, 2022
In this exclusive report, we found a modest positive relationship between the decline in average consumption of margarine and the value of printing shipments. Full Analysis
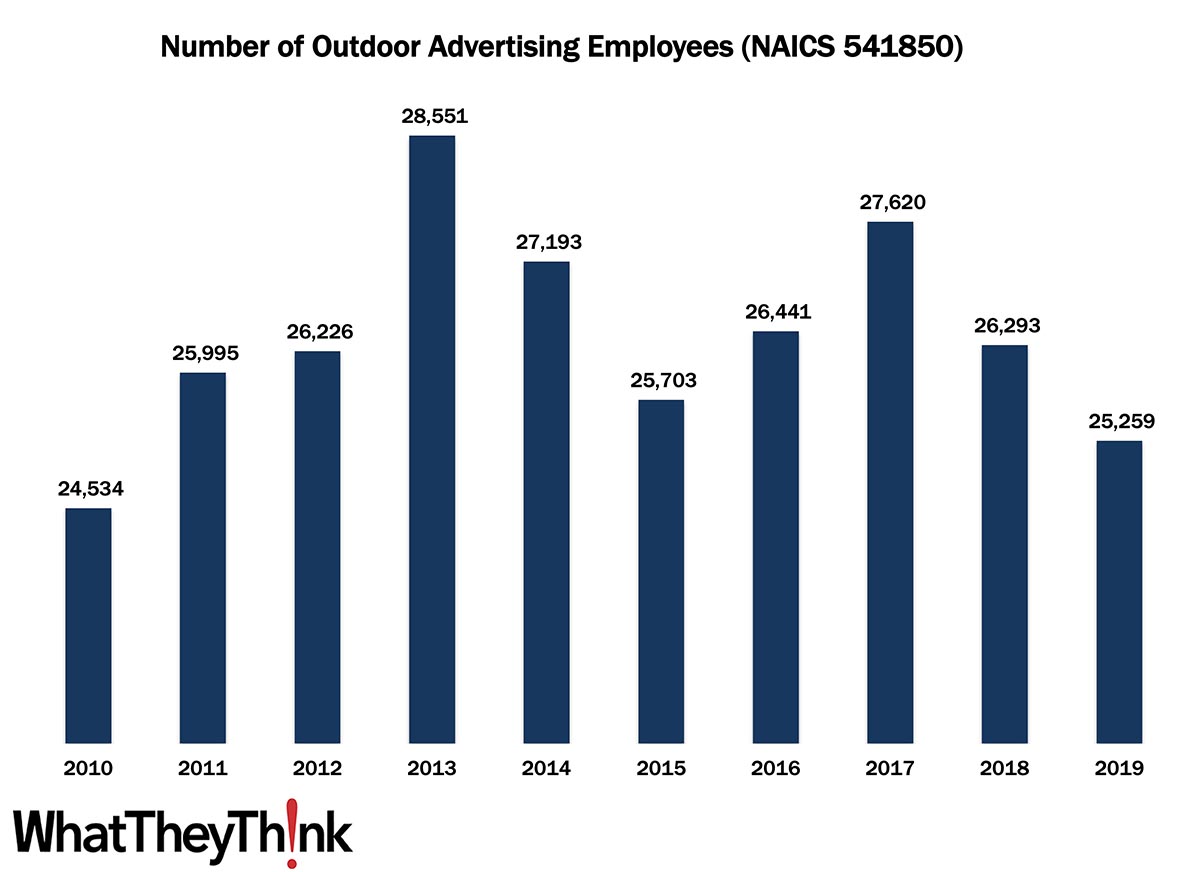
Outdoor Advertising Employees—2010–2019
Published: March 25, 2022
According to County Business Patterns, in 2010, there were 24,534 employees in NAICS 541850 (Outdoor Advertising). This NAICS actually grew post-Great Recession, with a slight decline mid-decade before climbing back up to 27,620 establishments in 2017. 2018 and 2019 saw a drop in employees. In macro news: AIA’s Architecture Billings Index (ABI) indicates that demand for design services continues to grow, boding well for commercial real estate construction and thus signage projects. Full Analysis
January Shipments: Let’s Get This Year Right
Published: March 18, 2022
January 2022 shipments came in at $6.64 billion, down from December’s $7.09 billion. We’re starting the year better than we did 2021 and reverting back to our normal seasonality trends. Full Analysis
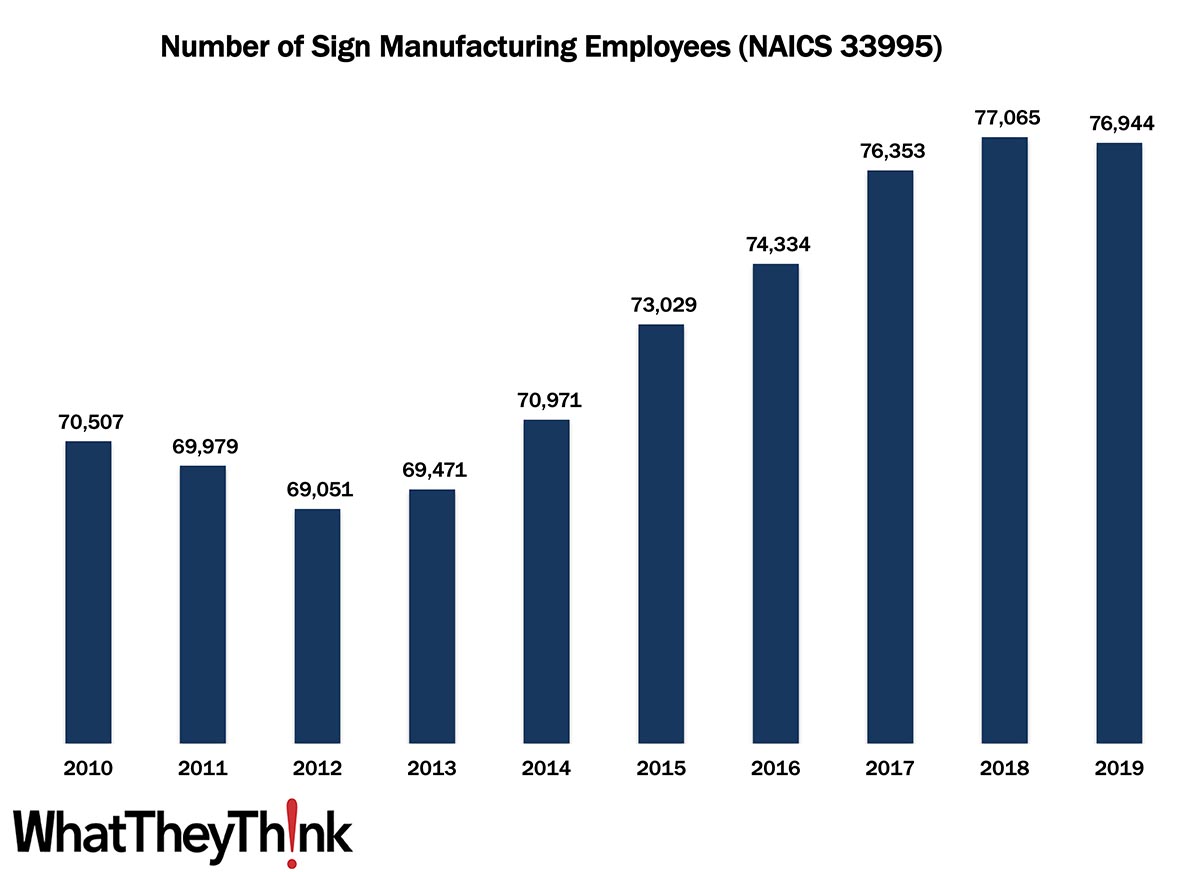
Sign Manufacturing Employees—2010–2019
Published: March 11, 2022
According to County Business Patterns, in 2010, there were 70,507 employees in NAICS 33995 (Sign Manufacturing). This NAICS category tumbled in the wake of the Great Recession, ultimately climbing to 76,944 employees in 2019. In macro news: Inflation continues to continue to climb. Full Analysis
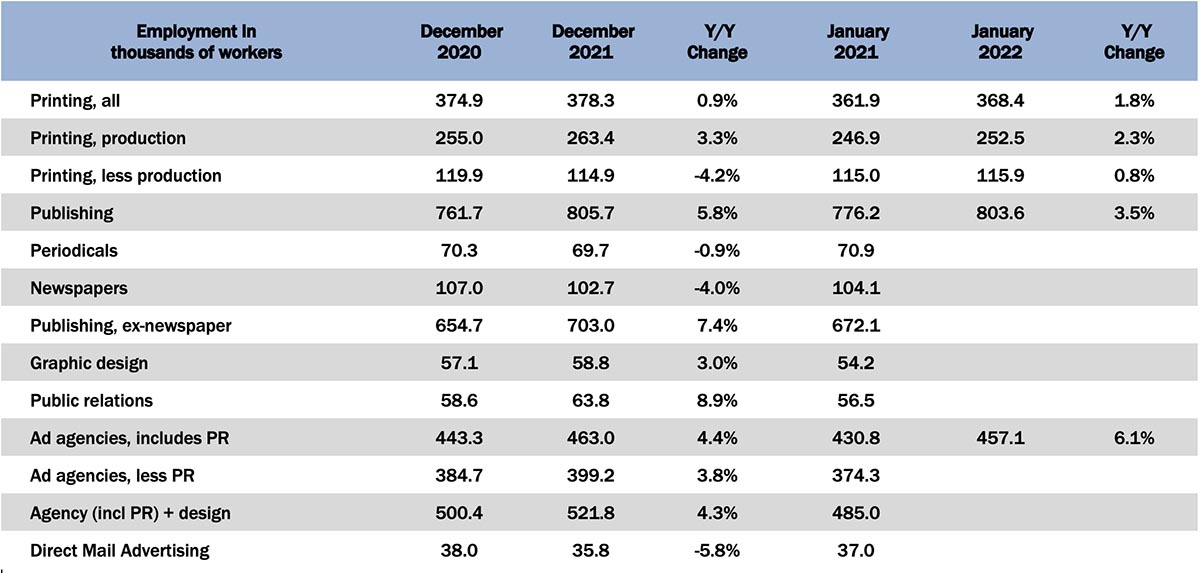
January Graphic Arts Employment—Print Production Drops from December, Non-Production Up Slightly
Published: March 4, 2022
In January 2022, all printing employment was down -2.6% from December, with production employment down -4.1%. Non-production printing employment offset that a bit by being up a modest +0.9%. Full Analysis
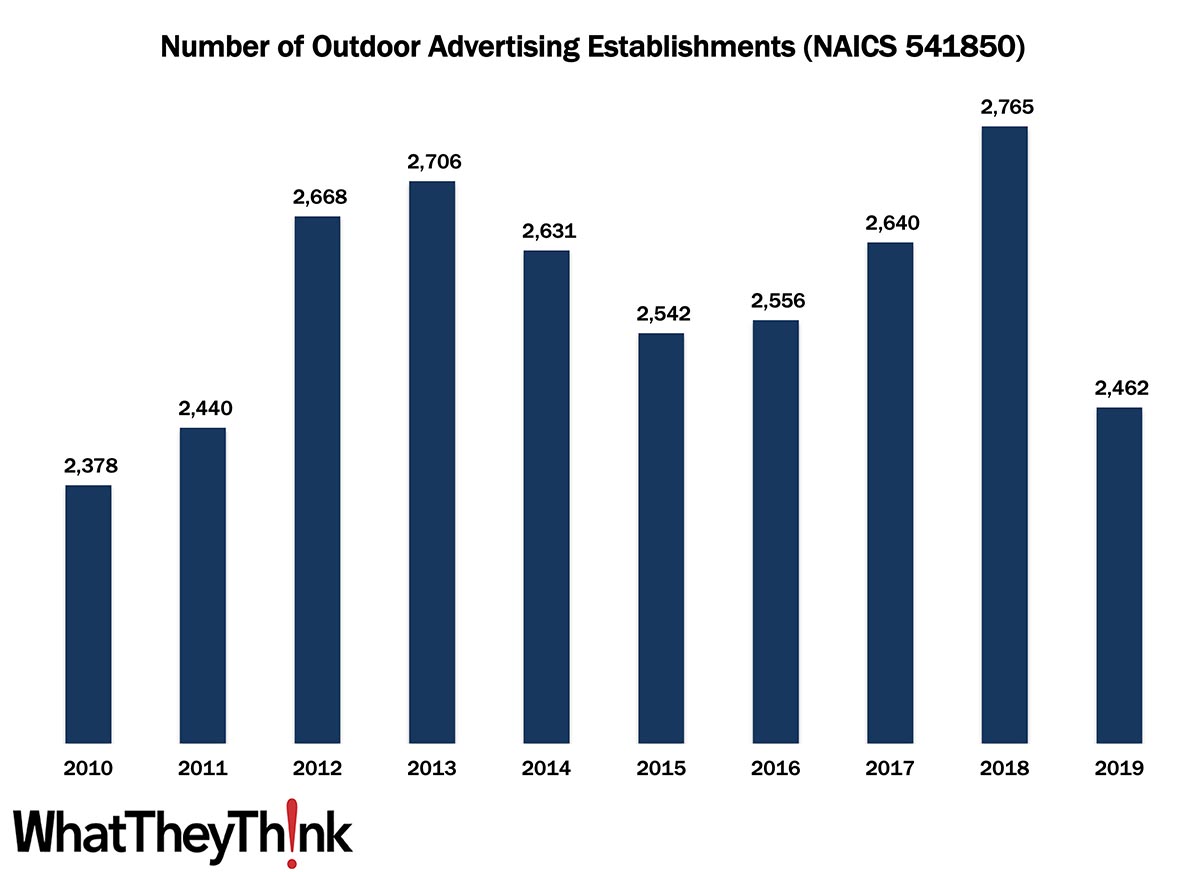
Outdoor Advertising Establishments—2010–2019
Published: February 25, 2022
According to County Business Patterns, in 2010, there were 2,378 establishments in NAICS 541850 (Outdoor Advertising). This NAICS actually grew post-Great Recession, with a slight decline mid-decade before climbing back up to 2,765 establishments in 2018. 2019 saw a massive drop in establishments. In macro news: Q4 2021 GDP revised up to 7.0%. Full Analysis
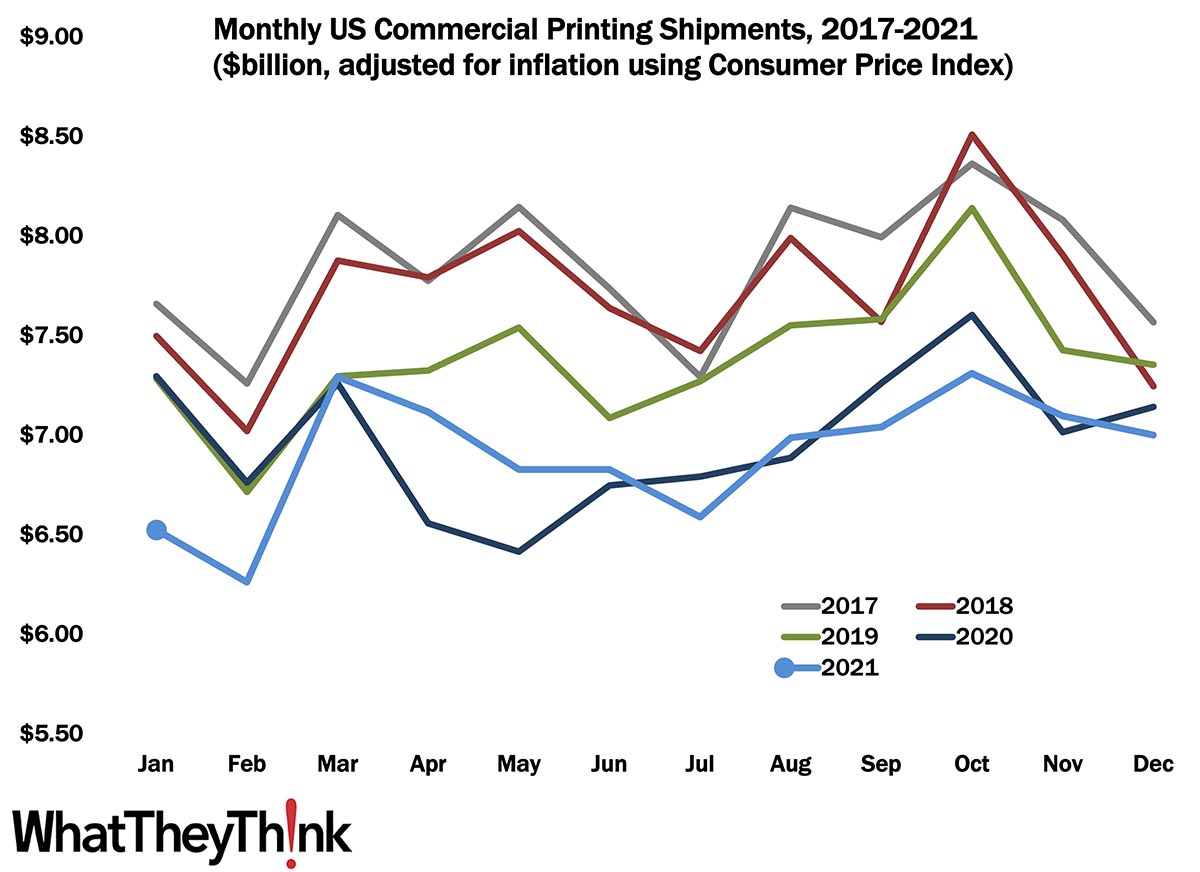
December Shipments: No Christmas Miracle
Published: February 18, 2022
As 2021 drew to a close, December printing shipments came in at $7.00 billion, down from $7.10 billion in November, keeping with the usual seasonality of a slow December. For 2021 overall, we came in at $82.87 billion for the year, just below 2020’s $83.73 billion. Full Analysis
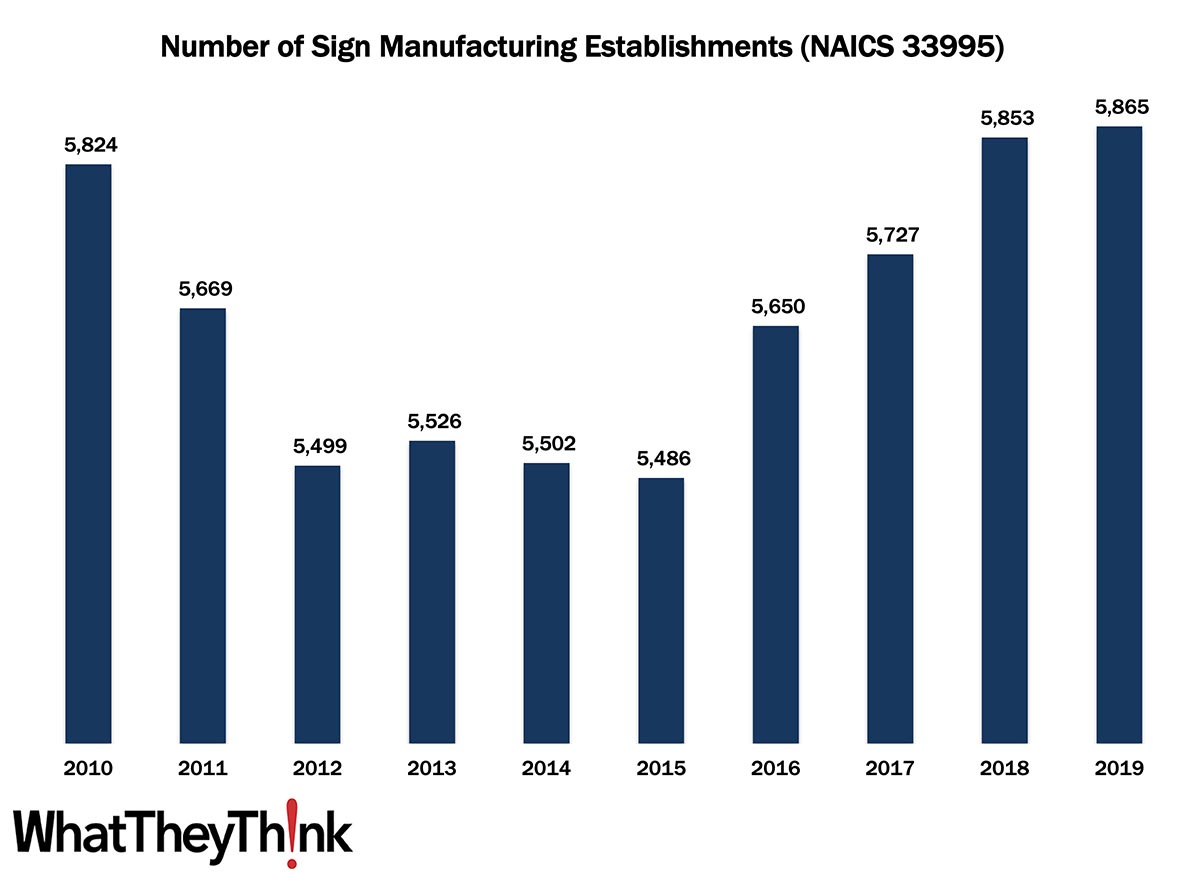
Sign Manufacturing Establishments—2010–2019
Published: February 11, 2022
According to County Business Patterns, in 2010, there were 5,824 establishments in NAICS 33995 (Sign Manufacturing). This NAICS category tumbled in the wake of the Great Recession, ultimately climbing back up to 5,865 establishments in 2019. In macro news: Inflation continues to climb. Full Analysis
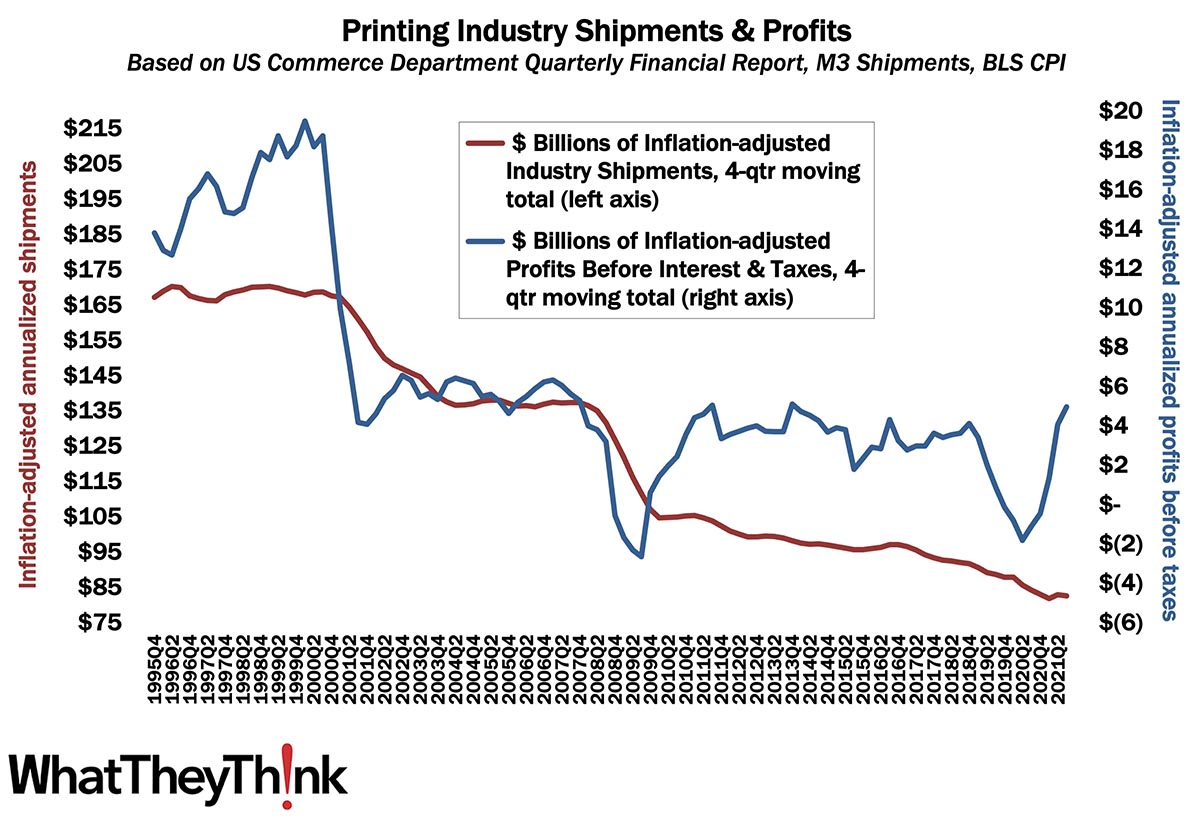
Post-Pandemic Profits on the Upturn
Published: February 4, 2022
Shipments have been slowly climbing back from the pandemic recession of 2020, but profits have been on a sharp upturn. However there still remains a bit of a profitability gap between the two major asset class distinctions. Full Analysis
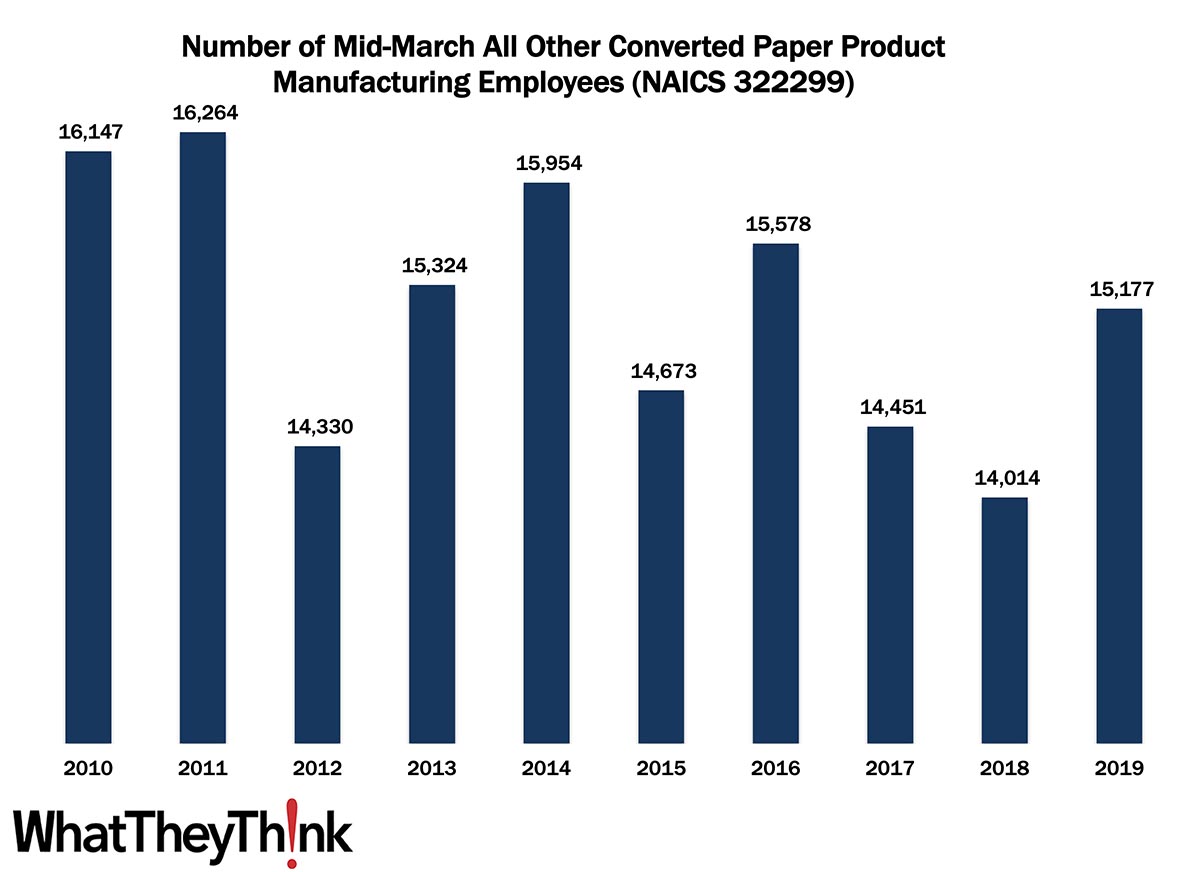
All Other Converted Paper Product Manufacturing Employment—2010–2019
Published: January 28, 2022
According to County Business Patterns, in 2010, there were 16,147 employees in 322299 (All Other Converted Paper Product Manufacturing establishments). This NAICS category bounced up and down over the course of the 2010s, ending with 15,177 employees in 2019. In macro news: Yesterday was Q4 GDP Day! Full Analysis
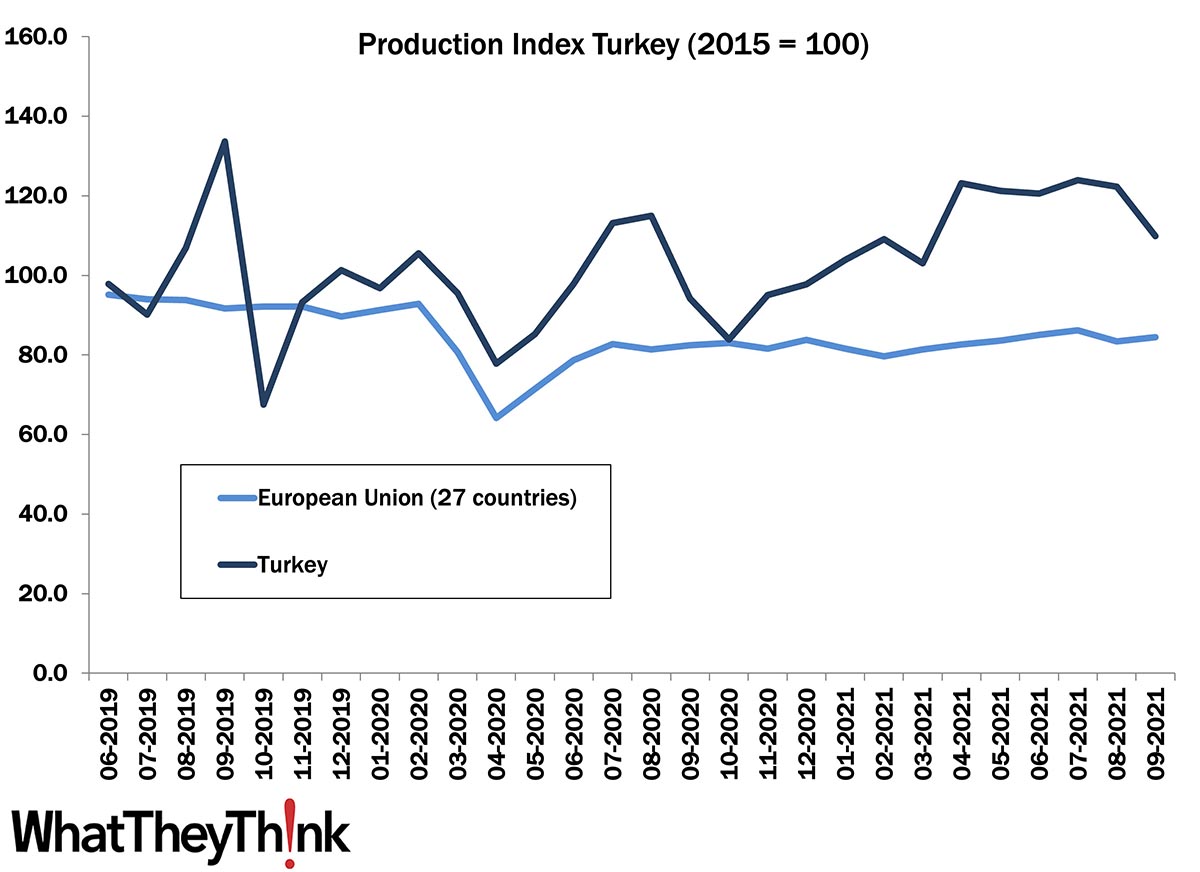
European Print Industry Snapshot: Turkey
Published: January 25, 2022
In this bimonthly series, WhatTheyThink is presenting the state of the printing industry in different European countries based on the latest monthly production numbers. This week, we take an updated look at the printing industry in Turkey. Full Analysis
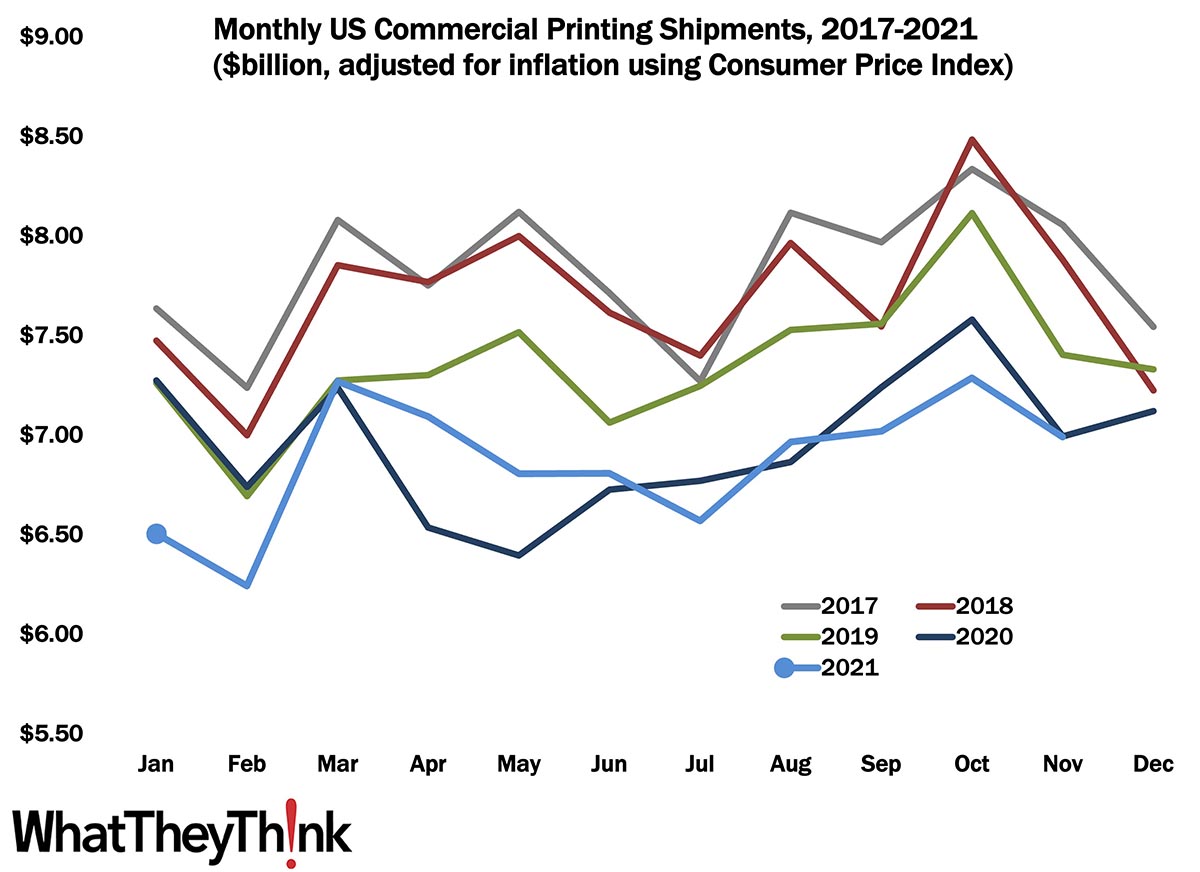
November Shipments: Reversion to the Mean
Published: January 21, 2022
November 2021 printing shipments came in at $6.99 billion, down from $7.29 billion in October, and the first month that shipments dropped since early summer. Year to date, January-to-November shipments are $75.56 billion, only a bit off 2020’s January-to-November number of $76.36. If we have a really good December, 2021 could come in slightly above 2020. Full Analysis
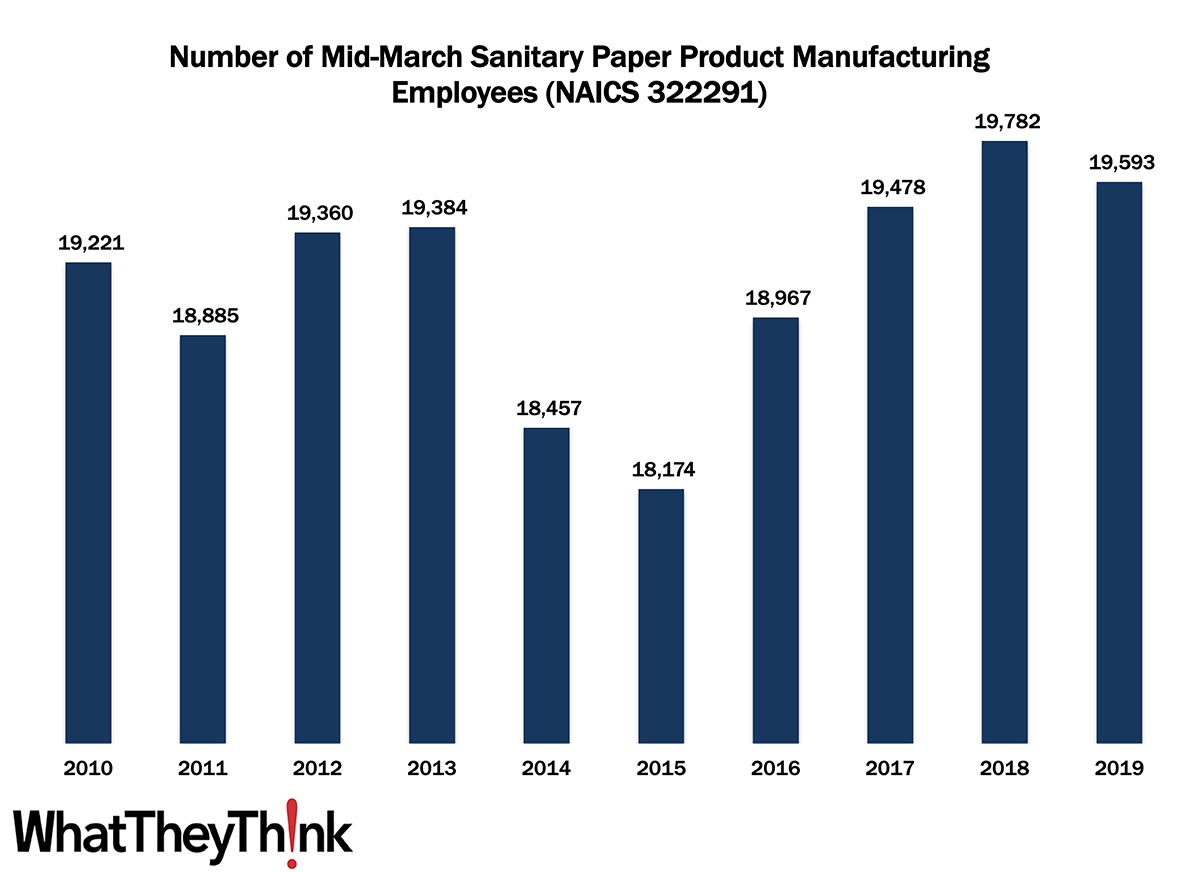
Sanitary Paper Product Manufacturing Employment—2010–2019
Published: January 14, 2022
According to County Business Patterns, in 2010, there were 19,221 employees in NAICS 322291 (Sanitary Paper Product Manufacturing establishments). This NAICS category bounced up and down over the course of the 2010s, ending with 19,593 employees in 2019. In macro news: CPI increased 0.5% in December. Full Analysis
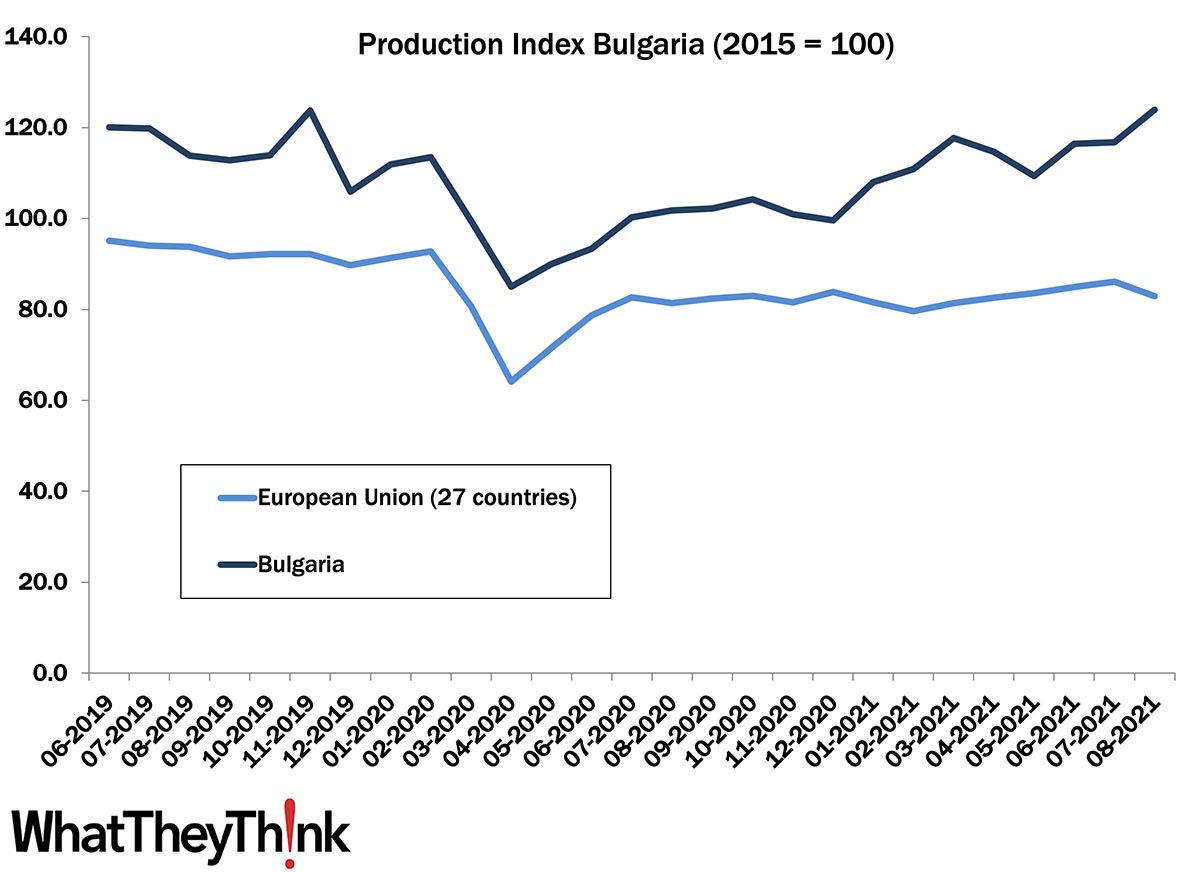
European Print Industry Snapshot: Bulgaria
Published: January 11, 2022
In this bimonthly series, WhatTheyThink is presenting the state of the printing industry in different European countries based on the latest monthly production numbers. This week, we take an updated look at the printing industry in Bulgaria. Full Analysis
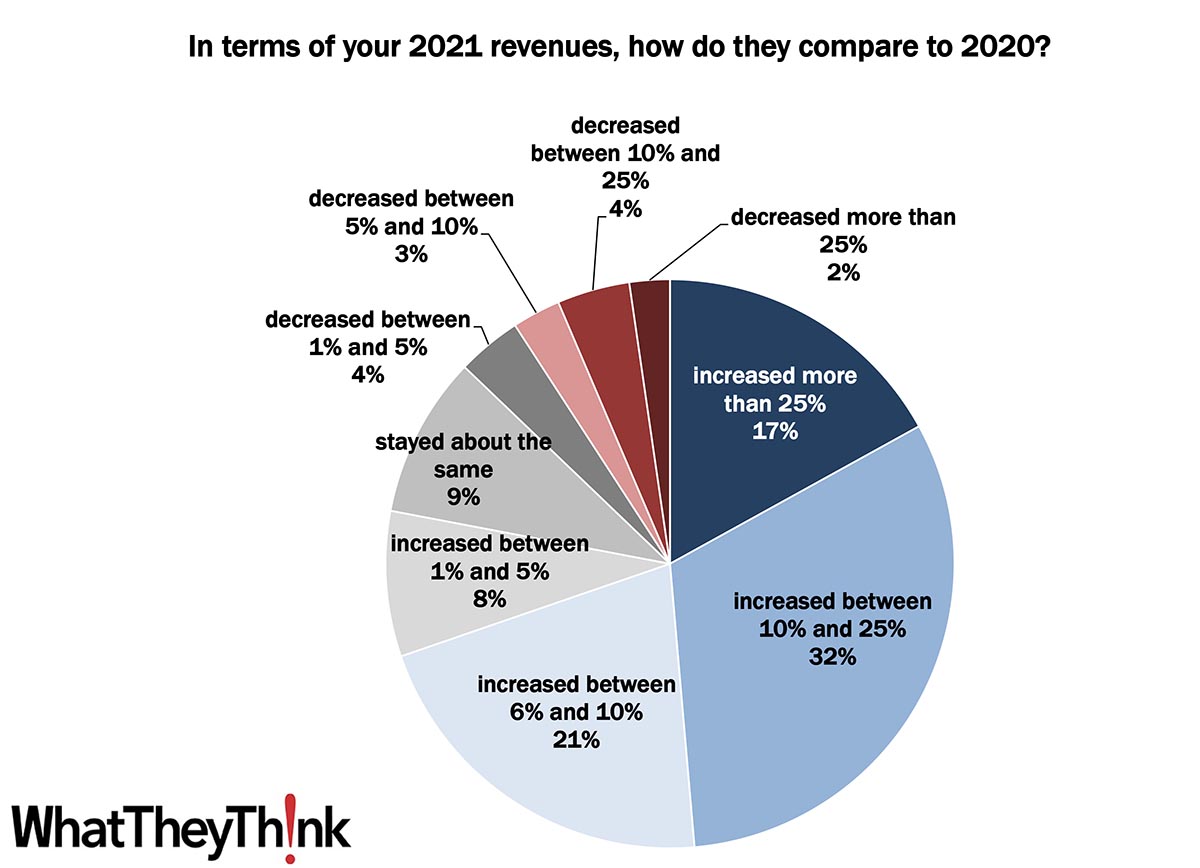
Preliminary 2021 Business Conditions: Help Ruin This Chart!
Published: January 7, 2022
We are sifting through the preliminary data from our 2021 Print Outlook Survey, and so far we have found that 17% of print businesses reported that revenues in 2021 increased more than 25% over 2020, and a further one-third (32%) saw revenues up 10–25%. But our survey is still open, so here is your chance to wreck this chart. Full Analysis
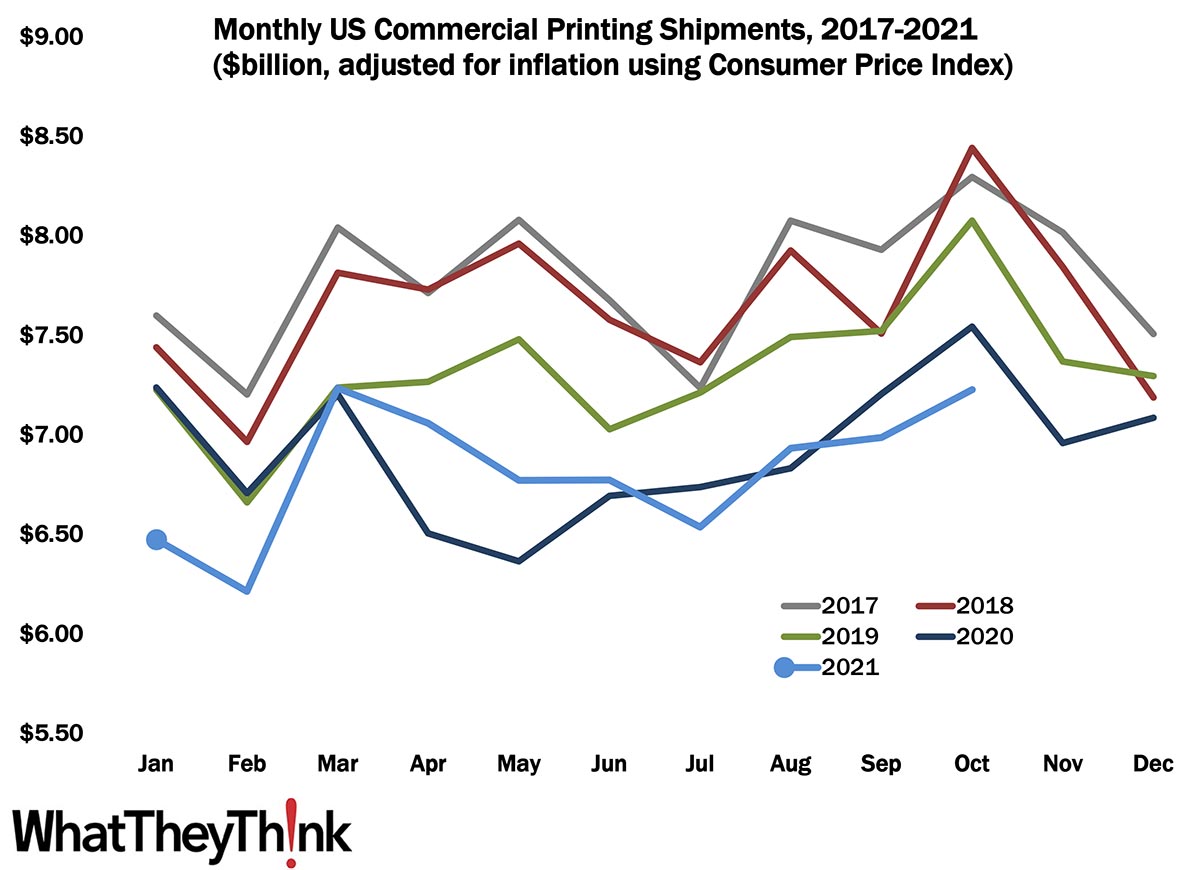
October Shipments: Still On the Rise
Published: December 17, 2021
October 2021 printing shipments came in at $7.23 billion, up from September’s $6.99 billion. This is the third month in a row in which shipments increased. Year to date, January-to-October shipments are $68.21 billion, a bit off 2020’s January-to-October number of $69.03. Unless November and December are higher than expected, 2021 will come in slightly below 2020. Full Analysis
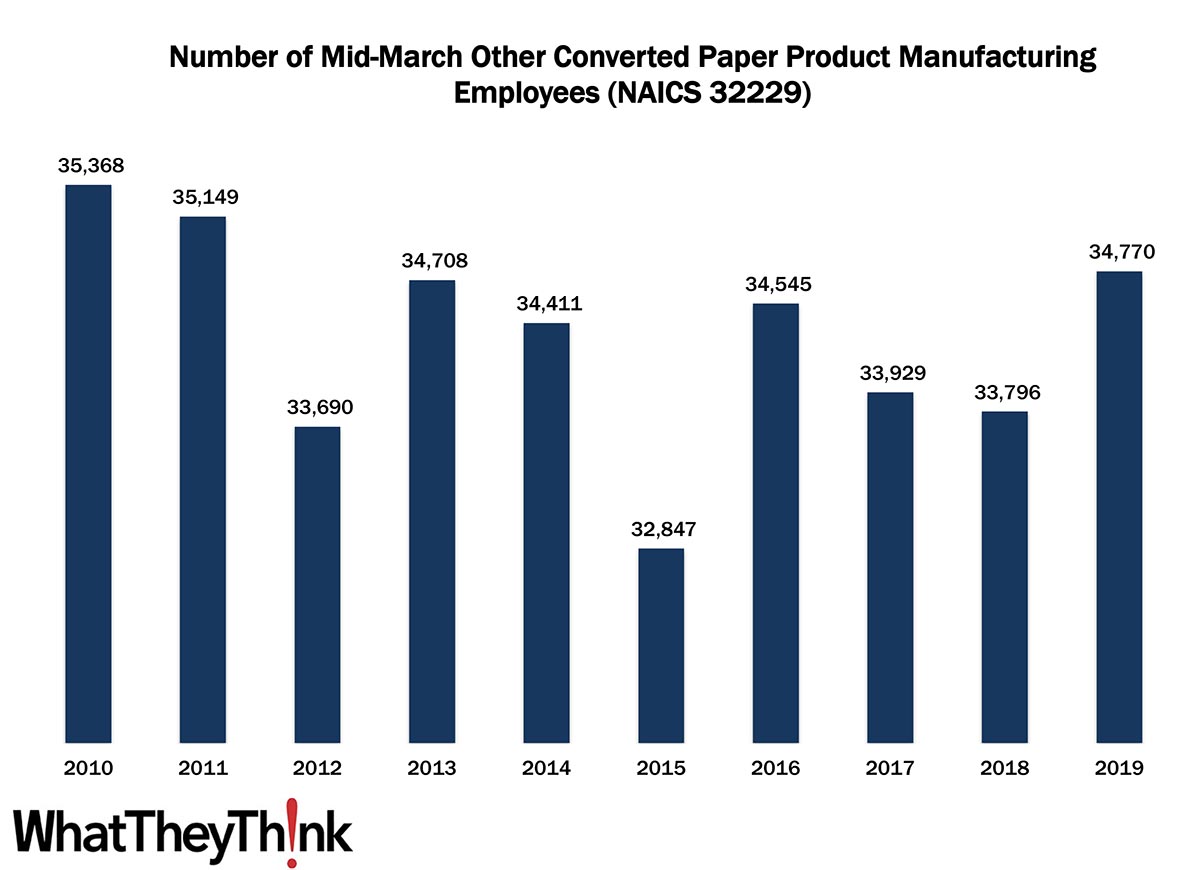
Other Converted Paper Product Manufacturing Employment—2010–2019
Published: December 10, 2021
According to County Business Patterns, in 2010, there were 35,368 employees in NAICS 32229 (Other Converted Paper Product Manufacturing establishments). This NAICS category bounced up and down over the course of the 2010s, ending with 34,770 employees in 2019. In macro news: Beige Alert! Full Analysis
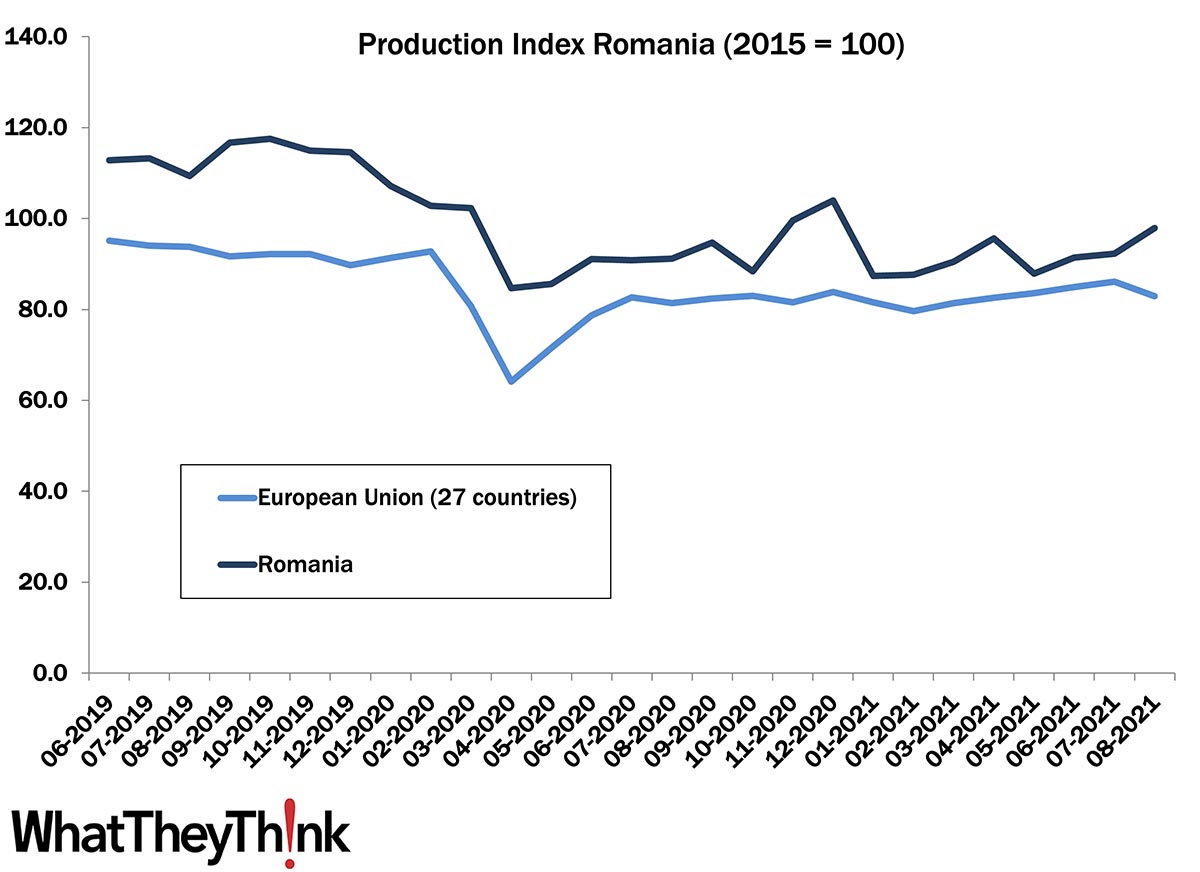
European Print Industry Snapshot: Romania
Published: December 7, 2021
In this bimonthly series, WhatTheyThink is presenting the state of the printing industry in different European countries based on the latest monthly production numbers. This week, we take an updated look at the printing industry in Romania. Full Analysis
October Graphic Arts Employment—Print Production Up, Non-Production Also Up
Published: December 3, 2021
In October 2021, all printing employment was up +1.0% from September, with production employment up +0.9%, and non-production printing employment up +1.2%. Full Analysis
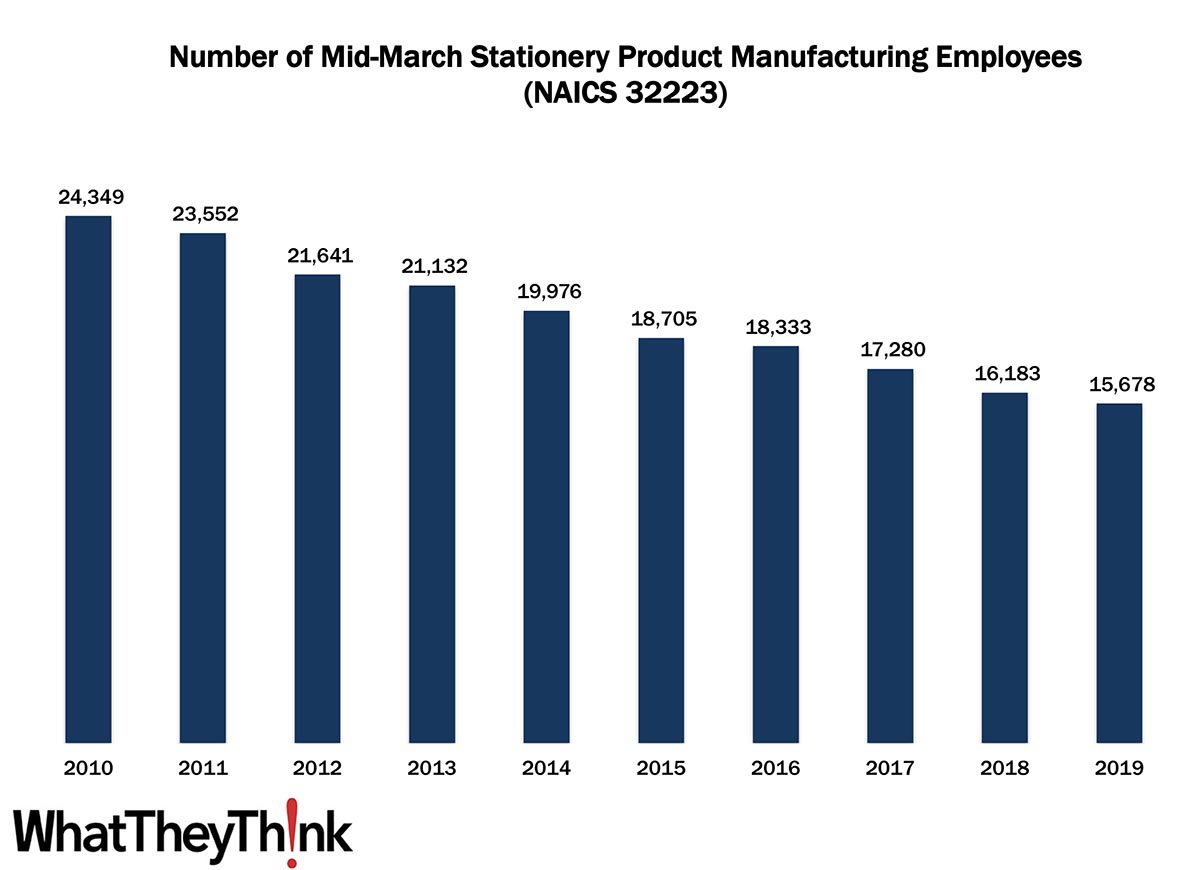
Stationery Product Manufacturing Employment—2010–2019
Published: November 19, 2021
According to County Business Patterns, in 2010, there were 24,349 employees in NAICS 32223 (Stationery Product Manufacturing establishments). This NAICS category declined slowly over the rest of the decade, ending with 15,678 employees in 2019. Also: following up a BoSacks tweet about newspaper circulation. Full Analysis
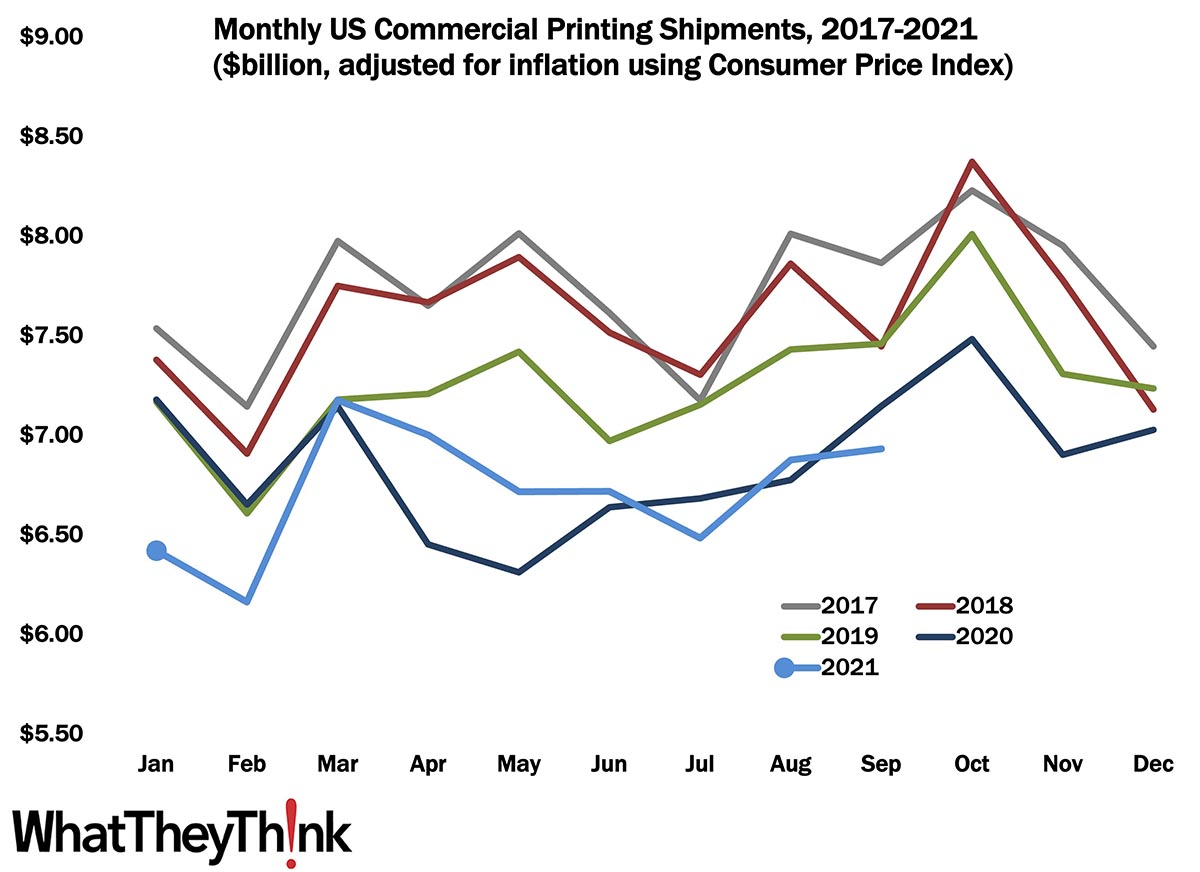
September Shipments: We Got Good News and We Got Bad News
Published: November 12, 2021
September 2021 printing shipments came in at $6.93 billion, up from August’s $6.87 billion. It’s not a massive increase, but we’ll take it. Year to date, January-to-September shipments are $60.48 billion, a bit off 2020’s January-to-September number of $60.97. Can we close the gap in Q4? Full Analysis
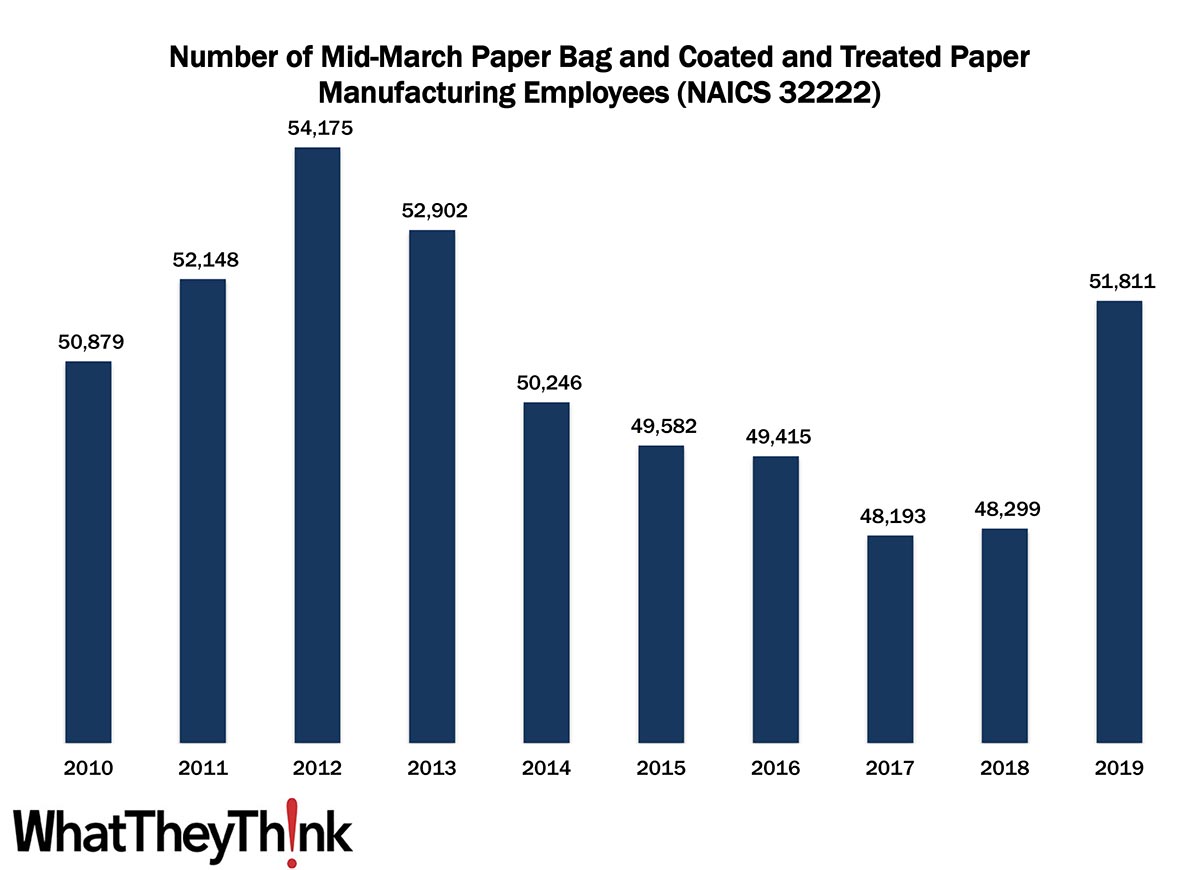
Paper Bag and Coated and Treated Paper Manufacturing Employment—2010–2019
Published: November 5, 2021
According to County Business Patterns, in 2010, there were 50,879 employees in NAICS 32222 (Paper Bag and Coated and Treated Paper Manufacturing establishments). This NAICS category peaked two years later at 54,175, declined slowly over the rest of the decade before shooting back up to 51,811 employees in 2019. In macro news, Q3 GDP growth is up 2.0%. Full Analysis
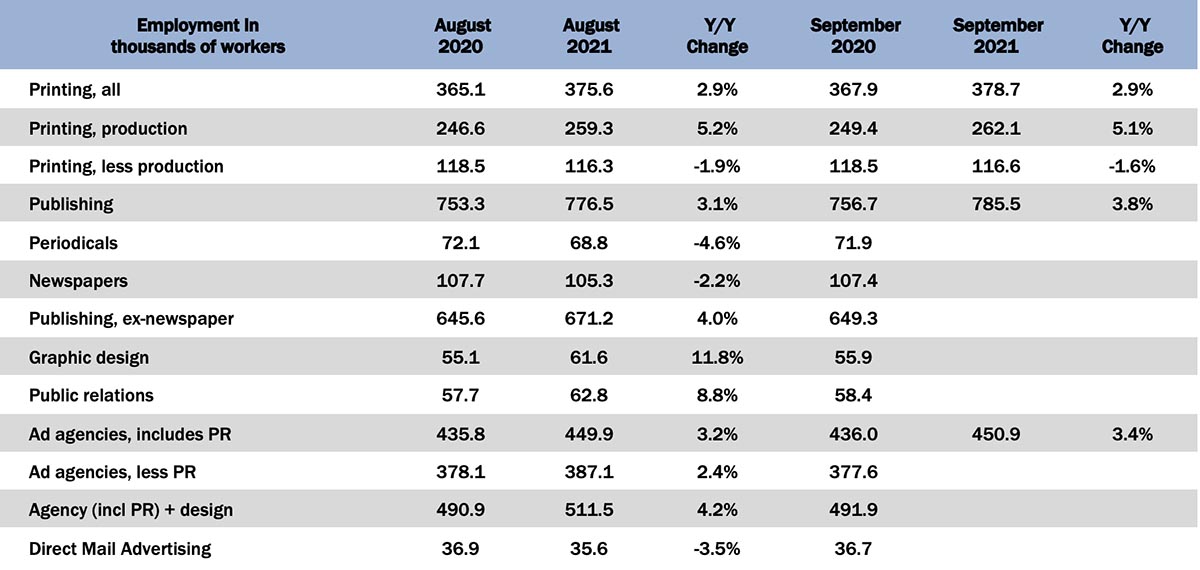
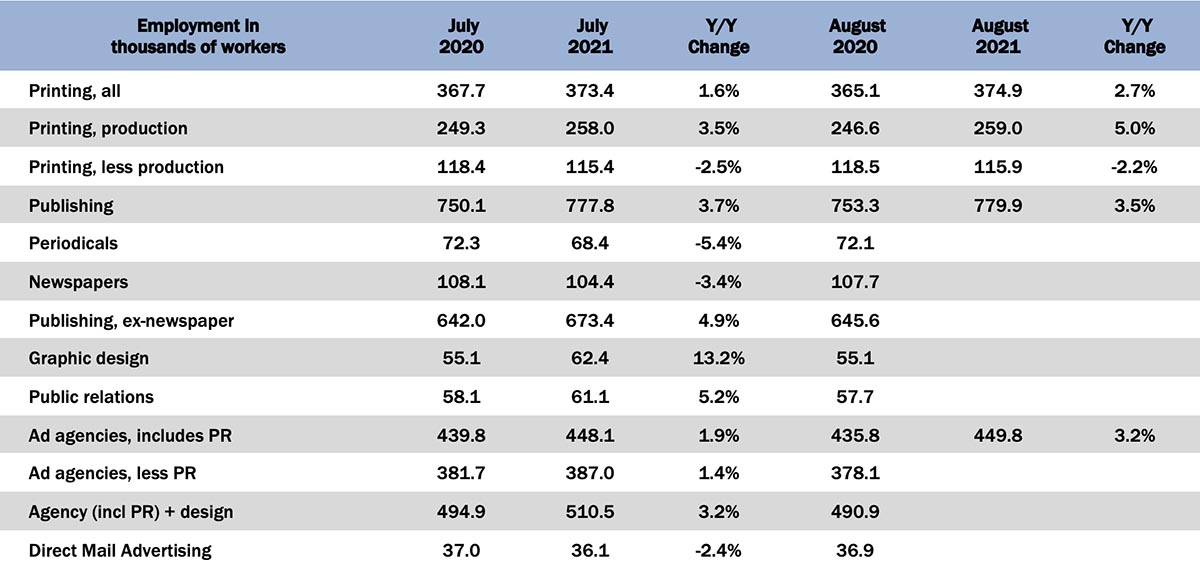
September Graphic Arts Employment—Print Production Up, Non-Production Down
Published: October 29, 2021
In September 2021, all printing employment was up +0.8% from August, production employment up +1.1%, and non-production printing employment up +0.3%. Full Analysis
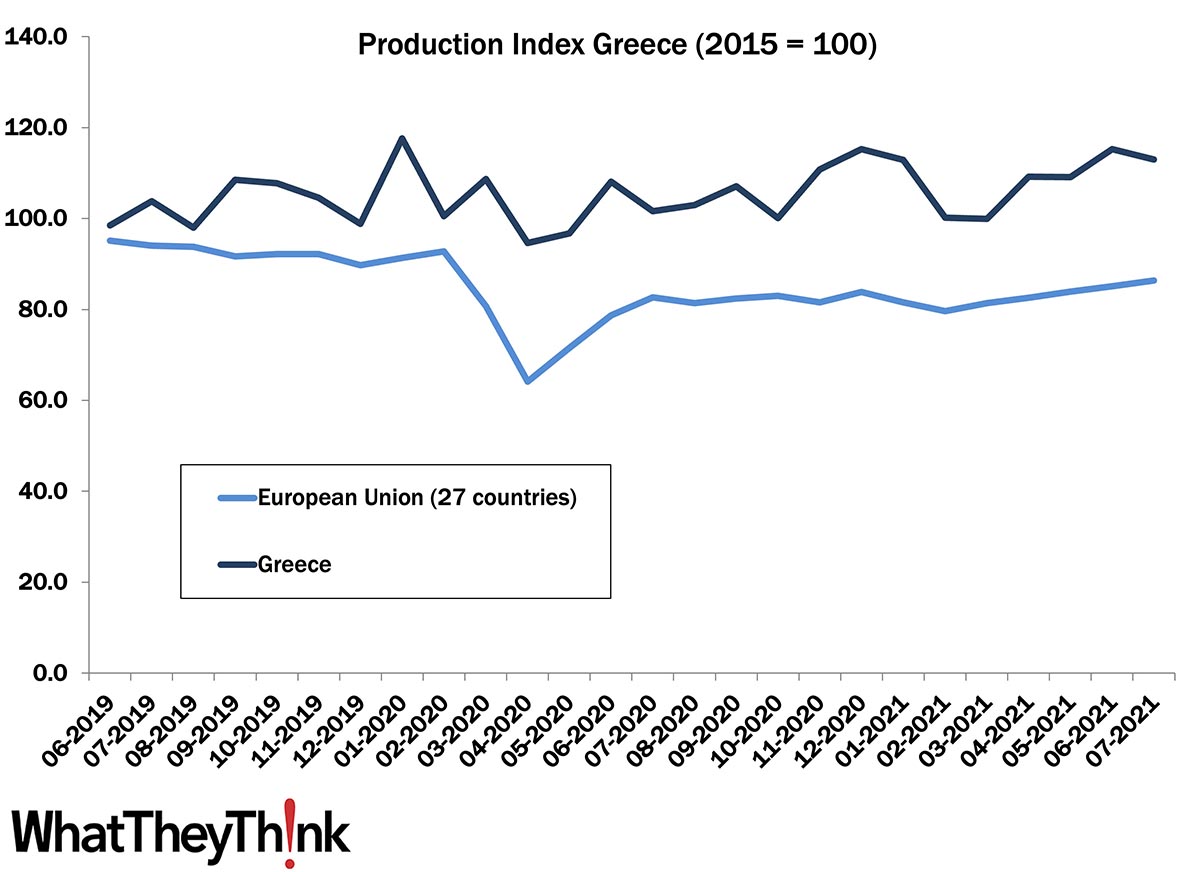
European Print Industry Snapshot: Greece
Published: October 26, 2021
In this bimonthly series, WhatTheyThink is presenting the state of the printing industry in different European countries based on the latest monthly production numbers. This week, we take an updated look at the printing industry in Greece. Full Analysis
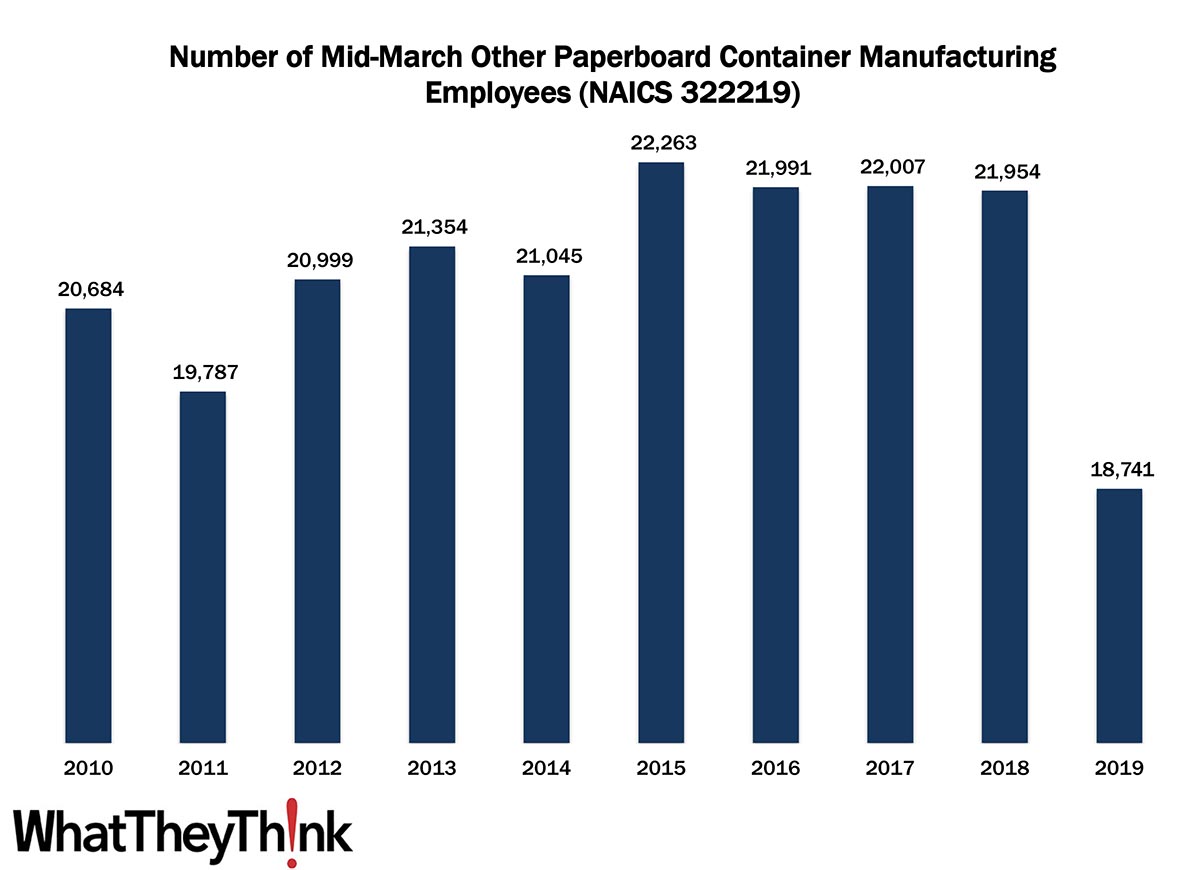
Other Paperboard Container Manufacturing Employment—2010–2019
Published: October 22, 2021
According to County Business Patterns, in 2019, there were 18,741 employees in NAICS 322219 (Other Paperboard Container Manufacturing establishments), a drop from 21,954 employees a year earlier, and the lowest ebb for this NAICS category. In macro news, new business formation goes “bezonkers.” Full Analysis
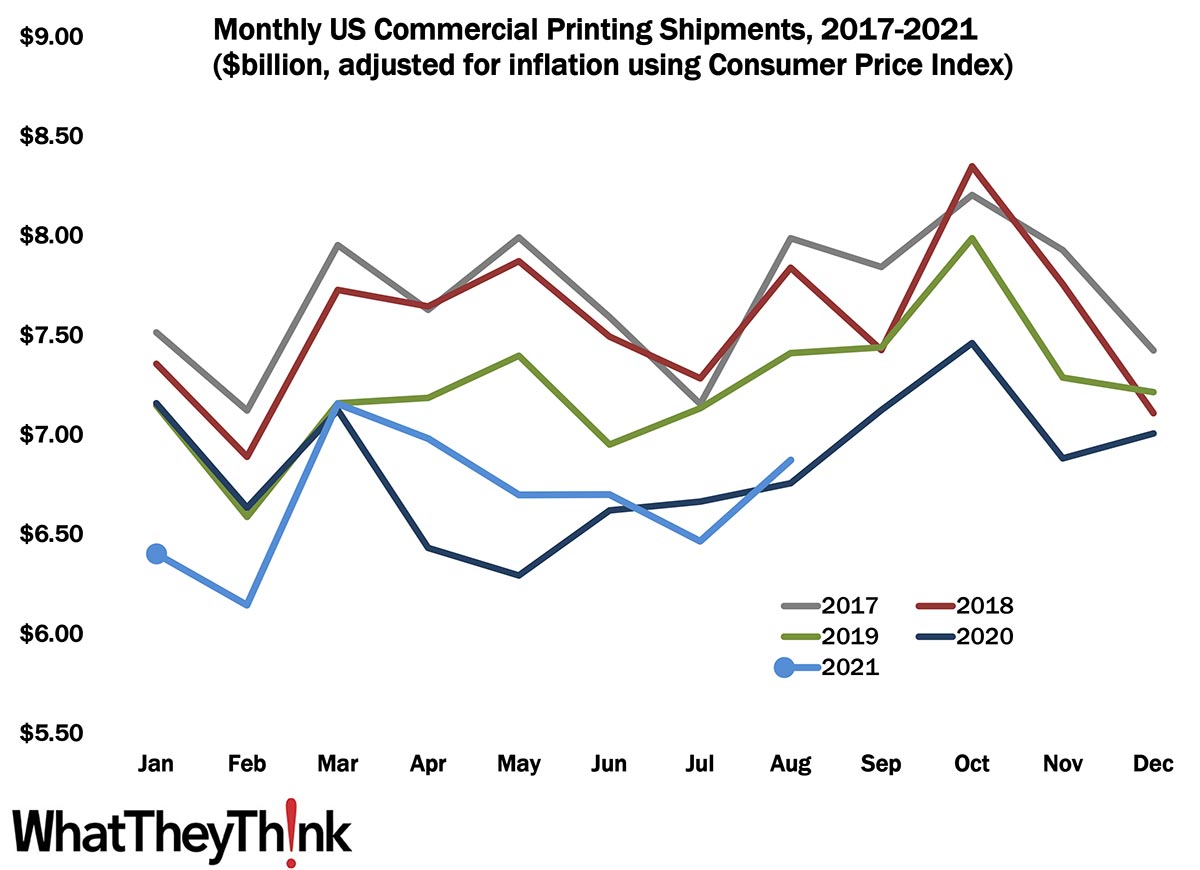
August Shipments: Summer Ends on a High Note
Published: October 15, 2021
August 2021 printing shipments came in at $6.87 billion, up from July’s $6.47 billion. Year to date, January-to-August shipments are $53.42 billion, not far off 2020’s January-to-August number of $53.68. Full Analysis
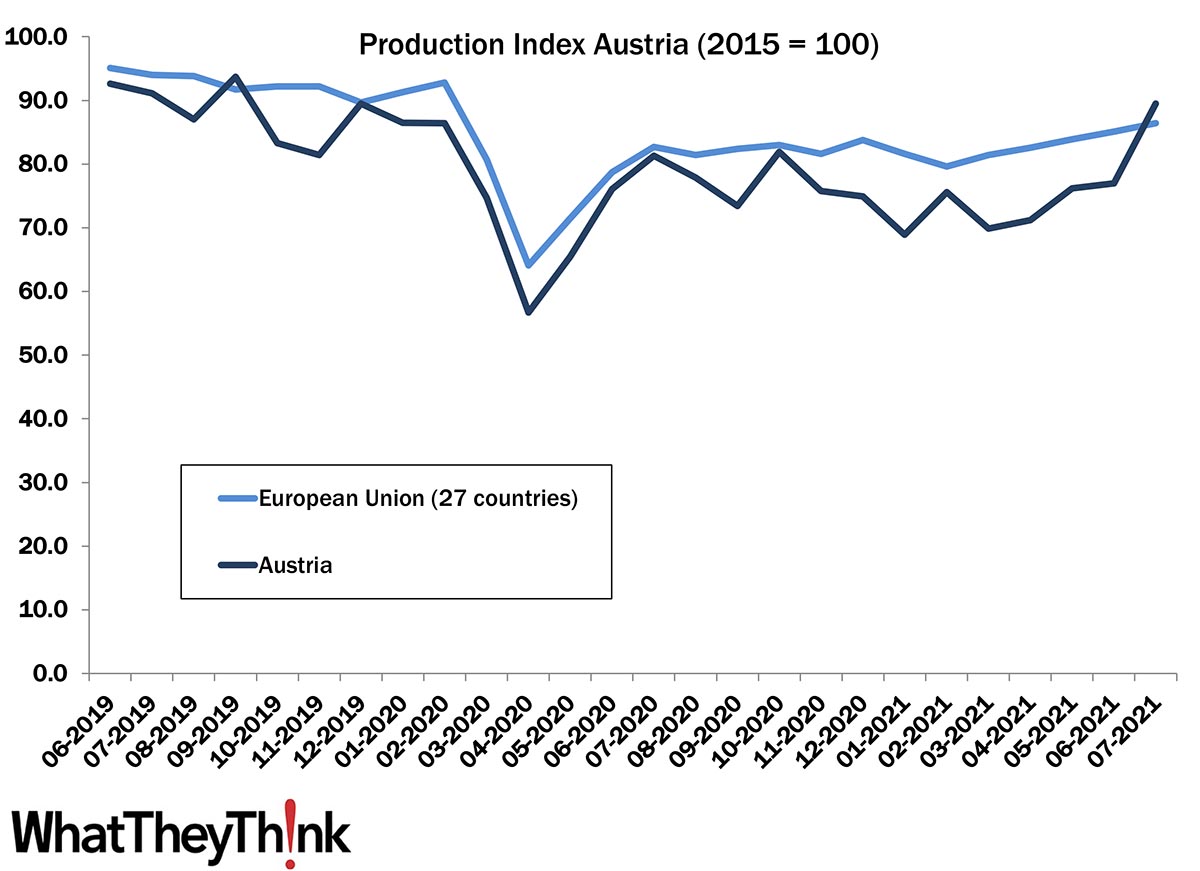
European Print Industry Snapshot: Austria
Published: October 12, 2021
In this bimonthly series, WhatTheyThink is presenting the state of the printing industry in different European countries based on the latest monthly production numbers. This week, we take an updated look at the printing industry in Austria. Full Analysis
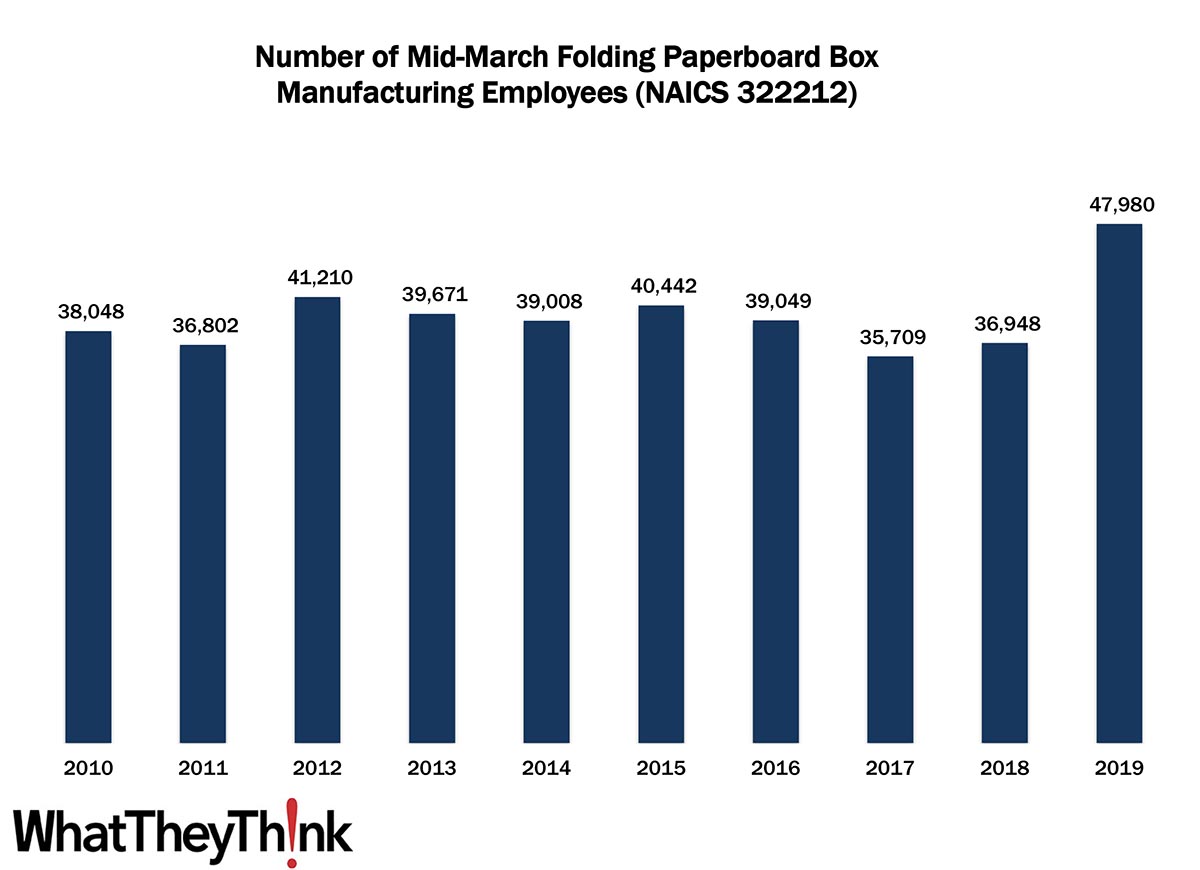
Folding Paperboard Box Manufacturing Employment—2010–2019
Published: October 8, 2021
According to County Business Patterns, in 2010, there were 30,048 employees in NAICS 322212 (Folding Paperboard Box Manufacturing establishments). Employment in this category stayed fairly steady throughout the decade, then spiked in 2019 to 47,980 employees. In macro news, sales of light vehicle sales plummeted in September 2021, even as profits reached record highs. Full Analysis
August Graphic Arts Employment—Staying on the Plateau
Published: October 1, 2021
In August 2021, all printing employment was up +0.4% from July, production employment up +0.4%, and non-production printing employment also up +0.4%. Full Analysis
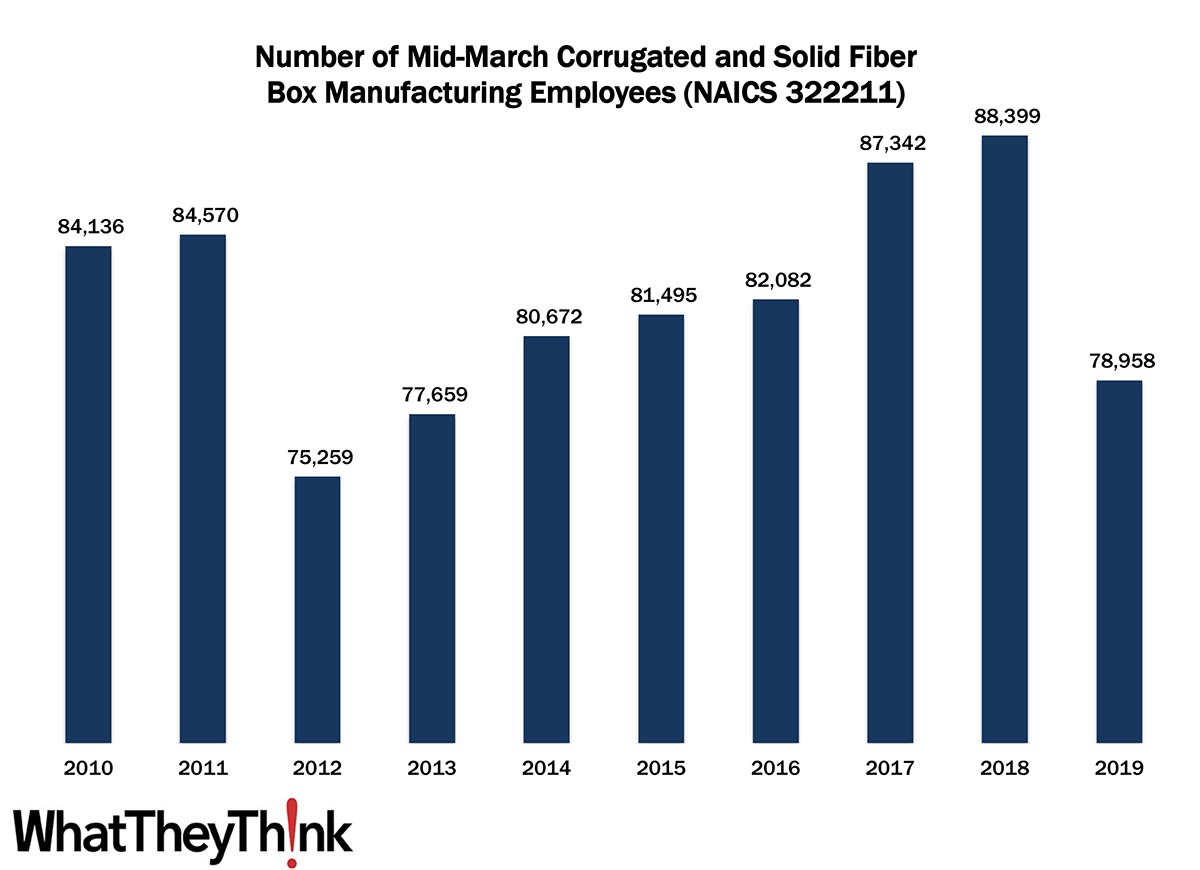
Corrugated and Solid Fiber Box Manufacturing Employment—2010–2019
Published: September 24, 2021
According to County Business Patterns, in 2010, there were 84,136 employees in NAICS 32221 (Corrugated and Solid Fiber Box Manufacturing establishments). Employment in this category dropped abruptly in 2012, then continued to rise over the course of the decade, peaking in 2018 at 88,399 before dropping again in 2019. In macro news, three estimates of Q3 GDP. Full Analysis
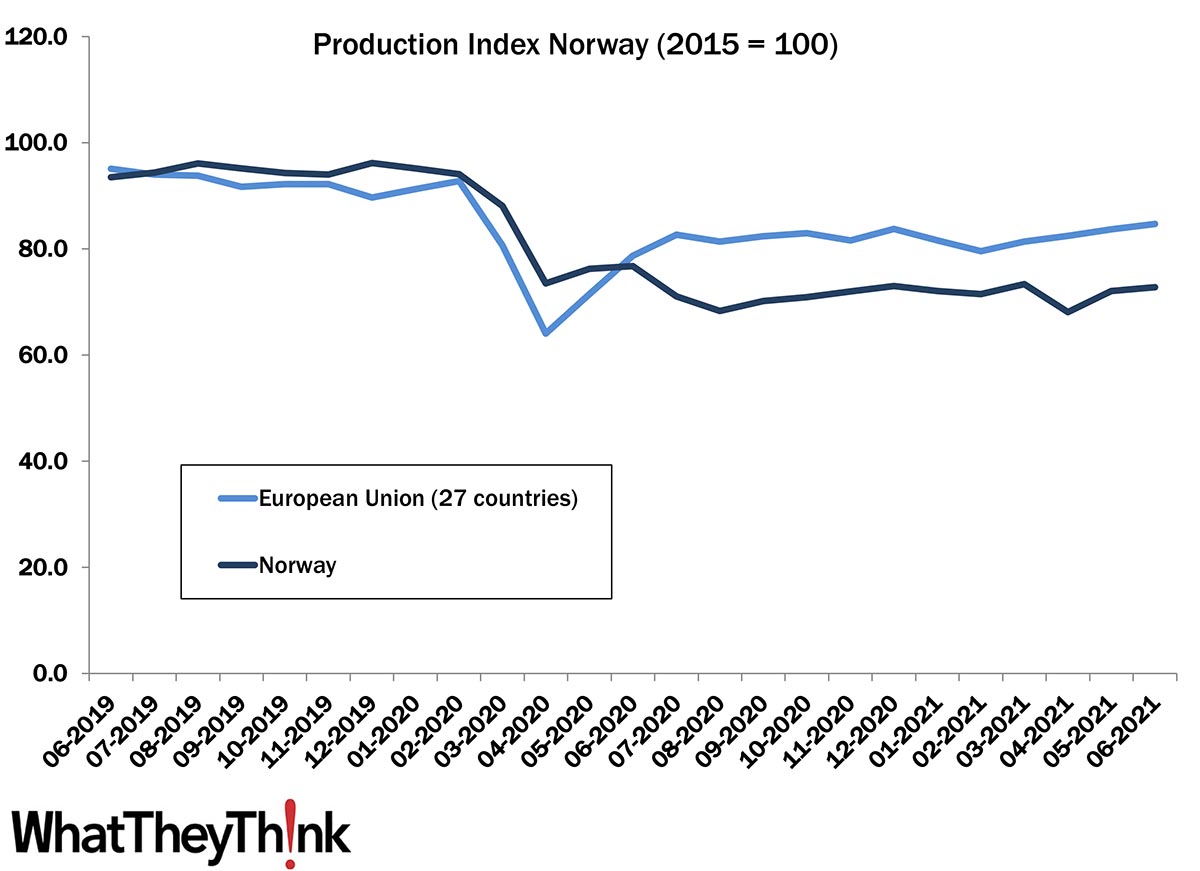
European Print Industry Snapshot: Norway
Published: September 21, 2021
In this bimonthly series, WhatTheyThink is presenting the state of the printing industry in different European countries based on the latest monthly production numbers. This week, we take a look at the printing industry in Norway. Full Analysis
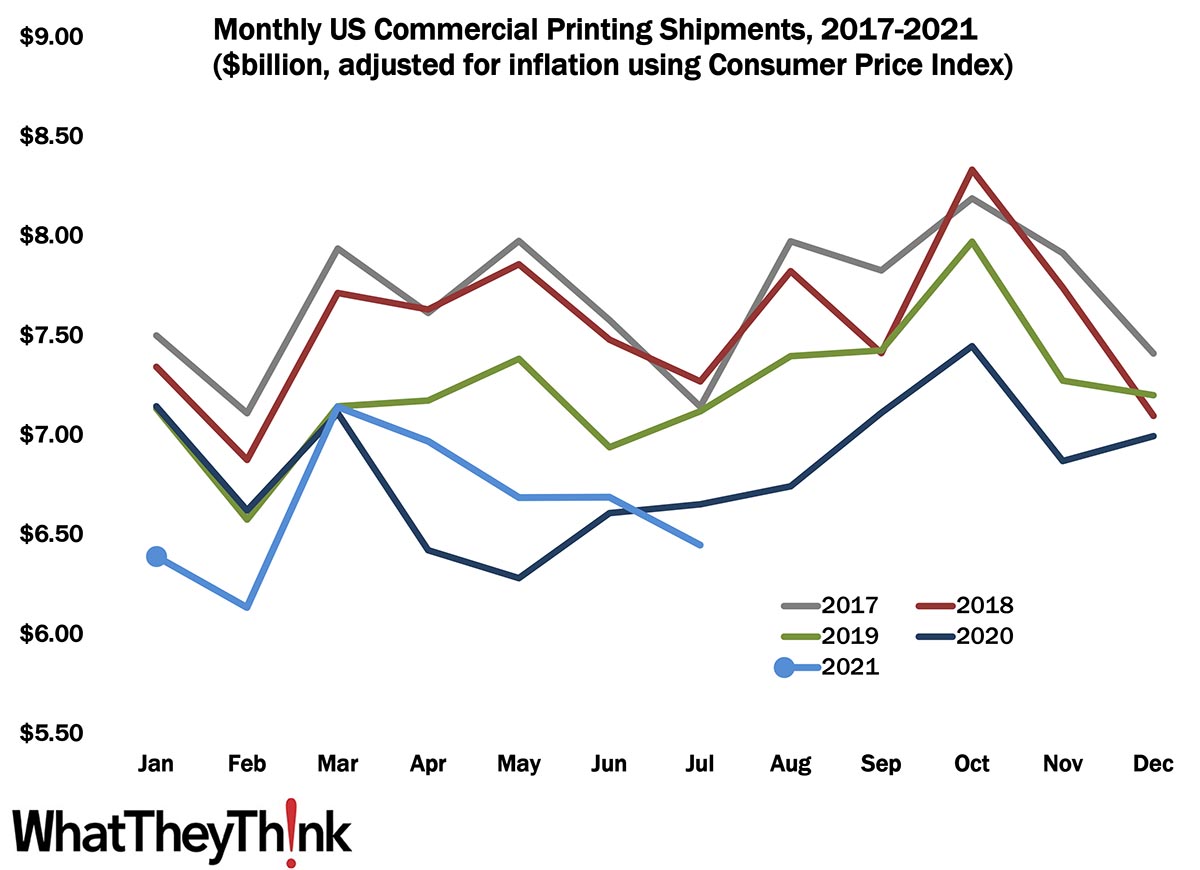
July Shipments: Back on the Decline
Published: September 17, 2021
July 2021 printing shipments came in at $6.45 billion, down from June’s $6.69 billion. Year to date, January-to-July shipments are $46.44 billion. At this point in 2020, year-to-date shipments were slightly higher at $46.83. The recovery is proving more challenging than the actual pandemic, it seems. Full Analysis
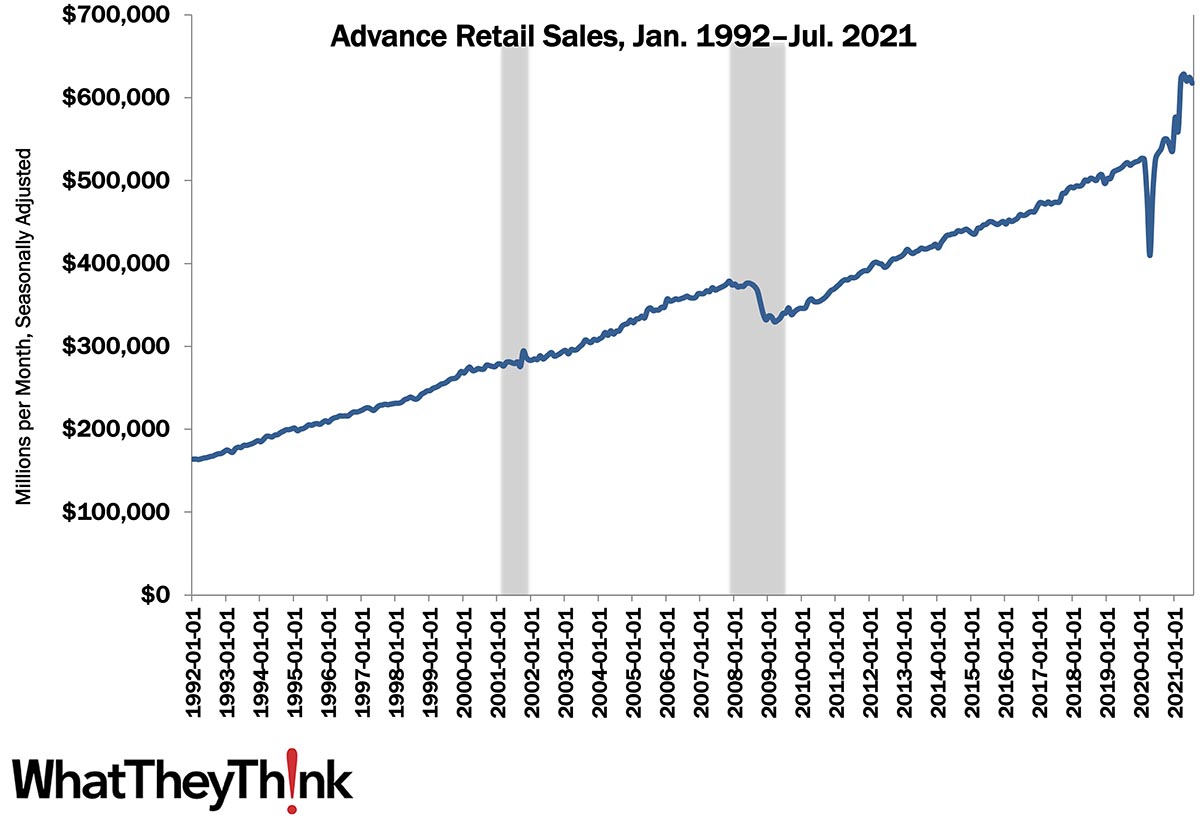
Two Indicators: Retail Sales and Industrial Production
Published: September 10, 2021
This week’s Friday data dump looks at two macroeconomic indicators that will give us some sense of how we are bouncing back from the pandemic—Retail sales and the Industrial Production Index. Full Analysis
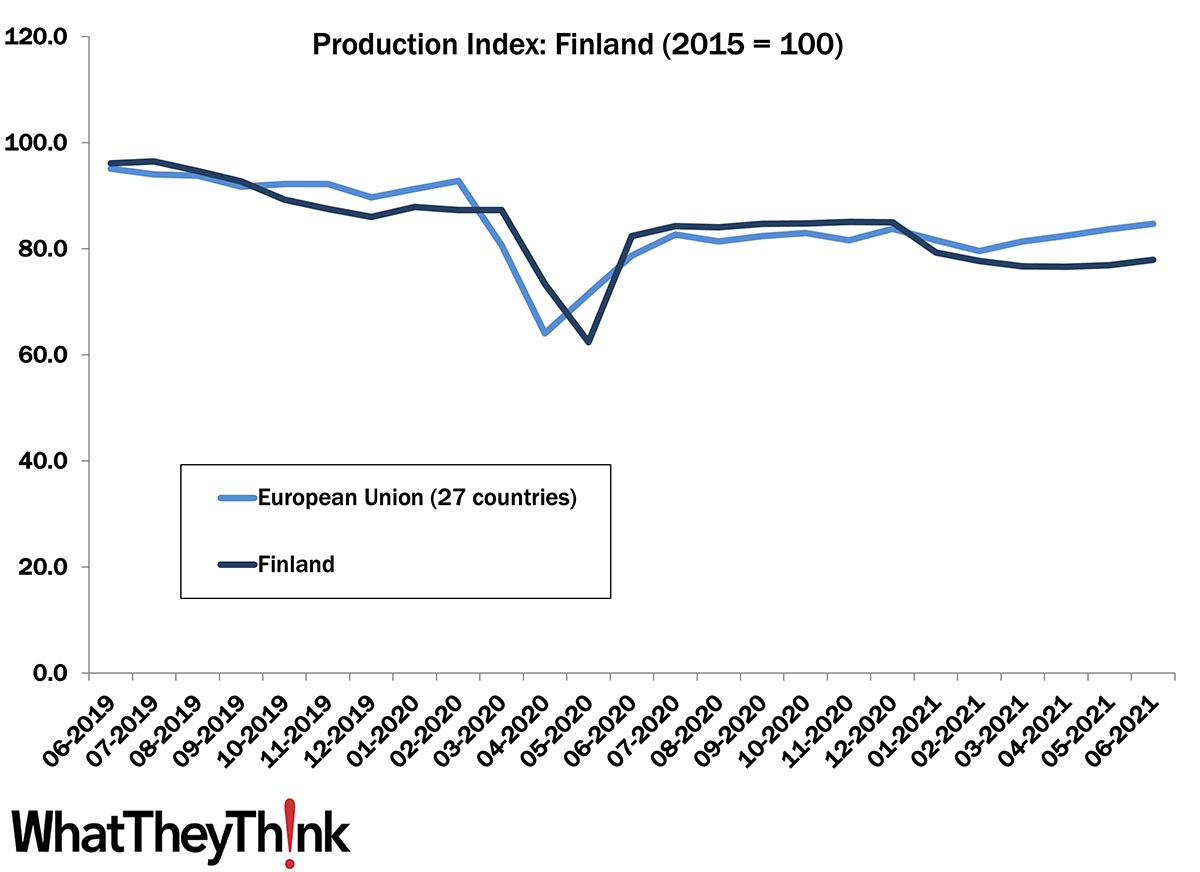
European Print Industry Snapshot: Finland
Published: September 7, 2021
In this bimonthly series, WhatTheyThink is presenting the state of the printing industry in different European countries based on the latest monthly production numbers. This week, we take a look at the printing industry in Finland. Full Analysis


![]()
- The Future of AI In Packaging
- Inkjet Integrator Profiles: DJM
- Spring Inkjet Update – Webinar
- Security Ink Technologies for Anti-Counterfeiting Measures
- Komori unveils B2 UV Inkjet
- Keeping Nozzles Fresh with Flow
- Komori to Unveil the J-throne 29 Next Generation Digital Press at drupa 2024
- Inkjet drives convergence of transactional and graphic arts applications

WhatTheyThink is the official show daily media partner of drupa 2024. More info about drupa programs
© 2024 WhatTheyThink. All Rights Reserved.