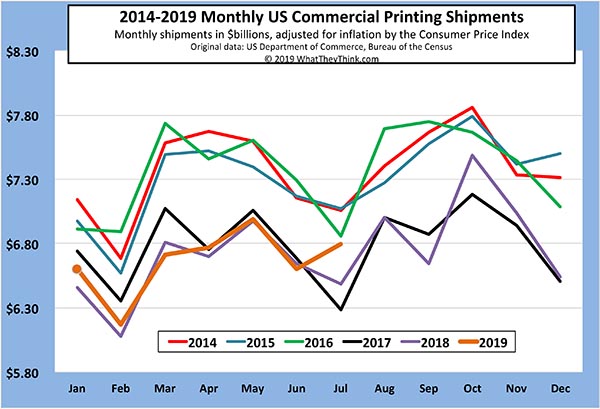
July printing shipments broke with what had become the new seasonality—and in a good way. The value of printing shipments for July 2019 was $6.8 billion—up from June’s $6.6 billion. No, that’s not a typo: shipments in July are in fact up from June. What has typically been one of the lowest months—if not thelowest month—of the year for printing shipments actually came in pretty good, and is even above July 2018’s $6.5 billion and well above July 2017’s $6.3 billion.
As a result, year-to-date shipments for 2019 continue to stay ahead of 2018—January-to-July shipments for 2019 are at $46.64 billion compared to 2018’s $46.13, although the gap is closing.
This is pretty good news—here’s hoping August shipments return us to our regularly scheduled seasonality. We’d rather not be unpleasantly surprised.
Still, we do have to caution—aswe always do—that NAICS 323 (which is what these shipments data are based on) isn’t necessarily the only printing-related three-digit NAICS anymore. Some shops are classifying themselves in different kinds of services NAICS, and wide-format and sign manufacturers have their own NAICS classifications. Different parts of the industry are diverging from NAICS 323, which makes tracking industry statistics that much more of a challenge, and can make the industry seem much gloomier than it really is—even though NAICS 323 doesn’t look all that gloomy at the moment, certainly compared to the not-too-distant past.