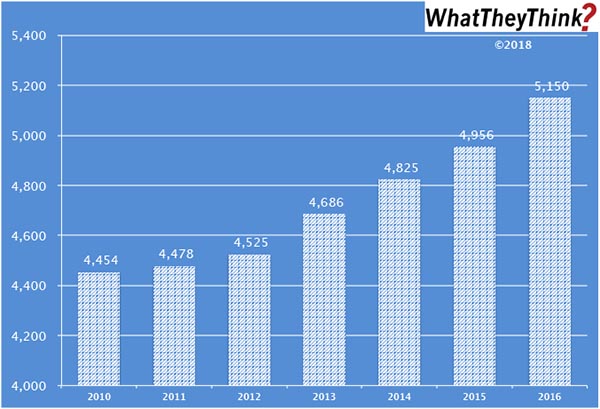
From 2010 to 2016, the number of U.S. commercial screen printing establishments (NAICS 323113) increased from 4,454 to 5,150. Growth in screen printing establishments has been consistent from year to year. This is almost exactly the opposite of general commercial printing, where establishments have been consistently declining.
This is evidence of the rise of specialty printing. Screen is commonly used to print on textiles (T-shirts being the emblematic example), and these kinds of items have started to take off in the past decade. Couple this with the rise of short-run and digital technologies that can complement screen, and as demand for specialty items has increased, establishments have grown to take advantage of this hot print application area. It’s very common to find hybrid screen/digital shops, and even hybrid screen/digital workflows for the same products—kind of like the “digital printing on offset shells” approach that used to be very popular (and still exists to a large extent) among commercial printers. And let’s also not forget the growth of industrial printing, in which screen (and pad) printing also play a very large role.
The data in this chart is gleaned from our Commercial Printing Establishments, which complements and supplements our regular tracking of printing industry shipmentsand other industry data. Based on data from the Census Bureau’s County Business Patterns, we present—in spreadsheet form—U.S. commercial printing establishments from 2010 to 2016, including establishment counts for six commercial printing business classifications (based on NAICS, the North American Industrial Classification System):
- 323 (Printing and Related Support Activities)
- 32311 (Printing)
- 323111 (Commercial Printing, except Screen and Books)
- 323113 (Commercial Screen Printing)
- 323117 (Books Printing)
- 32312 (Support Activities for Printing—aka prepress and postpress services)
We further break these counts down by establishment size:
- 1–4 employees
- 5–9 employees
- 10–19 employees
- 20–49 employees
- 50–99 employees
- 100–249 employees
- 250–499 employees
- 500–999 employees
- 1000 employees
These data, and the overarching year-to-year trends, like other demographic data, can be used not only for business planning and forecasting, but also sales and marketing resource allocation.
Every other week, we will be breaking these establishment data down in different ways. Over time, we will be adding additional data from the County Business Patterns, such as number of employees, payroll, and similar information for additional business classification of relevance to the graphic communications industry.