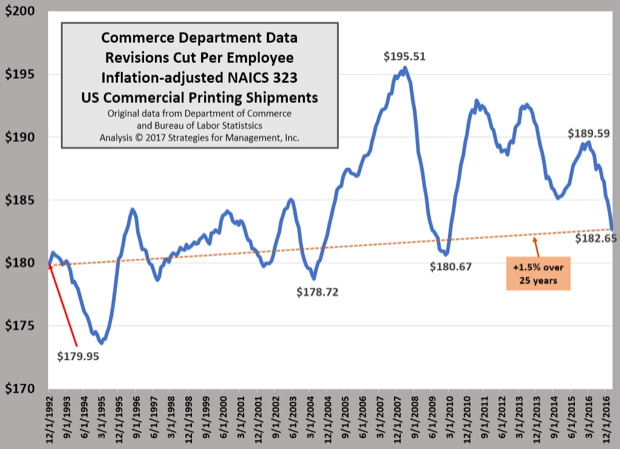
The Commerce Department’s revisions to industry shipments show a much different picture of a key metric for the industry, sales per employee. The chart was created using 12-month moving totals of inflation-adjusted shipments and the 12 month moving average of total industry employment.
The latest reading through March 2017 is $182.65K per employee, a meager +1.5% higher than it was at the end of 1992. It fell from a peak of $195.51K which was just before the burst of the housing bubble, the rise of social media platforms, tablets, and smartphones. The fall in this calculation has some interesting characteristics. Historically, large printing businesses focused on magazines, catalogs, and newspaper inserts, had sales per employee that were significantly higher than the industry averages, anywhere from 30% to 50% higher.
The commercial screen printing industry, though small in relative terms, has been relatively steady as other commercial segments have declined. This industry has the lowest average sales per employee. Therefore the decline in this metric may reflect the changing fortunes and relationships of industry segments and not an across-the-board decline. Remember: the most profitable printing businesses have always had fewer employees than others of the same shipment levels, representing wiser capital investment, better product mix, and overall better management. There is rarely one specific action that makes them more profitable, but incremental actions throughout every function and process that are better than others. This makes their shipments per employee higher than their less profitable competitors.