The financial markets were rattled a little bit by the recent minutes of the Fed meeting where they discussed the unwinding of their interventions and the ballooning of their balance sheet.
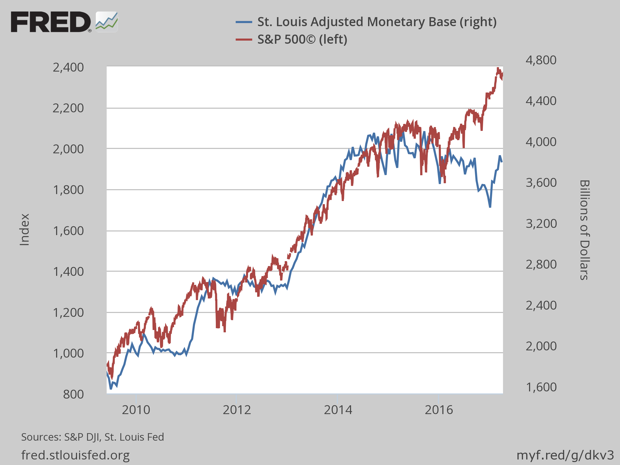
The data are reflected in the St. Louis Fed Adjusted Monetary Base. The chart shows how the run-up in the S&P 500 stock index relates to the Fed’s quantitative easings. Note the recent divergence since around the time of the election, as the euphoric interest in corporate tax reform and regulatory changes played out in the rise in stocks.
The increase in the S&P 500 was caused by a “TINA” rally. Because interest rate returns were so low, investors could not get their usual returns, leaving stocks as their alternatives. “TINA” meant “There Is No Alternative” for investors other than equities. Those lower interest rates also meant that S&P companies could engage in financial engineering, refinance old high-rate debt at much lower rates, and borrow money to pay for stock buybacks.
While the rise in stock prices is real, it is not organic on a general basis. Sales per share of the S&P 500 is still below 2007 levels. (Trivia: How many companies are in the S&P 500? 505!) The Fed is most likely to go slow in the process, allowing the obligations it purchased to mature and no longer replace them. Unless there is movement toward tax reform, there is a strong chance that the S&P will revert to its path of following the Fed.


