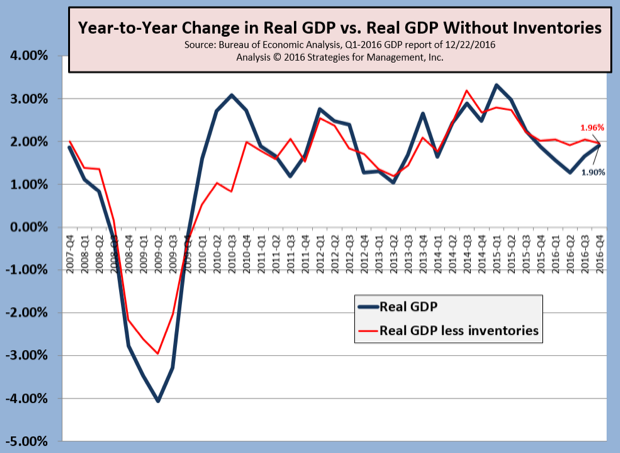
The fourth quarter of 2016 ended quiently, with a growth rate of +1.9% compared to the third quarter. That brought 2016 to an overall growth rate of +1.6%. Inventories played a role in the rise; after deducting that change, underlying growth was +0.9%. This was the first release of 4Q-2016 data, the “advance report,” and it will be followed by two more revisions over the next sixty days. It is likely that this first report will be revised up, as the Atlanta Fed GDPNow had forecasted a +2.9% rise, a significant miss for that measure.
The chart shows our preferred way of looking at real GDP, on a year-to-year basis, with and without net inventories. It shows that the underlying growth level of the economy is just under +2%, and that on an overall the bulk of any inventory distortion has worked its way through the system. Without inventories, the economy was at a +1.96% pace, and with inventories, it was +1.90%.
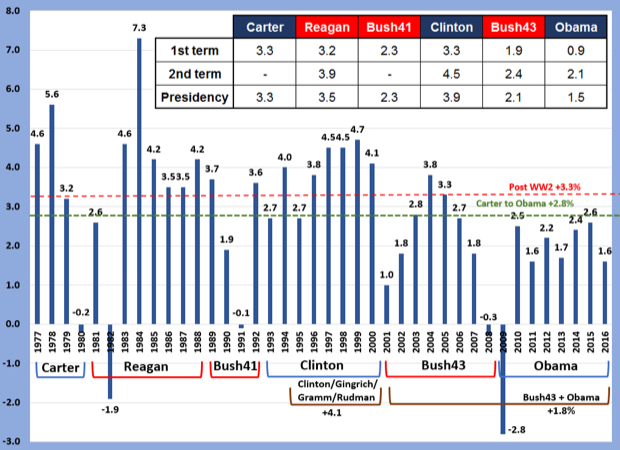
Last week, we published a chart and commentary showing real GDP growth for the last six presidential administrations. The chart has been updated for this latest GDP release and we have labeled the chart with more detail. GDP will be revised twice more in the next two months, and then there is a major revision in July which can go back decades; this chart will be updated at that time.
On the better news front, durable goods orders excluding transportation equipment has been up for two consecutive months after many months of decline on a current dollar basis.


