Real Interest Rates are Rising, Thanks to Low Inflation
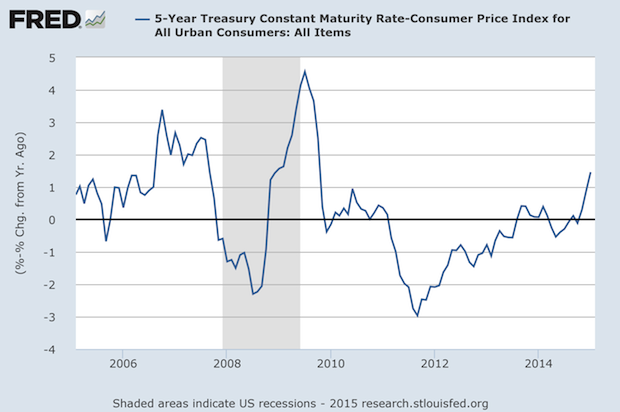
The chart shows one of the rates for Treasury securities called the “constant maturity rate,” used to set rates for instruments like mortgages. The line in the chart is that monthly rate less the year-to-year change in the Consumer Price Index for that month. The Fed has worked hard to keep their interest rates below inflation to stimulate the economy, as well as make housing prices rise so that fewer mortgages were “under water.” It hasn't worked that well, but that's a different topic for a different day. But with all of the worries about the Fed raising rates, the combination of their inertia and changes in the inflation rate may be producing what they've wanted: a Seinfeldian case of “nothing” becoming something. At the end of 2011 the real rate in the chart was -3%, and the last observation in the chart is about +1.5%, a 450 basis point move. For about three years, the CPI has been below the Fed's target of 2%, and in December and January it was negative. February CPI was just reported as an annualized 2.4%, so this rate rise may disappear soon
The chart shows one of the rates for Treasury securities called the “constant maturity rate,” used to set rates for instruments like mortgages. The line in the chart is that monthly rate less the year-to-year change in the Consumer Price Index for that month. The Fed has worked hard to keep their interest rates below inflation to stimulate the economy, as well as make housing prices rise so that fewer mortgages were “under water.” It hasn't worked that well, but that's a different topic for a different day. But with all of the worries about the Fed raising rates, the combination of their inertia and changes in the inflation rate may be producing what they've wanted: a Seinfeldian case of “nothing” becoming something. At the end of 2011 the real rate in the chart was -3%, and the last observation in the chart is about +1.5%, a 450 basis point move. For about three years, the CPI has been below the Fed's target of 2%, and in December and January it was negative. February CPI was just reported as an annualized 2.4%, so this rate rise may disappear soon