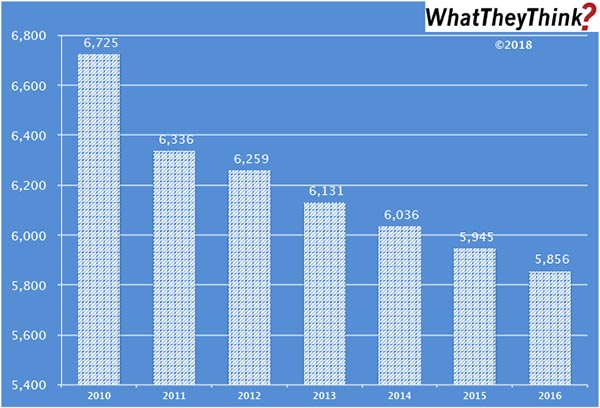
At the beginning of this month, we launched our new Commercial Printing Establishments tracker by looking at 1–9-employee establishment trends over the course of the 2000s. Two weeks ago, we looked at the other end of the spectrum, 50+-employee establishments. But what about the guys in the middle? In 2010, there were 6,725 10–19-employee establishments. Among this demographic category, there was the most precipitous drop from 2010 to 2011—the fallout from the Great Recession which started to take its toll after 2009. By 2012, the bleeding had been largely stanched, and the year-to-year declines were more modest. Still, it wasn’t all blood; businesses in this demographic tend to be among the most nimble and innovative, whether it be on the software side or by being early adopters of new print technologies, and thus are attractive to larger entities looking to adopt these new areas without necessarily investing in these capabilities directly. There is also a lot of intra-demographic consolidation; larger mid-size businesses acquiring slightly smaller mid-size businesses.
Although the declines look dramatic (as Darrell Huff could tell you, mind your y-axis), from 2000 to 2016, mid-size establishments dropped -13%—the same percentage as 50+-employee establishments, and less than 1–9-employee establishments, which declined -17% in this same period.
The data in this chart is gleaned from our which complements and supplements our regular tracking of printing industry shipments and other industry data. Based on data from the Census Bureau’s County Business Patterns, we present—in spreadsheet form—U.S. commercial printing establishments from 2010 to 2016, including establishment counts for six commercial printing business classifications (based on NAICS, the North American Industrial Classification System):
- 323 (Printing and Related Support Activities)
- 32311 (Printing)
- 323111 (Commercial Printing, except Screen and Books)
- 323113 (Commercial Screen Printing)
- 323117 (Books Printing)
- 32312 (Support Activities for Printing—aka prepress and postpress services)
We further break these counts down by establishment size:
- 1–4 employees
- 5–9 employees
- 10–19 employees
- 20–49 employees
- 50–99 employees
- 100–249 employees
- 250–499 employees
- 500–999 employees
- 1000 employees
These data, and the overarching year-to-year trends, like other demographic data, can be used not only for business planning and forecasting, but also sales and marketing resource allocation.
Every other week, we will be breaking these establishment data down in different ways. Over time, we will be adding additional data from the County Business Patterns, such as number of employees, payroll, and similar information for additional business classification of relevance to the graphic communications industry.


