The annual multi-year revision of US GDP data was released on Friday. The new data reflect more complete reporting of the thousands of data series that are used in the calculation of GDP and less reliance on estimated data. The revisions cover GDP from 2013 to the present reporting.
We prefer to look at GDP data on a year-to-year comparison rather than the quarter-to quarter data that are used in the general business press. This narrows the sometimes volatile nature of the data and offers a better sense of the long-term direction of the economy.
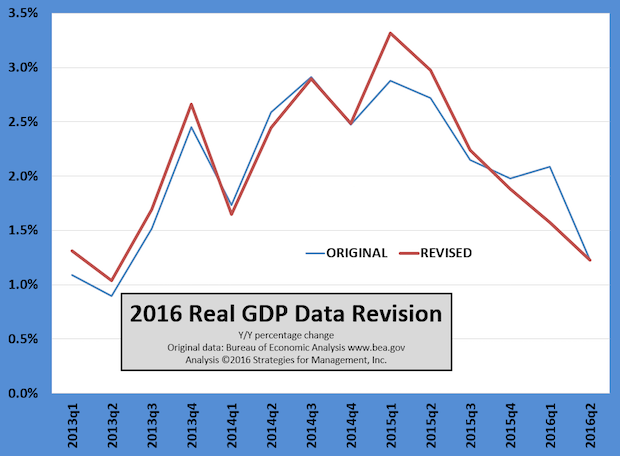
These latest data show slightly better economic performance in 2013, slightly worse in 2014, and a sharper decline in growth to the present time than previously reported. The most recent peak in the growth rate for this and other data was at the end of 2014 and the beginning of 2015.
One of the problems with GDP has been net inventories. Businesses have been having trouble judging how much inventory they need, partly because business forecasters have been consistenly overestimating the strength of the economy. That creates an inventory buildup that eventually is corrected. Building inventories increases GDP, and depleting inventories decreases it. Theoretically, inventories should have no impact on GDP because businesses would have perfect knowledge of the goods consumers want and the time and place of that fulfillment.
That's impossible, of course, because the logistics and manufacturing of all goods and services take time. Managing that process is an inherent risk of business, and is why we plan and forecast.
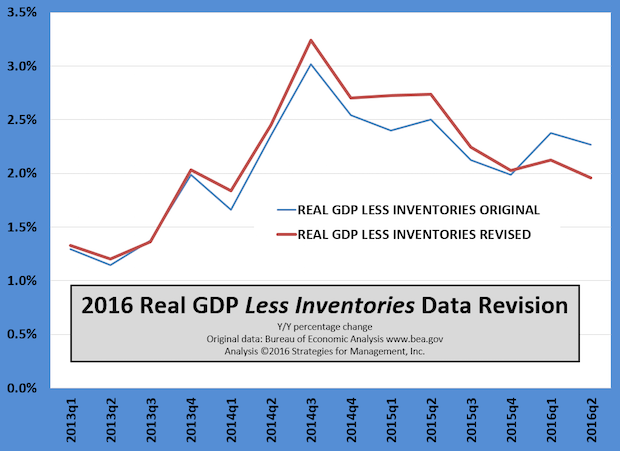
For the past few years we have been looking at GDP without inventories, and it shows a peak in growth in Q3-2014 and a decline since. It shows GDP revised higher for almost the second half of 2013 through 2015.
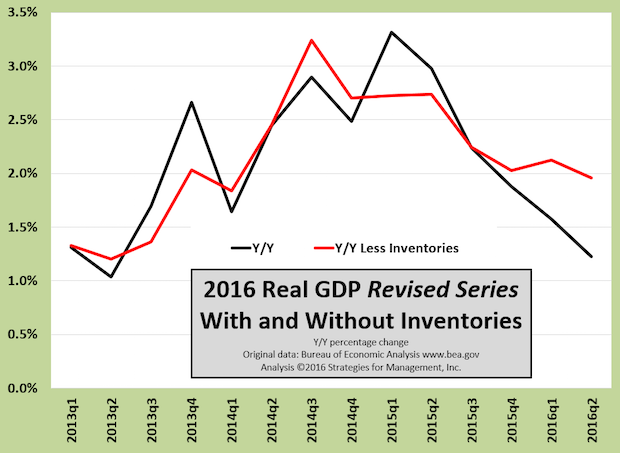
This next chart is the new data series only, and shows the distorting effects of inventories on GDP. It is a paradox that with all of our inventory and planning models, instant communications of transactions into corporate logistics operations that inventory success is not better. One of the problems is that businesses and consumers have access to many of those same technological tools (called search engines, as well as other methods) and can shop smarter, confounding inventory management advances.
The underlying growth rate of the economy is in the 2% range, as it has been.
First quarter real GDP was revised again. Don't let your head spin too fast: Q1 had been reported as +0.5% in its advance report, +0.8% in the preliminary report, and +1.1% in the final report, and now back to +0.8% in the revised report. Things are never final! At the end of July 2017, these will be revised again. Executives would be wise to not get hung up on the minor statistical fine-tuning and watch the long-term trends.
The advance report for Q2-2016 GDP was a disappointing +1.2%. The latest darling of econometricians, the Atlanta Fed's GDPNow model, had estimated it would be twice that.
* * *
Economists have been concerned that GDP models have been understating Q1 activity for the past few years. An internal review shows problems with their seasonality adjustments going back 30 years. That's all the more reason to not hang every decision on the last data point you have, and to look at long term trends. The year-to-year comparison method minimizes that kind of issue since it always compares a Q1 with the prior Q1.


Discussion
Join the discussion Sign In or Become a Member, doing so is simple and free