Since the recession began in Q4-2007, the average annual growth rate has been +1.2%. Since the recovery began in Q3-2009, average growth has been +2.02%.
Over these last years, the net inventories reported in GDP have affected GDP reporting significantly. In the long run, net inventories should be zero, as producers match product demand perfectly. In reality, net inventories can rise because producers overproduce because of misjudging demand, or because they believe that future demand will be higher. In recent quarters, net inventories have been declining to more typical levels.
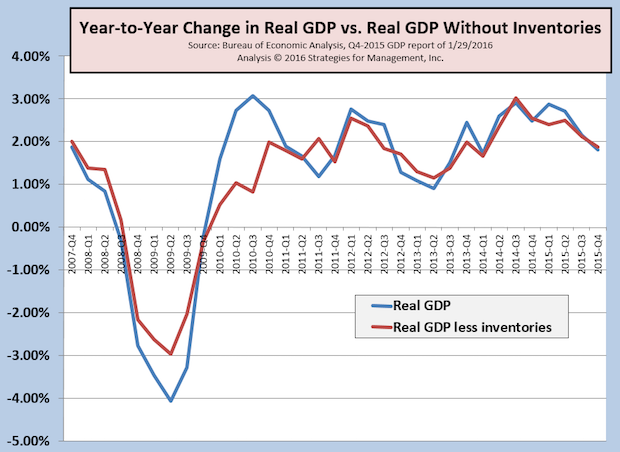
The chart shows the year-to-year change for RGDP with and without net inventories in an attempt to remove these distortions. In this last report, the distortion was minimal as year-to-year RGDP without inventories was +1.87%. For the prior quarters, the gap was more significant.
Using RGDP less net inventories, the average annual growth rate has been +1.2%, since the recession began. Since the recovery began, average growth has been +1.75%.
The long-term post-WW2 RGDP is about +3.3%, and the economy has not been able to reach that on a year-to-year basis since Q3-2005.
In terms of recession, revisions of these figures may hold the key. The recession declared for December 2007 was not announced until eleven months later, after there were many revisions to many economic data series. This report of Q4-2015 will be revised twice more, at the end of February and then at the end of March. Then there will be a major revision, perhaps going back as long as five years, on July 30.
Later this week we will release our updated recovery indicators, and markets will be greatly anticipating the employment report on Friday (2/5) which will have many adjustments to the estimates used by the Bureau of Labor Statistics. The details will be in the footnotes of their release. With economic uncertainty the way it has been this last month, those details will get great scrutiny.