Last week we reviewed how the commercial printing industry in five major metropolitan areas fared in the years after the recession.
Last week
we reviewed how the commercial printing industry in five major metropolitan areas fared in the years after the recession. This week we will show the data for the five largest states industry-wide, and also for small, medium, and large commercial printers. The data are from the Commerce Departments'
County Business Patterns for 2010 and 2013. Next week we'll discuss how some of these geographies have done since 2013 using a different data source. These data are presented with the assistance of
ExpliStats; we appreciate their assistance greatly (more details below).
Presented here are the establishment and employee data on a total industry basis. Rankings of states for establishments and number of employees can be quite different. States with many small establishments are more likely to appear in the national totals for establishments but may not appear in the rankings of total employees. It is also worth noting a definition. An establishment is best thought of as a location even though that might not be the most technically correct statistical definition. It's a good practical definition. A firm can own more than one establishment. These data refer to establishments. Employment data are important for industry suppliers. The more employees, the more goods consumed and the greater the capital investment. Seventy percent of the industry's capital investment is made by establishments with 50 or more employees.
Top 5 States, National Totals
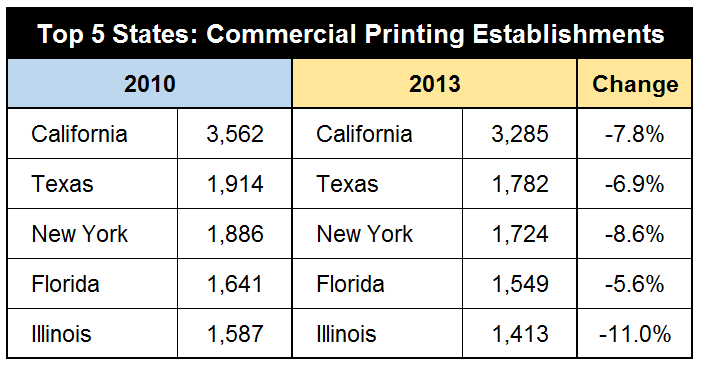
The top five states for commercial printing establishments remained the same for 2010 to 2013, but each of the states showed declines. California had the most establishments, but the number declined to 3,285, a -7.8% decrease. The top 15 states all had a decrease in establishments, with Massachusetts having the largest percentage decrease (-15.5%, -112 establishments) and North Carolina had the smallest decrease (-3.3%, -29). (click any of the charts in this report to enlarge them).

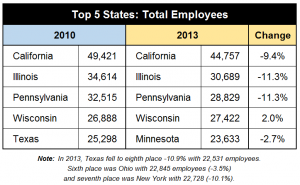
California was the largest state for employment in the commercial printing industry in 2013. It kept its top spot despite a -9.4% decrease in workers compared to 2010. The second and third states remained as Illinois and Pennsylvania, which declined by -11.3%. Wisconsin was the only top five state to show an increase because of its increase in large printer employment. Texas fell out of the top five in 2013, going down to eighth place with a -10.9% decrease. Passing Texas on the way up in the rankings were Ohio (-3.5%) and New York (-10.1%).
Small commercial printers (1-9 employees)
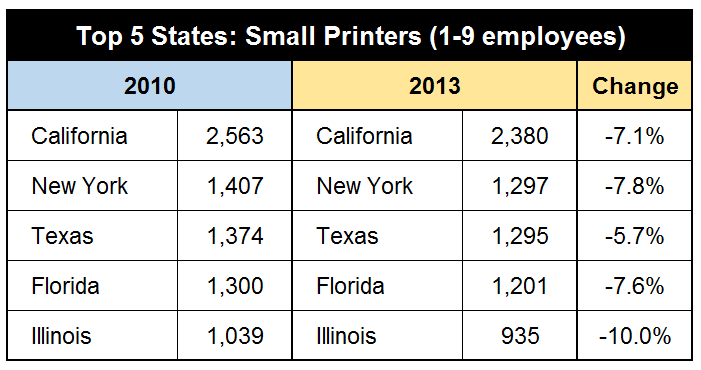
The ranking of the top five states for small printers was the same in 2013 as it was in 2010. All of the states had declines in the number of establishments. Of the top 15 states, Massachusetts had the steepest decline, -16.5% (-82 establishments), and North Carolina had the smallest, -1.7% (-11).

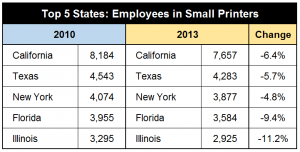
Employment in small printers (1-9 employees) for 2013 compared to 2010 had the same state rankings for the top five. All of the states declined, with Illinois declining the most. Other states below the top five had significant declines, notably Massachusetts (-16.4%). Pennsylvania (-15.5%), and Virginia (-14.8%).
Medium commercial printers (10-49 employees)
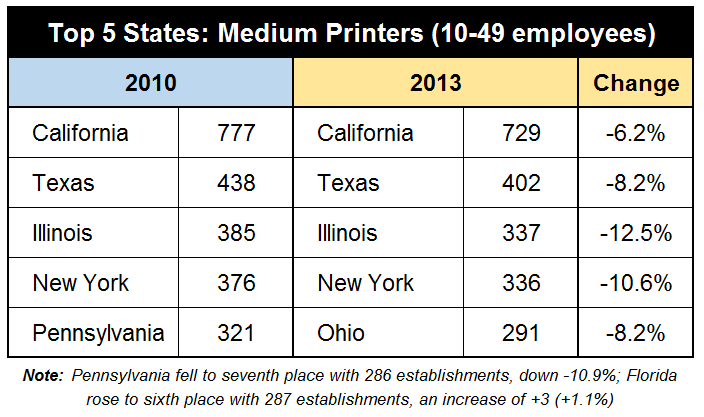
Among medium-size printers, the four largest states had the same rank, and Ohio replaced Pennsylvania. California decreased by -6.2%, and its decrease may have been tempered by a steep decrease in large establishments that downsized and now fit in this category. Pennsylvania fell to seventh, passed by Ohio and Florida. This was despite Ohio decreasing by -26 plants.

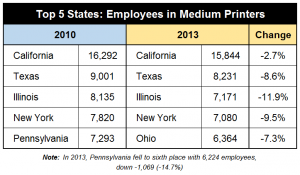
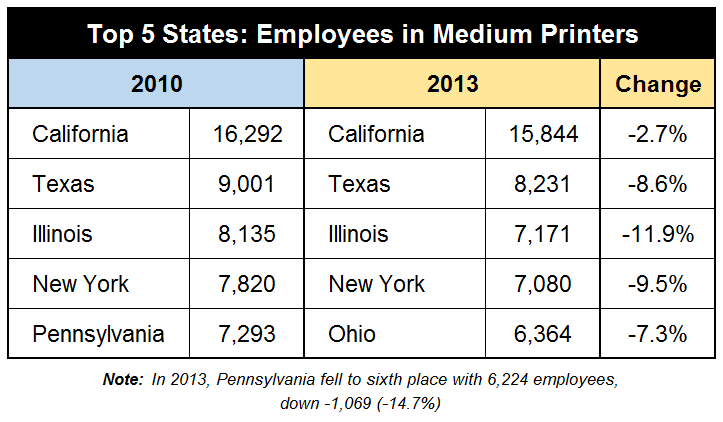
Medium printers were ranked differently than small establishments. California and Texas were ranked at the top, with California having only a small decline of -2.7%. This might be the result of the state's steep decline in employment in large printers, where more businesses dropped into the medium category. Illinois remained in third place, with New York in fourth. Ohio replaced Pennsylvania in fifth place. Pennsylvania lost more than 1,000 employees, falling by -14.7%.
Large commercial printers (50+ employees)
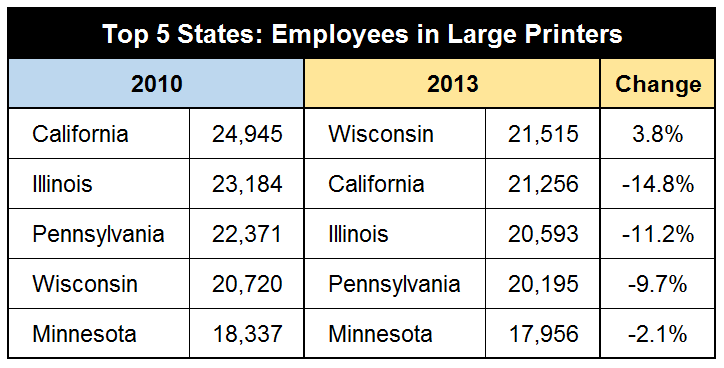
The decrease in the number of large printers was significant. These plants were often producing long run length printed goods on web offset or gravure presses, such as magazines, newspaper inserts, and catalogs, as well as mass advertising campaigns. The decrease in print demand led to the decrease in the number of establishments through downsizing, closure, bankruptcy, or consolidation through mergers and acquisitions. The effects of these actions can be seen by the percentage change in the number of establishments being steeper than the decline in the number of employees. In California, for example, the number of large printer establishments was down by nearly -21%. The number of employees in establishments of this size was down by about -15%. In Wisconsin, the number of large establishments declined by -3.4% but the number of employees in those establishments actually rose by +3.8%.
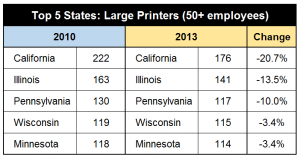
The big change in the ranking of states by numbers of employees in large printers was somewhat dramatic. Wisconsin's increase in employment made it 2013's largest employing state in this establishment size category. This is the likely result of the consolidation efforts of Quad Graphics as it absorbed Quebecor World into its operations and reconfigured its plants. Consolidation is the probable cause of increases in employment in this category other states, such as New Jersey (8,641 employees, +5.6%), Michigan (8,315, + 4.6%), and Missouri (9,681, +0.3%).

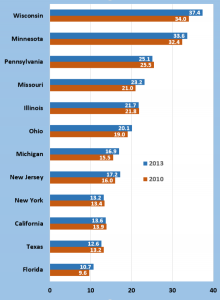
Employees per Establishment
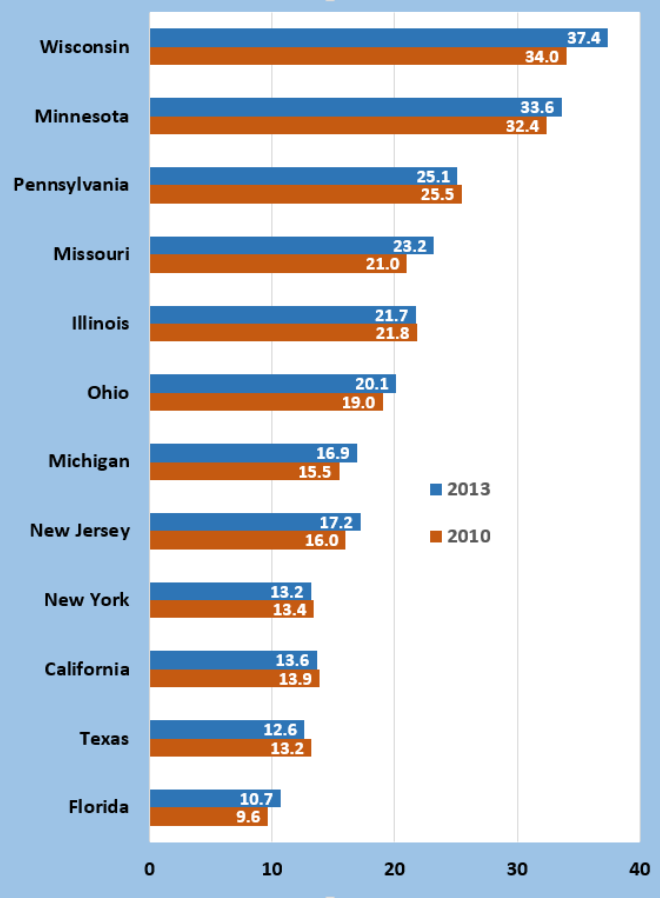
A few months ago we noted that the
average number of employees in printing establishments had fallen to a little more than 17.
Amonth the major states in this next chart, the average in 2013 was 20.5 employees, an increase of +4.3% compared to 2010's 19.6. Total employment in the industry has been falling, even though shipments have stabilized for almost a year. These are the effects of consolidation; fewer establishments, with slightly bigger workforces. Wisconsin and Minnesota have the highest number of employees per establishment, with 37.4 and 33.6, respectively; the average increased for both. Remember, consolidation takes place in may ways, including bankruptcy, closure, tuck-ins, mergers, and acquisitions. The most common one for small establishments is two owners closing and opening a new establishment together. At a very high economic level, consolidations occur without the mutual efforst of two owners, but the closure of one business and the hiring of the stranded employees by the survivor. The larger printing businesses are more regionally or nationally focused, and do not rely on the local economy for business in the way smaller printers must. (click chart to enlarge)
* * *
Last week we discussed how geographic data are important in sales and logistics decisions. Our partnership with ExpliStats allows the WhatTheyThink ERC to develop custom analyses of the industry and the content creation businesses that are so deeply connected to it.
While we have provided data in this post for small, medium, and large, the original data are in finer categories. These more detailed categories (1-4 employees, 5-9, 10-19, and up to 500+) can provide insights to users who need more targeted and more specific data. Employee size categories can be used to build models of the industry to determine market size, market potential, and geographic tactics.
Please
contact us for further information. And please watch our posts and the newsletter for some new industry statistics initiatives that will be announced soon and at Graph Expo.
# # #
 California was the largest state for employment in the commercial printing industry in 2013. It kept its top spot despite a -9.4% decrease in workers compared to 2010. The second and third states remained as Illinois and Pennsylvania, which declined by -11.3%. Wisconsin was the only top five state to show an increase because of its increase in large printer employment. Texas fell out of the top five in 2013, going down to eighth place with a -10.9% decrease. Passing Texas on the way up in the rankings were Ohio (-3.5%) and New York (-10.1%).

 Employment in small printers (1-9 employees) for 2013 compared to 2010 had the same state rankings for the top five. All of the states declined, with Illinois declining the most. Other states below the top five had significant declines, notably Massachusetts (-16.4%). Pennsylvania (-15.5%), and Virginia (-14.8%).

 Medium printers were ranked differently than small establishments. California and Texas were ranked at the top, with California having only a small decline of -2.7%. This might be the result of the state's steep decline in employment in large printers, where more businesses dropped into the medium category. Illinois remained in third place, with New York in fourth. Ohio replaced Pennsylvania in fifth place. Pennsylvania lost more than 1,000 employees, falling by -14.7%.
 The big change in the ranking of states by numbers of employees in large printers was somewhat dramatic. Wisconsin's increase in employment made it 2013's largest employing state in this establishment size category. This is the likely result of the consolidation efforts of Quad Graphics as it absorbed Quebecor World into its operations and reconfigured its plants. Consolidation is the probable cause of increases in employment in this category other states, such as New Jersey (8,641 employees, +5.6%), Michigan (8,315, + 4.6%), and Missouri (9,681, +0.3%).
 * * *
Last week we discussed how geographic data are important in sales and logistics decisions. Our partnership with ExpliStats allows the WhatTheyThink ERC to develop custom analyses of the industry and the content creation businesses that are so deeply connected to it.
While we have provided data in this post for small, medium, and large, the original data are in finer categories. These more detailed categories (1-4 employees, 5-9, 10-19, and up to 500+) can provide insights to users who need more targeted and more specific data. Employee size categories can be used to build models of the industry to determine market size, market potential, and geographic tactics.
Please contact us for further information. And please watch our posts and the newsletter for some new industry statistics initiatives that will be announced soon and at Graph Expo.
# # #
* * *
Last week we discussed how geographic data are important in sales and logistics decisions. Our partnership with ExpliStats allows the WhatTheyThink ERC to develop custom analyses of the industry and the content creation businesses that are so deeply connected to it.
While we have provided data in this post for small, medium, and large, the original data are in finer categories. These more detailed categories (1-4 employees, 5-9, 10-19, and up to 500+) can provide insights to users who need more targeted and more specific data. Employee size categories can be used to build models of the industry to determine market size, market potential, and geographic tactics.
Please contact us for further information. And please watch our posts and the newsletter for some new industry statistics initiatives that will be announced soon and at Graph Expo.
# # #


