The recovery indicators had a mixed performance to the downside this past month.
The recovery indicators had a mixed performance to the downside this past month. New orders for manufacturers and non-manufacturers were up slightly, but the four other indicators fell, with one of them falling below that of the start of the recession.(click chart to enlarge)
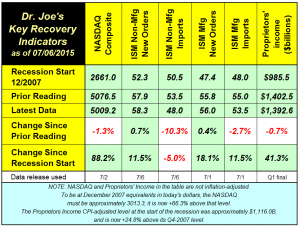
The NASDAQ had a rocky month but was still over the 5000 level, a near term high. New orders for manufacturers were up slightly, and their imports were down slightly. On the non-manufacturing side, new orders increased, but imports fell significantly, below the level of December 2007.
Proprietors income was down and noted in earlier reports, but the prior estimate of proprietors' income was revised up slightly from $1390.1.
* * *
Last Friday's unemployment report was great in the headlines, where the unemployment rate fell to 5.3%. That was about the end of the good news when you went a little deeper into the household survey. Here are the bullet points:
- the lowest labor participation rate in almost 38 years
- 432,000 people leaving the labor force
- an increase in "not in labor force" of 640,000
- an increase in part time workers of 519,000 indicating a shift from full time work downward
The report actually showed a decrease in the number of people employed by -56,000. How can that create a 5.3% unemployment rate? The unemployment rate is calculated by deducting the ratio of employed persons by the total number of people in the labor force. The labor force includes, in the most simplistic terms without lots of technical aspects, is the number of people employed and the number of people actively looking for work. What happened is that the number of people leaving the labor force was so large compared to the decrease in employment that the unemployment rate actually "improved."
The payroll survey had an improvement of +223,000 employees; that reflects "W-2" jobs and does not include self-employed and freelance workers. Because of the increase in part time work, the payroll survey might be double counting workers with two part time jobs. The household survey counts workers only once. The payroll survey has been steadily increasing at a low rate. It has never boomed in the recovery, but it has had generally steady increases.
There are wide ranges of statistical error related to the unemployment data in any particular month. This disappointing report just affirms that the economy is still slow and is likely to stay that way, stuck in a +2.25% to +2.75% range. The trend is still lackluster.
* * *
One of the themes of
analysis of the employment data in the business media is that the labor force is shrinking because so many older workers are leaving the workforce. I figured I'd look at the data and instead look at the number of people employed. The economy has still not reached the raw number of full time workers it had before the recession.
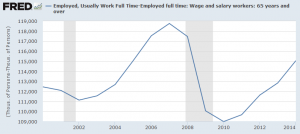
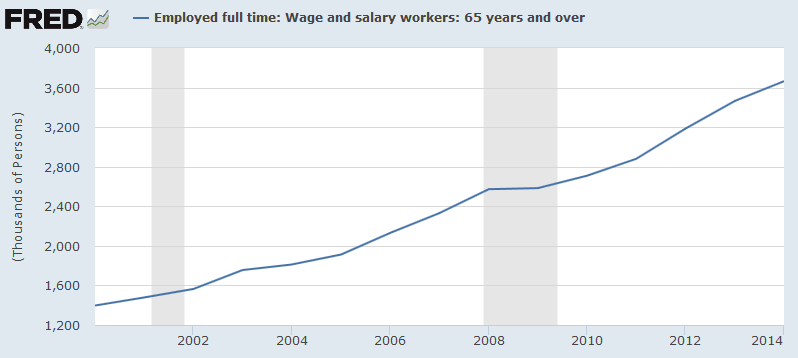
These two charts show the following (click to enlarge). The first chart shows the steady rise in the number of workers 65+ years of age.

This next chart shows the number of full time workers less those 65+ in age. The total is 3.5 million workers short of the levels prior to the recession.
Population has been growing since that time. It is hard to believe that the recession started more than seven years ago and many indicators have not recovered to those levels. Adjusted for population, the calculation of full time workers less older workers is probably about seven or eight million workers short of where it should be.
* * *
Gallup reports that
consumer spending is flat. When you look at their chart, it's still 10% lower than it was prior to the recession. That's similar to the reports of
median household income which still has not recovered.
# # #
UPDATE 7/9/2015: The
Atlanta Fed's GDPNow has been updated to +2.3% for the second quarter. Each major release of macroeconomic data is used to update their model. The official Q2 advance estimate will be released on Thursday, July 30. On that date, at least three years of prior GDP data will be revised, and possibly more years than that.
# # #
 This next chart shows the number of full time workers less those 65+ in age. The total is 3.5 million workers short of the levels prior to the recession.
 Population has been growing since that time. It is hard to believe that the recession started more than seven years ago and many indicators have not recovered to those levels. Adjusted for population, the calculation of full time workers less older workers is probably about seven or eight million workers short of where it should be.
* * *
Gallup reports that consumer spending is flat. When you look at their chart, it's still 10% lower than it was prior to the recession. That's similar to the reports of median household income which still has not recovered.
# # #
UPDATE 7/9/2015: The Atlanta Fed's GDPNow has been updated to +2.3% for the second quarter. Each major release of macroeconomic data is used to update their model. The official Q2 advance estimate will be released on Thursday, July 30. On that date, at least three years of prior GDP data will be revised, and possibly more years than that.
# # #
Population has been growing since that time. It is hard to believe that the recession started more than seven years ago and many indicators have not recovered to those levels. Adjusted for population, the calculation of full time workers less older workers is probably about seven or eight million workers short of where it should be.
* * *
Gallup reports that consumer spending is flat. When you look at their chart, it's still 10% lower than it was prior to the recession. That's similar to the reports of median household income which still has not recovered.
# # #
UPDATE 7/9/2015: The Atlanta Fed's GDPNow has been updated to +2.3% for the second quarter. Each major release of macroeconomic data is used to update their model. The official Q2 advance estimate will be released on Thursday, July 30. On that date, at least three years of prior GDP data will be revised, and possibly more years than that.
# # #


