Real GDP was revised to make the first quarter's decline much smaller, from -0.7% to -0.2%. Consumer spending was revised higher, as were net inventories. The inventory data have been out of balance for some time; theoretically, long run net inventories should be zero, as goods and services are created to meet the exact demands of the market. Rises in inventories are sometimes signs of expectations of improving conditions, and decreases in inventories are the corrections made in recessions. In this recovery, increases in inventories have been overly optimistic, spurred by low interest rates, and in one case, spurred by the avoidance of increased labor costs in anticipation of the ACA. The latter is no longer a factor, and some of the current inventory building might be in anticipation of higher interest rates.
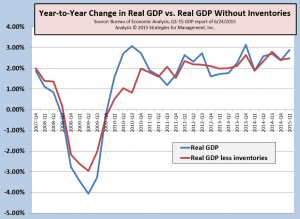
Whatever the reason, the higher inventories in one quarter are usually adjusted in the next quarters, which will mute upcoming GDP reports. The distorting effects of inventories in this recovery is easily removed by subtraction, which our chart reflects. We also prefer the year-to-year comparison of economic data rather than the quarterly comparisons. (click chart to enlarge)

With inventories, real GDP was at +2.88% on that basis, and without inventories was +2.48%. Since the recovery, the economy has run at a little more than half of the post-WW2 average of +3.4%. That average is +1.9%, and without inventories is +1.67%. Starting with Q1-2013, real GDP has been +2.37% and +2.29% sans inventories. A multi-year revision of GDP data is due at the end of July, and our charts and models will be recalculated to reflect those changes. The latest durable goods orders report was disappointing overall but not anything out of line. It was added to the Atlanta Fed's GDPNow calculus which is now estimating that the GDP for 2Q-2015 will be reported as +1.9%, below recent trends.
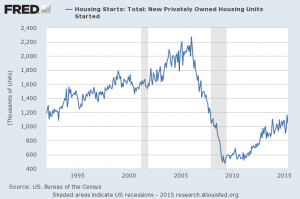
There are still many economic data of consequence that have not achieved pre-recession levels. New housing starts in the recovery are not even at levels reached in 1993 when President Clinton took office, many years before the housing bubble and even after more than years of population growth. (click chart to enlarge)

Full time employment still lags the level of the start of the recession, and after population adjustment is about 7 million workers short. Fed chair Dr. Janet Yellen's
employment dashboard still has 6 of its 9 indicators lagging levels at the recession start. Remember, the recession started more than seven years ago. Despite the rise in the stock market, and all of the stock buybacks, the real sales per share of the S&P 500 has
not reached its pre-recession level.
It is for reasons like these that we continue to believe that the economy will remain at its lackluster pace in the range of +2.25% and +2.75% overall, with any breakouts to the upside or downside to be of short duration and regress to the mean in future periods. The recent release of personal income after taxes for May is in the middle of this range.
* * *
The schedule for economic data releases is affected by the Independence Day holiday next Friday, July 3. The Bureau of Labor Statistics employment report will be released on Thursday, July 2, a day earlier than usual. May printing shipments will be released on the same day.
Our recovery indicators will not be released until the afternoon of Monday, July 6 because of the holiday-delayed reporting by the Institute for Supply Management.
# # #
UPDATE 6/26/2015 -- Yesterday's release of personal income data pushed the Atlanta Fed's GDPNow to +2.1% for Q2-2015 GDP.
 With inventories, real GDP was at +2.88% on that basis, and without inventories was +2.48%. Since the recovery, the economy has run at a little more than half of the post-WW2 average of +3.4%. That average is +1.9%, and without inventories is +1.67%. Starting with Q1-2013, real GDP has been +2.37% and +2.29% sans inventories. A multi-year revision of GDP data is due at the end of July, and our charts and models will be recalculated to reflect those changes. The latest durable goods orders report was disappointing overall but not anything out of line. It was added to the Atlanta Fed's GDPNow calculus which is now estimating that the GDP for 2Q-2015 will be reported as +1.9%, below recent trends.
There are still many economic data of consequence that have not achieved pre-recession levels. New housing starts in the recovery are not even at levels reached in 1993 when President Clinton took office, many years before the housing bubble and even after more than years of population growth. (click chart to enlarge)
 Full time employment still lags the level of the start of the recession, and after population adjustment is about 7 million workers short. Fed chair Dr. Janet Yellen's employment dashboard still has 6 of its 9 indicators lagging levels at the recession start. Remember, the recession started more than seven years ago. Despite the rise in the stock market, and all of the stock buybacks, the real sales per share of the S&P 500 has not reached its pre-recession level.
It is for reasons like these that we continue to believe that the economy will remain at its lackluster pace in the range of +2.25% and +2.75% overall, with any breakouts to the upside or downside to be of short duration and regress to the mean in future periods. The recent release of personal income after taxes for May is in the middle of this range.
* * *
The schedule for economic data releases is affected by the Independence Day holiday next Friday, July 3. The Bureau of Labor Statistics employment report will be released on Thursday, July 2, a day earlier than usual. May printing shipments will be released on the same day.
Our recovery indicators will not be released until the afternoon of Monday, July 6 because of the holiday-delayed reporting by the Institute for Supply Management.
# # #
UPDATE 6/26/2015 -- Yesterday's release of personal income data pushed the Atlanta Fed's GDPNow to +2.1% for Q2-2015 GDP.


