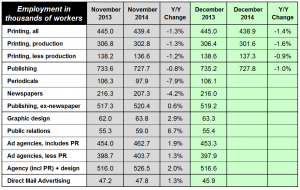
 Content creation segments were much better; full year data are not available yet, but compared to November 2013, the results show the shift in media strategy. Graphic design employment was up +2.9%; this does not include freelance employment. The increase in graphic design employment was greater than the decline in printing industry employment. Advertising agency employment was up +1.9%. The fastest growing component of that is public relations, up +6.7%. When PR employment is excluded, agency employment was still up +1.3%. The increase in PR employment is probably larger as these figures do not include freelance employment. Those data will not be available until sometime in 2016. It is possible that freelance employment could be contracting as agencies recruit talent for full time positions, but from anecdotal information, it seems that the trend toward digital media is so strong that it is growing as well but at a slower rate.
* * *
The national employment picture continued to improve in the headline unemployment rate number, dropping to 5.6%.
The problems with the labor market is illustrated by how the rate dropped. The unemployment rate is part of what is called the "household survey" which counts people as employed when they have any job, such as a payroll job or a self-employment job. Each person is counted once, no matter how many employers they might have. While the unemployment rate is part of every employment report, the number of jobs cited in news reports comes from a different data collection process, the "establishment survey." These are "payroll jobs." From a tax perspective, think of the two surveys in terms of the forms that are used to report employment taxes. The payroll survey counts workers based on form 941, where social security taxes are reported, and those workers get W-2 forms at the end of the year. The household survey includes those workers in the payroll survey, but also those who file schedule SE for their social security taxes, which is attached to their annual tax return. Those workers are sole proprietors, partners, and other formats including schedule S corporations.
It is understandable why the payroll survey is considered critical, and it can be checked for validity based on the form 941s which are filed through the year, usually weekly, as a measure of employment. The Bureau of Labor Statistics can do surveys and projections and within weeks they can have those verified by real data. The household survey data can't be verified as quickly, but they can get a rough measure of what's happening when self-employed workers file their quarterly estimated tax payments. But the real verification can't come until after the complete tax forms are filed the following year.
There is a mild problem with the payroll survey in that some workers can be counted more than once if they have two employers. So if you have two part time jobs, you're counted in the payroll service twice, and in the household survey once.
There is also a general bias that self-employment is not "real work" and those people don't have "real jobs." From a practical standpoint, they have a point because those jobs are also less stable, and payroll jobs are more steady and predictable from a statistical perspective. This employment statistics stuff if not easy.
The unemployment rate calculation is basically as follows:
Content creation segments were much better; full year data are not available yet, but compared to November 2013, the results show the shift in media strategy. Graphic design employment was up +2.9%; this does not include freelance employment. The increase in graphic design employment was greater than the decline in printing industry employment. Advertising agency employment was up +1.9%. The fastest growing component of that is public relations, up +6.7%. When PR employment is excluded, agency employment was still up +1.3%. The increase in PR employment is probably larger as these figures do not include freelance employment. Those data will not be available until sometime in 2016. It is possible that freelance employment could be contracting as agencies recruit talent for full time positions, but from anecdotal information, it seems that the trend toward digital media is so strong that it is growing as well but at a slower rate.
* * *
The national employment picture continued to improve in the headline unemployment rate number, dropping to 5.6%.
The problems with the labor market is illustrated by how the rate dropped. The unemployment rate is part of what is called the "household survey" which counts people as employed when they have any job, such as a payroll job or a self-employment job. Each person is counted once, no matter how many employers they might have. While the unemployment rate is part of every employment report, the number of jobs cited in news reports comes from a different data collection process, the "establishment survey." These are "payroll jobs." From a tax perspective, think of the two surveys in terms of the forms that are used to report employment taxes. The payroll survey counts workers based on form 941, where social security taxes are reported, and those workers get W-2 forms at the end of the year. The household survey includes those workers in the payroll survey, but also those who file schedule SE for their social security taxes, which is attached to their annual tax return. Those workers are sole proprietors, partners, and other formats including schedule S corporations.
It is understandable why the payroll survey is considered critical, and it can be checked for validity based on the form 941s which are filed through the year, usually weekly, as a measure of employment. The Bureau of Labor Statistics can do surveys and projections and within weeks they can have those verified by real data. The household survey data can't be verified as quickly, but they can get a rough measure of what's happening when self-employed workers file their quarterly estimated tax payments. But the real verification can't come until after the complete tax forms are filed the following year.
There is a mild problem with the payroll survey in that some workers can be counted more than once if they have two employers. So if you have two part time jobs, you're counted in the payroll service twice, and in the household survey once.
There is also a general bias that self-employment is not "real work" and those people don't have "real jobs." From a practical standpoint, they have a point because those jobs are also less stable, and payroll jobs are more steady and predictable from a statistical perspective. This employment statistics stuff if not easy.
The unemployment rate calculation is basically as follows:
the number of employed workers
divided by
the total number of people in the work force
that result is subtracted from 1 to show the percentage of the workforce that is unemployed.
So here's how we got to 5.6% from 5.8% in the prior report:- 273,000 people left the labor force for any reason, usually that they have not been employed at any time for a year; this is a net number of people who join the workforce less the number who left
- 111,000 people got jobs; this is a net number of people who got jobs less those who lost jobs; this often involves the actions of 2 million people in a particular month
so with more people leaving the workforce than the number of people getting jobs (in the household survey), the unemployment rate went down. This labor force shrinkage has been a major reason why the unemployment rate has dropped so much in recent years.
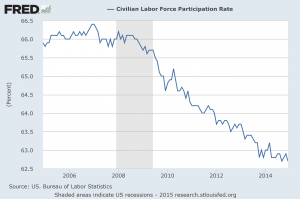
Here is a 10-year chart of the labor participation rate (click to enlarge) ...
... and since 1948 (click to enlarge). The rate is at levels not seen for more than 35 years.
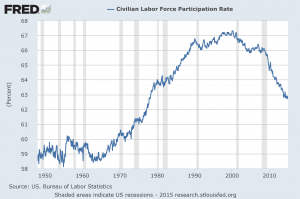
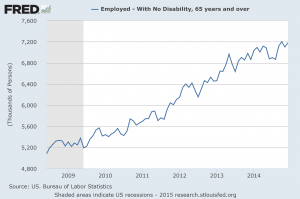
What is interesting about this employment cycle is that there are economists saying that this is "normal," as baby boomers retire. But older workers are in a general increase in the workforce, and their participation rate is rising. The baby boomers are the healthiest and most educated cohort of retirees in history, and staying employed is important for many of them. In recent years, with age spans increasing, many are delaying retirement to allow retirement funds to remain untapped and also to receive higher social security payments. (For many workers, delaying retirement to age 70 increases their monthly payments by as much as 30%).
The past few weeks this blogpost has identified some economic data that have yet to surpass their levels prior to the recession start, more than seven years ago. The number of full time workers has not reached that level, even though population has grown more than 5% since that time. Adjusting for population growth, the economy is short about seven to nine million full time jobs. (click chart to enlarge)
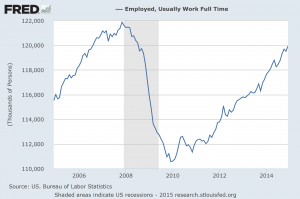
The total number of workers has exceeded the levels prior to recession, but lags a population adjustment. Of the 2.2 million more people employed since last year, 970,000 of them were employed part time.
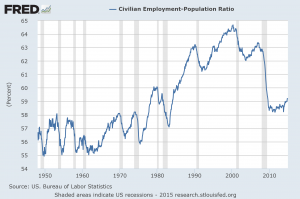
Employment compared to the population, one of the best ways to put the employment picture in proper context, is slowly improving, but still lags recent historical levels. This is the last 10 years (click chart to enlarge)...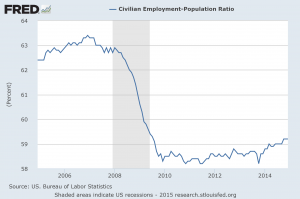 ... and this is since the late 1940s (click chart to enlarge)
 There are indications from the NFIB Small Business Optimism Survey that hiring will increase, as well as the ISM manufacturing and non-manufacturing surveys. This new year will be interesting from an employment perspective as the US has the relatively stronger economy than other world regions. It remains to be seen if geopolitical issues can be contained in such a way that they do not derail positive aspects of the US economy. Hold on tight, concentrate on staying ahead of your clients.
# # #
There are indications from the NFIB Small Business Optimism Survey that hiring will increase, as well as the ISM manufacturing and non-manufacturing surveys. This new year will be interesting from an employment perspective as the US has the relatively stronger economy than other world regions. It remains to be seen if geopolitical issues can be contained in such a way that they do not derail positive aspects of the US economy. Hold on tight, concentrate on staying ahead of your clients.
# # #


