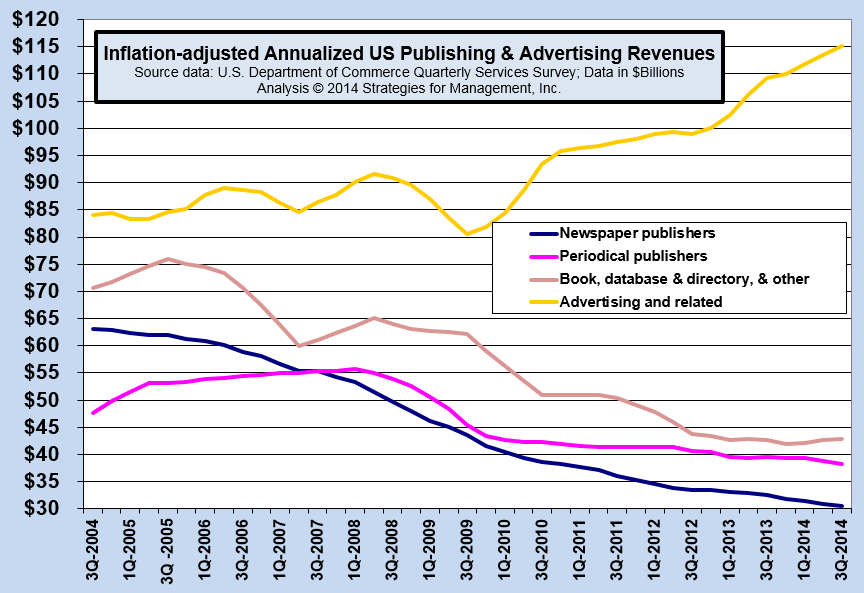
Advertising agency revenues have risen from the inflation-adjusted annual rate of $80.6 billion to $115.1 billion in the last five years. This is not annual spending on advertising in the economy, but the amount of revenues that agencies get from commissions, fees, and their creative and management services. The chart below shows the changes (click chart to enlarge).

The biggest gain was the +15.8% increase from the bottom of the recession in Q3-2009 to Q3-2010. The next biggest jump was +10.5% from Q3-2012 to Q3-2013. For the last 12 months of data, Q3-2014 compared to Q3-2013, the increase has been +5.3%.
Advertising agencies can have significant swings in their revenue levels. Recessions often place ad spending first on the budget chopping block and when business improves, delayed projects can be added to more typical levels of spending.
The most important "take-away" from the change in ad agency revenues is the changes in revenues based on media allocations. Social media and content marketing programs (they often go hand-in-hand) are more important today, with video playing an increasing role in non-broadcast formats.
Regarding the publishing industries in the charts, the revenues over the last 12 months (Q3-2014 / Q3-2013) are as follows:
- newspaper publishing's decline continues (-6.2%),
- book publishing flattens out (+0.5%),
- periodical publishing (mainly magazines) maintain a slow revenue retreat (-3.1%).
# # #
 The biggest gain was the +15.8% increase from the bottom of the recession in Q3-2009 to Q3-2010. The next biggest jump was +10.5% from Q3-2012 to Q3-2013. For the last 12 months of data, Q3-2014 compared to Q3-2013, the increase has been +5.3%.
Advertising agencies can have significant swings in their revenue levels. Recessions often place ad spending first on the budget chopping block and when business improves, delayed projects can be added to more typical levels of spending.
The most important "take-away" from the change in ad agency revenues is the changes in revenues based on media allocations. Social media and content marketing programs (they often go hand-in-hand) are more important today, with video playing an increasing role in non-broadcast formats.
Regarding the publishing industries in the charts, the revenues over the last 12 months (Q3-2014 / Q3-2013) are as follows:
The biggest gain was the +15.8% increase from the bottom of the recession in Q3-2009 to Q3-2010. The next biggest jump was +10.5% from Q3-2012 to Q3-2013. For the last 12 months of data, Q3-2014 compared to Q3-2013, the increase has been +5.3%.
Advertising agencies can have significant swings in their revenue levels. Recessions often place ad spending first on the budget chopping block and when business improves, delayed projects can be added to more typical levels of spending.
The most important "take-away" from the change in ad agency revenues is the changes in revenues based on media allocations. Social media and content marketing programs (they often go hand-in-hand) are more important today, with video playing an increasing role in non-broadcast formats.
Regarding the publishing industries in the charts, the revenues over the last 12 months (Q3-2014 / Q3-2013) are as follows:


