Commentary & Analysis
Four Recovery Indicators Pull Back
The recovery indicators took a wallop this past month,
The recovery indicators took a wallop this past month, with four of them pulling back, especially new orders for manufacturing. The NASDAQ had an erratic month but only had a -1.5% pullback despite much grinding of teeth.
But... the ISM decrease in new orders for manufacturing and non-manufacturing needs to be put in perspective: these indicators are still high and indicate future growth. They are well above where the recession started.
(click chart to enlarge)
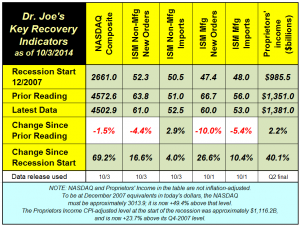 What's it mean? Despite five years of recovery, there is still no bullish charge ahead for the economy, and we remain in a long-term 2.25% to 2.75% GDP range.
# # #
What's it mean? Despite five years of recovery, there is still no bullish charge ahead for the economy, and we remain in a long-term 2.25% to 2.75% GDP range.
# # #
About Dr. Joe Webb
Dr. Joe Webb is one of the graphic arts industry's best-known consultants, forecasters, and commentators. He is the director of WhatTheyThink's Economics and Research Center.
Video Center


![]()

WhatTheyThink is the official show daily media partner of drupa 2024. More info about drupa programs
© 2024 WhatTheyThink. All Rights Reserved.