 Management and administrative workers are a different story. The BLS shows them down by -2,400, with their estimates placing -1,400 of that since July 2014. Yes, August was pink slip month, it seems.
That is the nature of consolidation, where duplication of management is eliminated at a far greater rate than production workers in the long run. It just so happens that there are fewer administrative personnel than there are production personnel.
There was a big rise in graphic design employment (+1,100) and especially in public relations (+4,200) since last year. Publishing positions continue to head down. Newspapers have been in a steep deline for multiple years, but periodicals (magazines, mainly) are down -5,700 workers, or -5.3% compared to July 2013. Employment data reflect the shift 15+ year shift in media dollars quite well. PR employment is the best indicator in the shift of dollars to search engines, social media, content marketing, and events. Graphic design is getting a boost as companies seek ways to make their branding work across all formats and gadgets. Advertising agency revenues continue to rise.
# # #
Management and administrative workers are a different story. The BLS shows them down by -2,400, with their estimates placing -1,400 of that since July 2014. Yes, August was pink slip month, it seems.
That is the nature of consolidation, where duplication of management is eliminated at a far greater rate than production workers in the long run. It just so happens that there are fewer administrative personnel than there are production personnel.
There was a big rise in graphic design employment (+1,100) and especially in public relations (+4,200) since last year. Publishing positions continue to head down. Newspapers have been in a steep deline for multiple years, but periodicals (magazines, mainly) are down -5,700 workers, or -5.3% compared to July 2013. Employment data reflect the shift 15+ year shift in media dollars quite well. PR employment is the best indicator in the shift of dollars to search engines, social media, content marketing, and events. Graphic design is getting a boost as companies seek ways to make their branding work across all formats and gadgets. Advertising agency revenues continue to rise.
# # #
Commentary & Analysis
Employment Report Inconsistent with Recent Upbeat Economic Data; Content Creation Jobs Grow
Last week,
Last week, the ISM manufacturing and non-manufacturing reports were very positive, especially for new orders. The week prior, the second quarter GDP revision showed an economy that stood firm coming out of a bad first quarter. Some of that went out the window last Friday with a lackluster employment report that the Bureau of Labor Statistics called "little changed." Their press releases use that phrase to alert their data users not to make too much out of the move from a 6.2% unemployment rate to 6.1%.
Based on the household survey, which includes self-employment, the labor force decreased by -64,000. The labor participation rate fell back to 62.8%; a year ago it was 63.2%. Employment rose in the household survey by only +16,000, but since last year it is up almost +2.2 million. The number of unemployed people is down -1.67 million since last year.
The big problem is the number of people who have dropped out of the workforce. It was up +268,000 in this report, and is up more than +1.7 million compared to last year. If you add these workers back to the base, the unemployment rate would be 6.9%, not 6.1%.
Since this time last year, the number of part time workers is up +251,000; this is not that far out of line from recent history. It's not that workers are being shoved to part time work for various reasons (like the implementation of the ACA), they're just not being hired. New entrants to the workforce, a figure that swells in improving economies, was down -21,000 last month, and is down -229,000 compared to last year.
The health of small business is very important to the economy. The number of self-employed workers is down -202,000.
This employment report was not very satisfying in light of other more positive data. Always remember that these data are constantly revised and often have wide ranges of statistical error. The comparisons to last year are much more important than the month-to-month variations. On average, the household survey reports an increase of +183,000 per month over this last year. If the economy grew by just the population growth rate alone, it would increase about +120,000 per month alone. There is little reason to assume that this sluggish but positive rate won't continue.
* * *
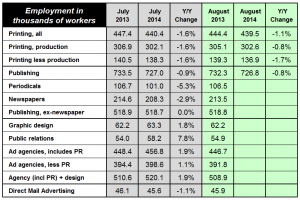
Printing employment tumbled in August, but that's not the whole story. According the the Bureau of Labor Statistics, production workers increased by 500 compared to July 2014. The number of these workers is still down compared to 2013, but the rise in workers is an indication of better industry shipments, consistent with the increases seen in June and July. (click chart to enlarge)
Management and administrative workers are a different story. The BLS shows them down by -2,400, with their estimates placing -1,400 of that since July 2014. Yes, August was pink slip month, it seems.
That is the nature of consolidation, where duplication of management is eliminated at a far greater rate than production workers in the long run. It just so happens that there are fewer administrative personnel than there are production personnel.
There was a big rise in graphic design employment (+1,100) and especially in public relations (+4,200) since last year. Publishing positions continue to head down. Newspapers have been in a steep deline for multiple years, but periodicals (magazines, mainly) are down -5,700 workers, or -5.3% compared to July 2013. Employment data reflect the shift 15+ year shift in media dollars quite well. PR employment is the best indicator in the shift of dollars to search engines, social media, content marketing, and events. Graphic design is getting a boost as companies seek ways to make their branding work across all formats and gadgets. Advertising agency revenues continue to rise.
# # #
About Dr. Joe Webb
Dr. Joe Webb is one of the graphic arts industry's best-known consultants, forecasters, and commentators. He is the director of WhatTheyThink's Economics and Research Center.
Video Center


![]()
- March 2024 Inkjet Installation Roundup
- Inkjet Integrator Profiles: Integrity Industrial Inkjet
- Revisiting the Samba printhead
- 2024 Inkjet Shopping Guide for Folding Carton Presses
- The Future of AI In Packaging
- Inkjet Integrator Profiles: DJM
- Spring Inkjet Update – Webinar
- Security Ink Technologies for Anti-Counterfeiting Measures

WhatTheyThink is the official show daily media partner of drupa 2024. More info about drupa programs
© 2024 WhatTheyThink. All Rights Reserved.