The first revision to the second quarter's GDP raised the estimate from +4.0% to +4.2%. Remember, this follows a first quarter that was revised three times and is currently estimated as -2.1%. It's probably best to think of the second quarter as "catch up" for a variety of factors including an inventory timing adjustment and also weather factors that shifted some of the normal course of business from the first quarter and into the second quarter.
As readers know, we have been concerned with the fluctuations of inventories in the GDP data, especially an inventory buildup in Q3 and Q4 of 2013 that we continue to believe was a "sure thing" bet on higher interest rates and increased labor costs from implementation of the ACA. Neither happened as interest rates remained in their general trend and many of the cost increases from the ACA requirements were delayed.
We're always skeptical of quarter-to-quarter variations in economic data, and prefer to look at GDP on a year-to-year basis. The chart below is an update of the latest GDP data in that format, with and without inventory adjustment. (click chart to enlarge)
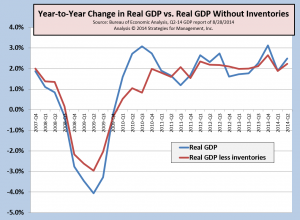
In the long run the variation to GDP cause by inventories should be zero as manufacturers and distribution channels react to real market activities. It appears that there is a slight inventory build in process that will likely be in sync with long-run trends. As for the change in inventories since 2007? It's zero. The long term trend for GDP growth has been in the low 2% range, and there is little reason to believe that it will not stay in that range.
* * *
We know that many printing businesses still persist in their belief that print volume moves in lockstep with GDP. We also know that most print business owners do not adjust their sales and financial data for inflation. Since that's the case, they should be comparing their businesses to current dollar GDP. That means that Q2 was not up +4.2%, it was up +6.4% as an annualized rate. Overall printing industry growth has not followed GDP for almost 15 years.
* * *
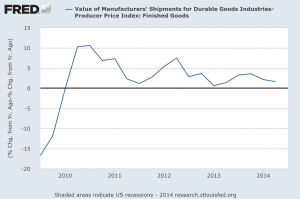
There was another important data release this week, and it concerned durable goods. Durable goods was
up a whopping +22%. The durable goods report is not adjusted for inflation, and it tends to swing wildly as orders for transportation equipment are very big and irregular. Most of these are sales of aviation equipment. They are booked upon signing, reported in the durable goods order data, but are often not shipped until three years later. That is, a lot of the +22% increase will not be shipped until 2017. This is another case of needing to ignore the headlines and look at the data. The chart below shows durable goods
shipments on a year-to-year basis, adjusted for inflation using the producer price index for finished goods. Because the data have wide variations on a monthly basis, we changed the data to quarters to better display the data direction. The chart below shows the five-year smoothed trend. (click chart to enlarge)
# # #


