 Updated recovery indicators will be published next week.
Commentary & Analysis
Q1-2014 GDP Revised Down to -2.9%; Will We Start Hearing the "R" Word?
The Bureau of Economic Analysis made their first report of Q1-
The Bureau of Economic Analysis made their first report of Q1-2014 GDP at the end of April stating it was +0.1%. Then in May they revised it to -1.0%. Everyone blamed it on the weather. On June 25, the BEA revised it to -2.9%.
Whoops!
The original estimate of proprietors' income, one of our best looks at the health of small business, was $1,371 billion then it was reduced to $1,366 and now it's $1,359.5. That was a 0.4% annual growth rate compared to the prior quarter's estimate. Proprietors' income is not inflation adjusted, so using a the year-to-year Consumer Price Index of +2.1%, this means that small business activity was down at a real rate of -1.7%.
Whoops again!
It's a reminder of how "soft" government data are when they are initially released. They have very little hard data in those reports, and they use mainly moving average estimation models and historic data relationships to estimate what they don't have (when they're not looking at what other economists are estimating). Then they replace their estimates with more real data as they arrive. Employment and payroll tax data are as close to real time data as government agencies can get. In the "final" reports there are enough estimated components that they take another shot at fixing it again. So they make a major revision of everything going back 3 to 5 years. That occurs again this July.
Watch long term trends, not short term data. One of the worst things business owners can do is become preoccupied with short-term changes in economic data. The reports of the first quarter are a great example of why. Let the stock market traders deal with volatile data patterns.
Let's see if anyone dares use the word "recession" any time soon. I don't think we're in for one, but more of this continued muddle which may actually be worse.
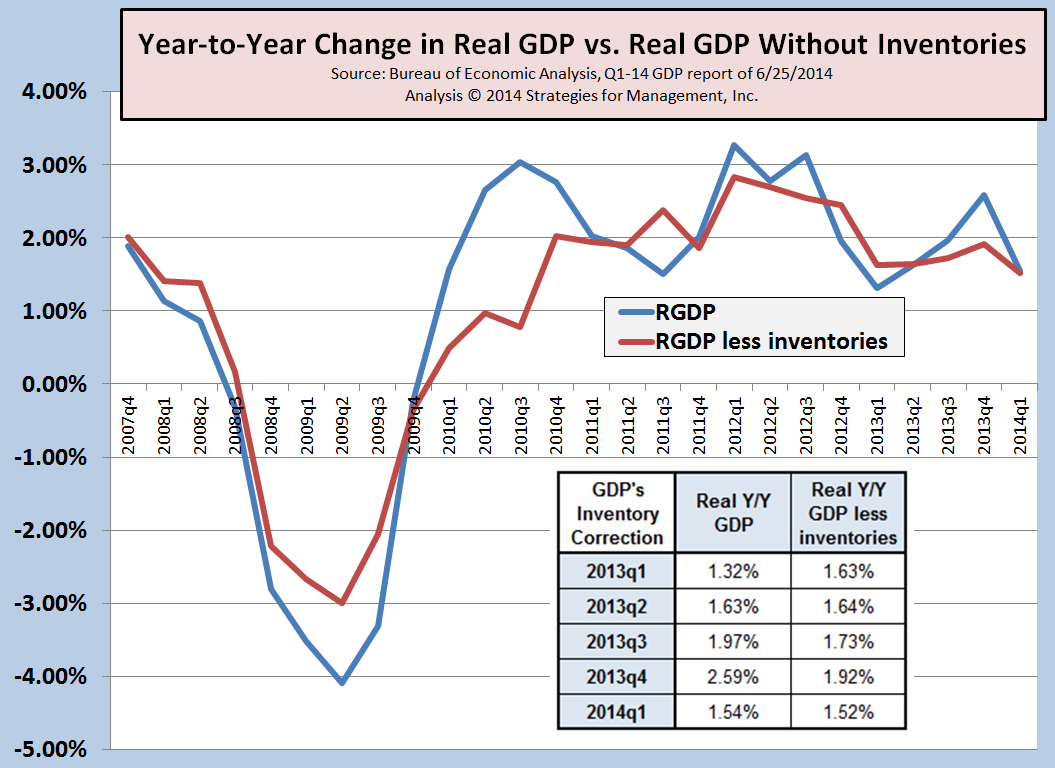
Earlier this year, (in a “laughable and embarrassing” blogpost about the initial Q4 report), I stated that the inventory buildups in Q3- and Q4-2013 did not bode well for the economy in Q1. The reasons for the inventory buildup were related to production cost arbitrage of interest rate expectations and ACA implementation. Both assumptions turned out to be wrong, and the inventories seem to have corrected.
Here's the updated chart, with a data table added. On a year-to-year basis, real GDP growth was +1.5%. It will probably return to a 2% trend. Look for major Wall Street forecasts to reduce their 2014 GDP estimates. No one will mention the "R" word until they start seeing indications appear in new data, especially employment. (click chart to enlarge).
 Updated recovery indicators will be published next week.
Updated recovery indicators will be published next week.
About Dr. Joe Webb
Dr. Joe Webb is one of the graphic arts industry's best-known consultants, forecasters, and commentators. He is the director of WhatTheyThink's Economics and Research Center.
Video Center


![]()

WhatTheyThink is the official show daily media partner of drupa 2024. More info about drupa programs
© 2024 WhatTheyThink. All Rights Reserved.