We recently conducted a survey of WhatTheyThink members and invited others on WhatTheyThink social media sites. The net usable response of the total surveys numbered 208 US commercial printing establishments. For the technically minded, data were analyzed by employee size and then balanced to represent the industry by projecting the employee-size category results to industry demographics as reported in the Census Department report, County Business Patterns (2011).
Business conditions were generally good, with more than 33% reporting business increases of 6% or more. About 13% of respondents indicated business decreases of 6% or more (click chart to enlarge).
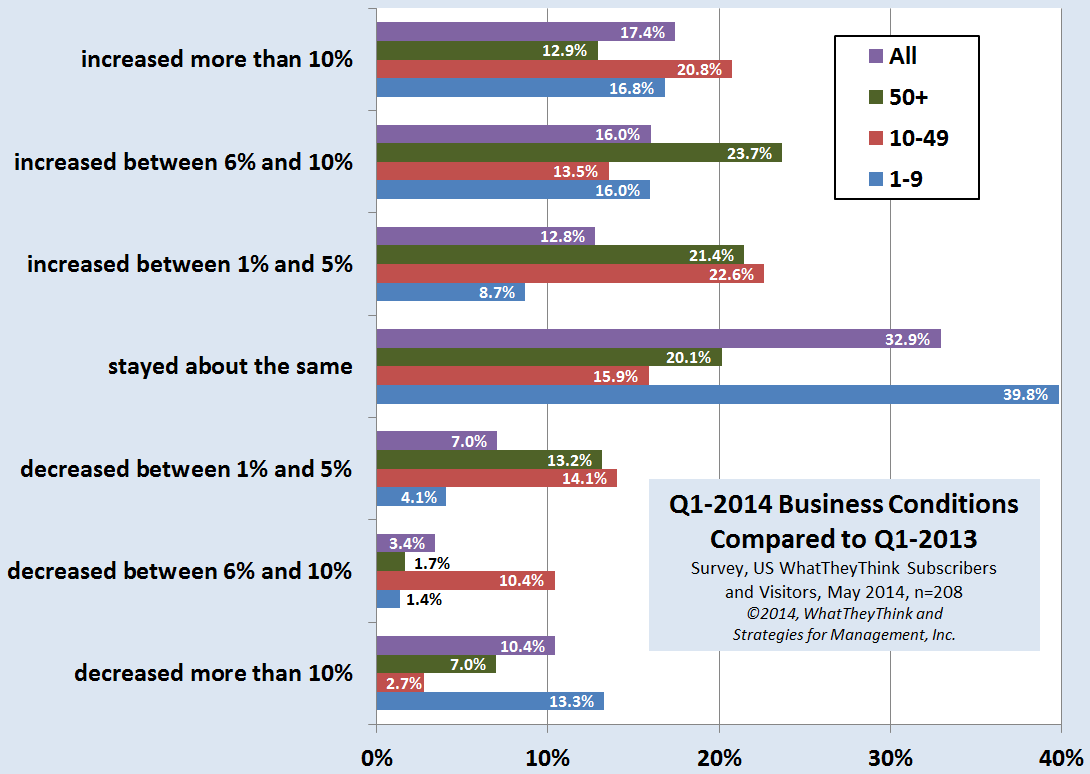
Much of the reason for the increases of recent years has been consolidation effects. Weak companies exit the business (by choice or by being shoved) and their volume is absorbed by survivors (who, presumably operate their businesses better). Acquisitions and tuck-ins did not play a major role for the increases in sales among businesses with less than 100 employees. About 4% of the respondents with less than 100 employees that indicated increases of some measure stated that their increase was from this kind of action.
For businesses with 100+ employees, consolidation effects were a different matter. Fourteen percent of the businesses with 100+ employees reported increases attributable to merger activity. Ultimately, 29% of the businesses with 100+ employees (not specifically shown in the chart as these are aggregated with the 50+ employee group) reported reported increases of some kind, so consolidation was a significant factor in their sales increases.
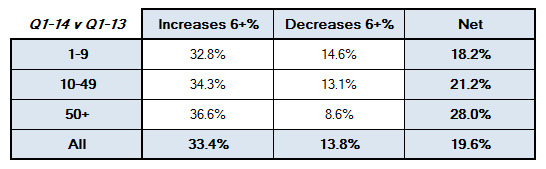
A good way to determine the health of the business overall is to compare the respondents who claimed 6+% increases and those who had decreases of the same magnitude (click chart to enlarge).
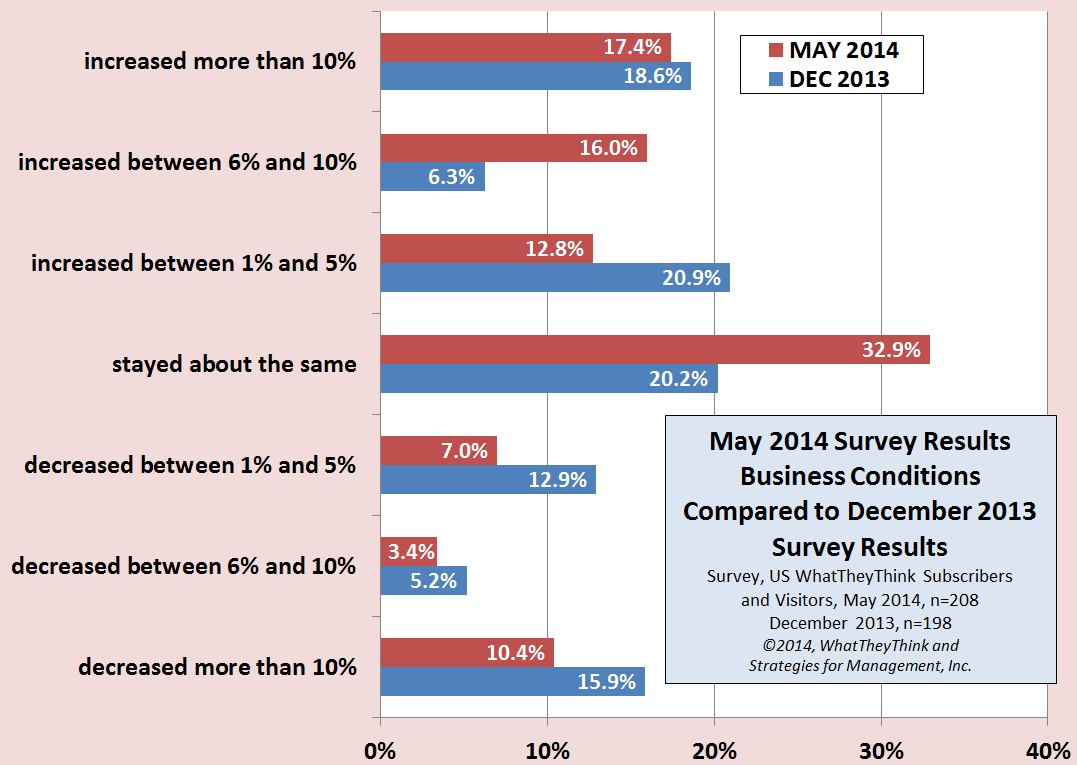
Comparing the current business conditions of this survey to the prior one of December 2013, it can be plainly seen that reported conditions have improved or stabilized. The number of printers with decreasing revenues has fallen from about 33% to about 20%. The percentage claiming business has stayed the same increased from about 20% to about 33% (click chart to enlarge).
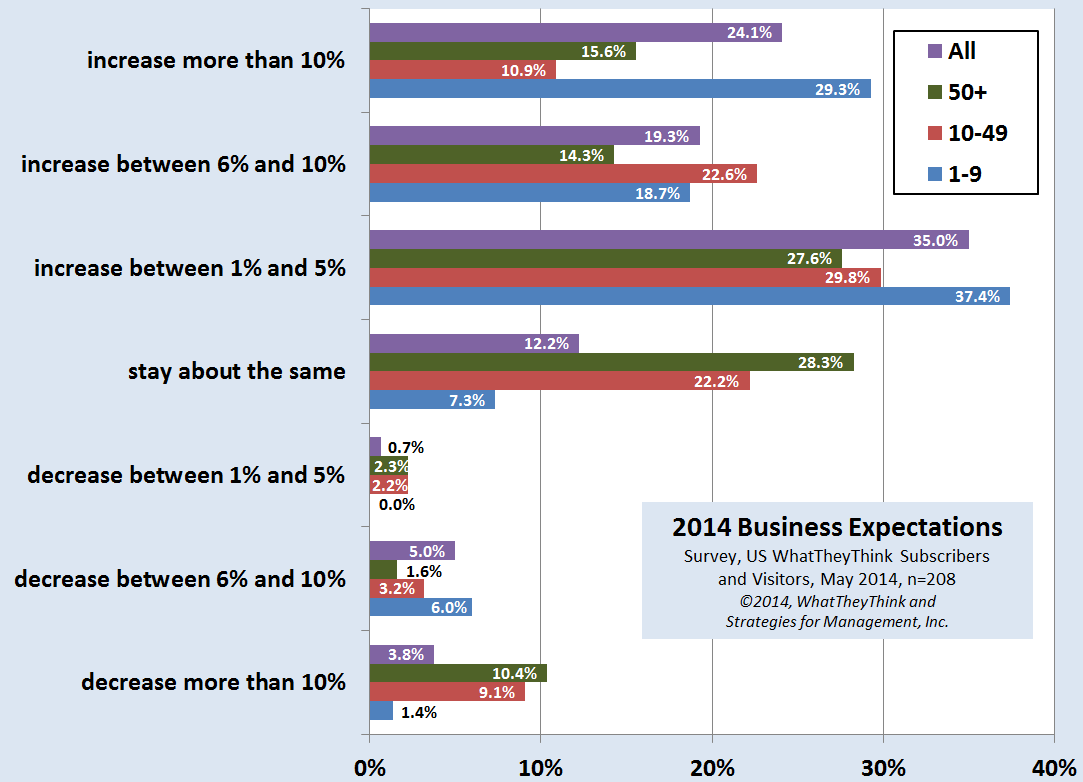
Business expectations for the entire 2014 are more enthusiastic. This is a common pattern in nearly every survey about future business levels: most business owners are optimists at heart, and the future is always brighter. They often expect better results and are then blindsided by downside events or mired in operational issues more than they anticipated. They nearly always pick themselves up and optimistically move forward again, still maintaining that future conditions will always be better than they turn out to be.
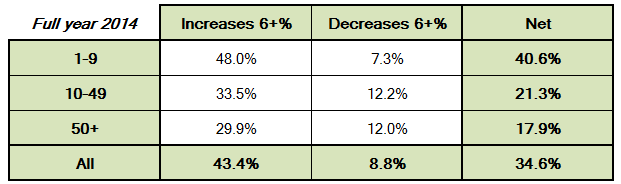
Forty-three percent of the respondents anticipate that 2014 will conclude with revenues 6% or more higher than last year. About 9% believe they will lose revenues of 6% or more. Historically, smaller print businesses (<10 employees) tend to be more optimistic than they should. It's difficult to believe that the 18% of these printers reporting decreases for the first quarter compared to 2013 will gain enough business to become about 7% when 2014 is over (click chart to enlarge).
The table below summarizes the increase/decrease of 6% or more future expectations for the 2014 as a whole (click chart to enlarge).
US commercial printing shipments data for April will be released next week, and are expected to follow the declining pattern experienced since mid-2013. The divergence of these survey data and the shipments data are explained by the positive effects of consolidation and halo effects of survey participation. We have written before about the effects of survivorship on survey data, so any research data need to be viewed through that lens. It appears that the typical printing company is healthier than in prior years, as noted in this survey and as confirmed by the recently released profits data.
* * *
The Commerce Department made no adjustments to the historical printing shipments data series raw data. Every May, the Commerce Department revises five years of data with an emphasis on the most recent three years. These revisions are based on more complete and verified raw data and the results of the Annual Survey of Manufactures and the Economic Census. They did revise the seasonally adjusted data series, which we do not use. We prefer to adjust data for seasonal patterns ourselves using less sophisticated, and we believe more reliable, methods. We use basic 12-month moving totals of the shipments data, including as month-by-month inflation adjustment. Every month, we release data using data adjusted by the Consumer Price Index, but we do track other inflation adjustment methods using the Producer Price Index and others, privately.
On the demographic side, County Business Patterns for 2012 has just been released, and we will be analyzing those data over the next weeks. This release uses the 2012 North American Industrial Classification System (NAICS), which reports the commercial printing industry in four categories. In prior years, there were ten categories. We will prepare estimates and forecasts of industry demographics, and our estimates about what the full ten categories would have been.
In late June, we will release our historical shipments and demographic analysis of the industry in a special report.
# # #


