The Department of Commerce released December 2013 and revised November data.
The Department of Commerce released December 2013 and revised November data. December shipments were $6.271B (-3.7% vs. Dec. 2012). On a current dollar basis, the total for the year was $77.6B, -3.8%. After adjusting for inflation using the Consumer Price Index, shipments were down -5.1%. The chart below shows current dollar and inflation-adjusted shipments starting with 2007 (click to enlarge).
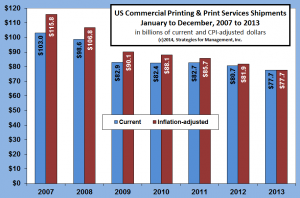
These data are not final; December gets revised next month, then there are other revisions in May. If the Commerce Department follows the same pattern as previous years, they will go back three years with major revisions (2011-2013) and an additional two years of tweaks (2009 and 2010). The major revisions can add or subtract up to $2 billion of shipments for a year, and can change the relationship of shipments for the months, creating a new seasonal pattern. The tweaks usually keep the annual data the same but shift some of the data among the months.
Speaking of seasonality, the chart below shows how the seasonality of printing shipments have changed. The top line is 2007; the recession did not start until December of that year. More important, however, is that was the last year before significant adoption of social media. Facebook and Twitter were nothing. Today they have a combined stock market capitalization of $190 billion. Holiday retail printing is clearly evident in the shape of the line (click to enlarge).
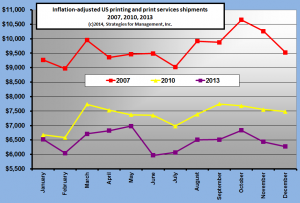
The 2010 pattern shows a much different pattern. Shipments were down, the absence of a holiday printing surge is noticeable. Tablet computing made its first appearance in 2010.
The bottom line is 2013, which shows end of year printing being lower than the beginning of the year. The idea that May is the biggest month of the printing year is confusing to me. From my data investigations it's not that anything special happens in May, it's just that May has declined at a lesser rate than other months.
The lines reflect the media shift away from traditional print. While it was happening, big printing company management kept running their businesses with the assurance that the end of the year would always be big. When that stopped happening, they tended to blame economic factors, and not the media shift. The changes in the importance of end-of-year printing were seen well before 2007, but no one seemed to take note. Eventually, in 2009 and 2010, the realization seemed to finally sink in.
How the patterns will continue to evolve is not really known. In 2013, the first six months of the year were -2.2% compared to 2012 on a current dollar basis, and down -5.1% for the second half.
In 2014, the industry will be dealing with the continued penetration of tablets and smartphones, but also the increase of postal rates beyond the rate of inflation. When 2013 started, I forecast the industry to end up at $77.5, and that was a good forecast. In mid-year, however, I raised it to $78.5, thinking that the first half was better than I thought it would be. I was obviously wrong in the revision.
For 2014, I have a rough forecast of $74.5 billion which I will refine over the next weeks.
# # #


