The headline real GDP for Q4-2013 of +3.2% was much better than the detailed report. Like much of the economic data in recent months, it shows a continuing erosion in economic conditions.
Inventories are the essential number to watch; they played a big role in the +4.1% GDP report for Q3-2013, more than doubling from Q2. The Q4 inventory figure increased yet again, from Q3's $115 billion to $127 billion in Q4. This is distorting the underlying measure of economic activity in a significant way.
Readers know we have a great preference for the year-to-year comparison of GDP data because it smooths out short term trends and yields an overall picture of underlying economic trends. All economic data are flawed in some way, and this method helps deal with the variability often characteristic for this type of data series.
The chart below shows the Y/Y real GDP and a second line for Y/Y real GDP without inventories (click to enlarge):
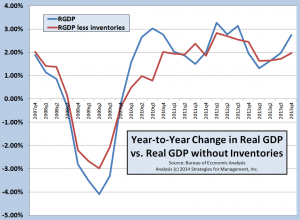
The real GDP without the inventory adjustment shows quarterly growth rates of:
| 2013q1 |
1.32% |
| 2013q2 |
1.63% |
| 2013q3 |
1.97% |
| 2013q4 |
2.74% |
.... and with the inventory removed shows quarterly growth rates of:
| 2013q1 |
1.63% |
| 2013q2 |
1.64% |
| 2013q3 |
1.73% |
| 2013q4 |
1.97% |
Theoretically, the adjustment for inventory in GDP from an arithmetic sense is zero in the long run. Buildups and drawdowns of inventories can occur for many different reasons. I think there's a unique situation that played out in Q3 and continued in Q4.
One of the factors is the Affordable Care Act. Small businesses began to get their first inkling of future benefits costs in Q3 and Q4 and realized that this would affect their labor costs significantly, much in excess of what was popularized, and well beyond the +10% they had become used to over the years. Because of that, labor costs were going to be higher starting in Q1. We already know that companies were cutting back on hours and revealing new work schedules for part time workers and others to minimize the total cost effects of the ACA. This mean that there was an opportunity to build inventory in Q3 and Q4 with significantly lower unit labor cost than in Q1.
Also, companies in good financial standing were anticipating rising interest rates because of upcoming Federal Reserve actions to eliminate quantitative easing programs and to allow interest rates to rise. This meant that borrowing costs in Q3 and Q4 were going to be cheaper than future borrowing costs, and those costs would be going up in Q1.
Lower comparative unit labor costs, the last two quarters of workforce scheduling flexibility in terms of ACA hours limitations and benefits entitlements, and lower comparative borrowing rates, all conspired to create the conditions where adding inventory made sense. With the recent news about economic contractions in the global economy and monetary issues in emerging markets over the past few days, the inventory buildup may come to haunt the businesses involved. Long ago an executive reminded me that in accounting there were three types of inventory, FIFO, LIFO, and FISH. You always wanted to avoid the latter because it meant "First In, Still Here." There is good reason to believe that economic analysts will be decreasing their 2014 GDP forecasts by mid-year.
Whether or not those assumptions play out in real life in 2014 remains to be seen, but they were reasonable assessments of risk at the time. We do know that the full weight of the ACA on business has been delayed to 2015, but there is enough of a rise in 2014 benefits costs after that announcement to continue inventory building. And, businesses know that the total compliance costs of the ACA will be felt in 2015.
Is this the explanation for the rise in inventories despite sluggish consumer and business demand for goods? We won't know for months.
The rise in inventories probably meant shifting of spending priorities from other business functions. Small businesses rely on big business customers for many of their revenues (the idea of small business being an economic driver is way overblown). Proprietors income, one of the key factors in our monthly recovery indicators to be published next week, contracted by -0.6%. This was the first decrease in this data series in four years, in Q1-2010.
# # #