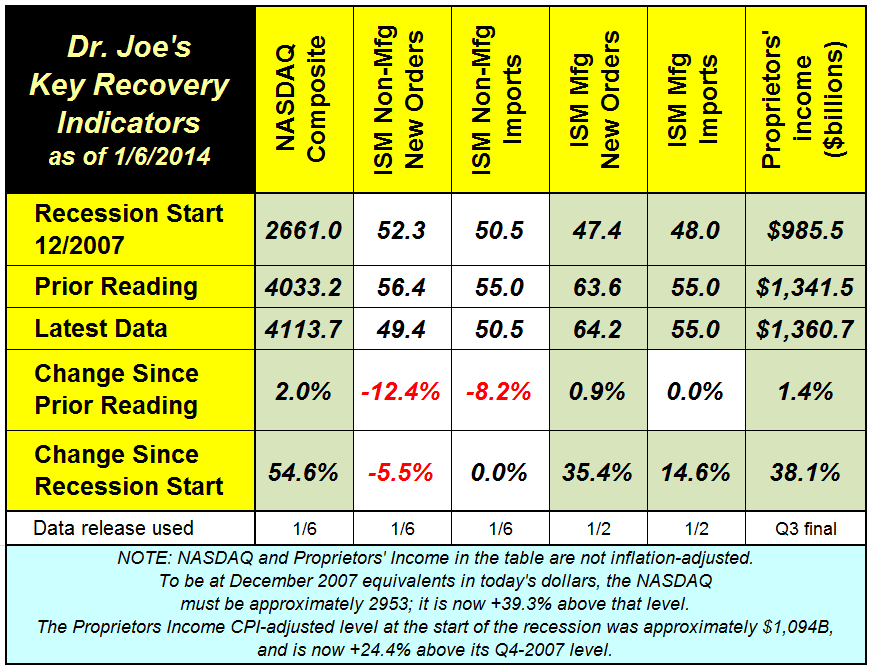
This month's recovery indicators took a step back, with service sector new orders dropping below or equal to where they were at the start of the recession back in December 2007. (click to enlarge chart)
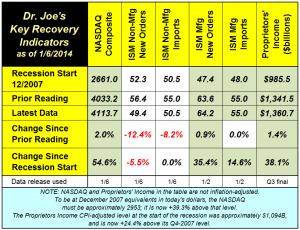
Other data series did better.
The NASDAQ continued to move forward, and is now almost 40% higher after inflation than it was at the start of the recession. Buybacks of stock are a serious concern in the way that they inflate stock indexes (JP Morgan's study in 2013 indicated that 60% of the rise in other indexes was from buybacks and not organic growth), but the NASDAQ has been doing well even in spite of the drag that Apple stock has had on it. AAPL is well below its $700 price in mid-September 2012. Other NASDAQ stocks took over as AAPL fell and the stock recovery broadened. Since September 1, 2012, AAPL is down about 20% while the NASDAQ is up 35%.
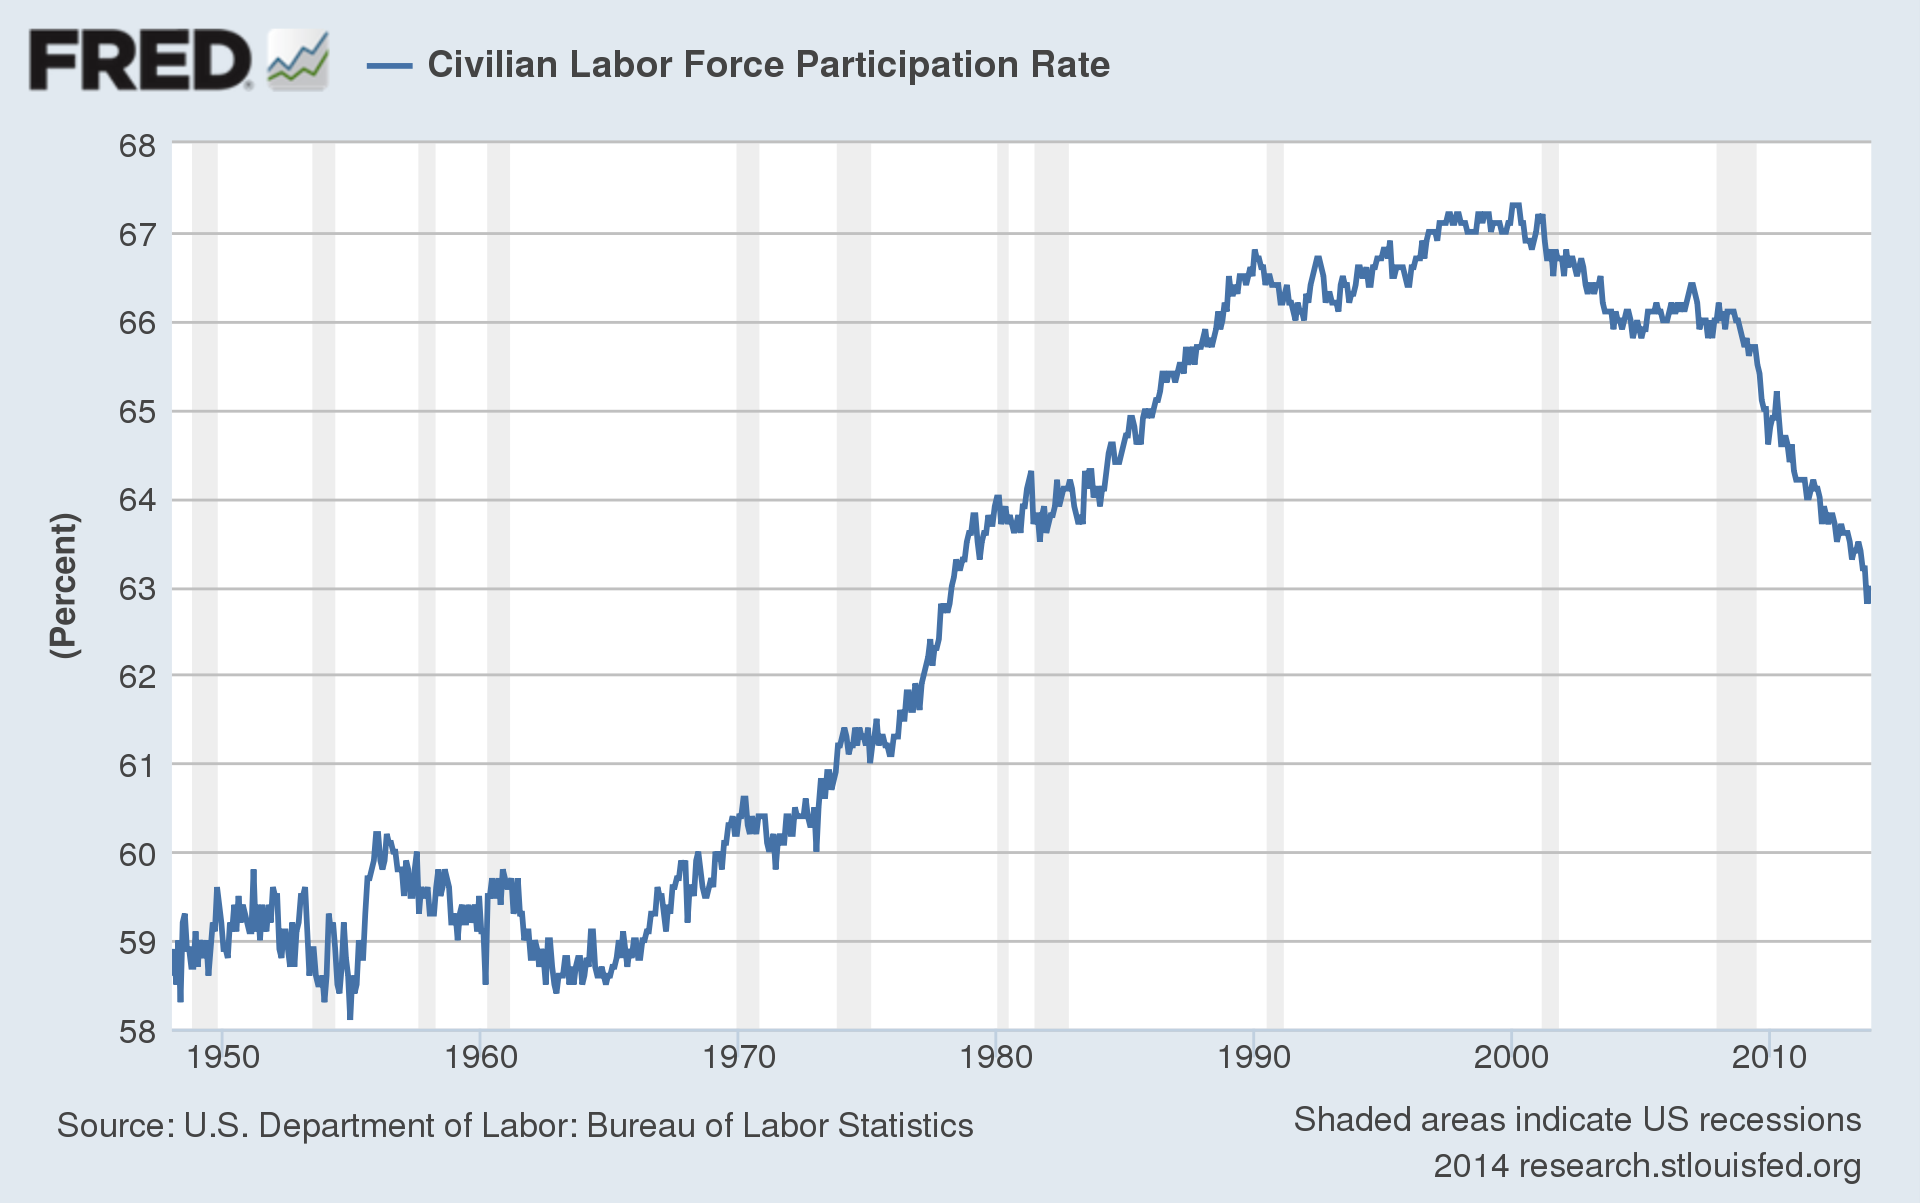
The economy still has many problems as this is the slowest recovery in history, and most important non-GDP measures have not reached the levels they had at the start of the recession. Of those, employment is the most important. Last week, the unemployment rate dropped to 6.7%, but the internal measures of the report were very disappointing. Since December 2012, 3 million people have left the workforce. That decreases the denominator of the unemployment rate calculation, making the unemployment rate look better than the employment situation actually is. The chart below shows how the labor participation rate has fallen to its lowest level in 35 years. (click chart to enlarge)
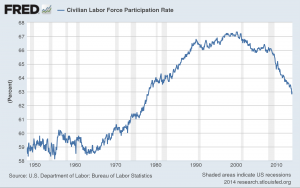
Some analysts claim that the decline is normal because so many boomers are retiring, but many are staying employed. There are, in round numbers, 3 million more people "not in labor force" since December 2012. Since then, the number of workers 65+ years old went from 7.412 million to 7.748 million, an increase of +4.5%. Inside those numbers are workers 75+ years old, which was 1.428 million in December 2013. It was actually less than the figure of December 2012 (1.464), but since the start of the recession in December 2007, workers 75+ years of age is up from 1.136 million, up +30%! The US economy is so large that you can have two strong contrary trends occurring inside the aggregate numbers, and this is a good example of it.
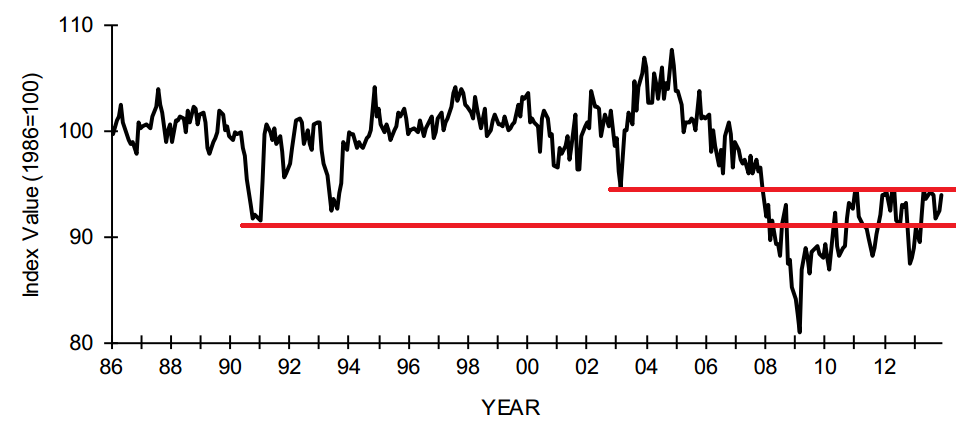
The latest National Federation of Independent Business small business index still shows that the small business economy remains "trapped" between two past recession bottoms.

If you were born in 1982, you have never been employed full time during an economic boom. This may be the worst part of the "new normal": there is a cohort of workers who assume this kind of economy is actually the way it's always been, and the only way it can be.
# # #
 Some analysts claim that the decline is normal because so many boomers are retiring, but many are staying employed. There are, in round numbers, 3 million more people "not in labor force" since December 2012. Since then, the number of workers 65+ years old went from 7.412 million to 7.748 million, an increase of +4.5%. Inside those numbers are workers 75+ years old, which was 1.428 million in December 2013. It was actually less than the figure of December 2012 (1.464), but since the start of the recession in December 2007, workers 75+ years of age is up from 1.136 million, up +30%! The US economy is so large that you can have two strong contrary trends occurring inside the aggregate numbers, and this is a good example of it.
The latest National Federation of Independent Business small business index still shows that the small business economy remains "trapped" between two past recession bottoms.
Some analysts claim that the decline is normal because so many boomers are retiring, but many are staying employed. There are, in round numbers, 3 million more people "not in labor force" since December 2012. Since then, the number of workers 65+ years old went from 7.412 million to 7.748 million, an increase of +4.5%. Inside those numbers are workers 75+ years old, which was 1.428 million in December 2013. It was actually less than the figure of December 2012 (1.464), but since the start of the recession in December 2007, workers 75+ years of age is up from 1.136 million, up +30%! The US economy is so large that you can have two strong contrary trends occurring inside the aggregate numbers, and this is a good example of it.
The latest National Federation of Independent Business small business index still shows that the small business economy remains "trapped" between two past recession bottoms.