Commentary & Analysis
Profits Data Show Resilience of Leading Firms in Tough Economic Times
The PIA Financial Ratios have been published for decades,
The PIA Financial Ratios have been published for decades, and may be the most recognized of the association's publications. There are, of course, problems with all kinds of research gathering efforts, but the positives of the Ratios reports outweigh the negatives from a methodological standpoint. Sure, the Ratios are not based on a carefully selected sample of printers, but are of the voluntary participants who pay to participate. Different firms participate each year, so it's not a longitudinal study of the same groups of printers, but enough do to make it interesting. There is no effective way to understand tax planning issues and their effects on the ratios (such as businesses that purposely have near zero profits to minimize the double taxation of some corporate structures by taking salaries and bonuses). Once can basically hurl all kinds of statistical suspicions at the reports, but they remain the longest running report of printing business performance with a consistently applied methodology.
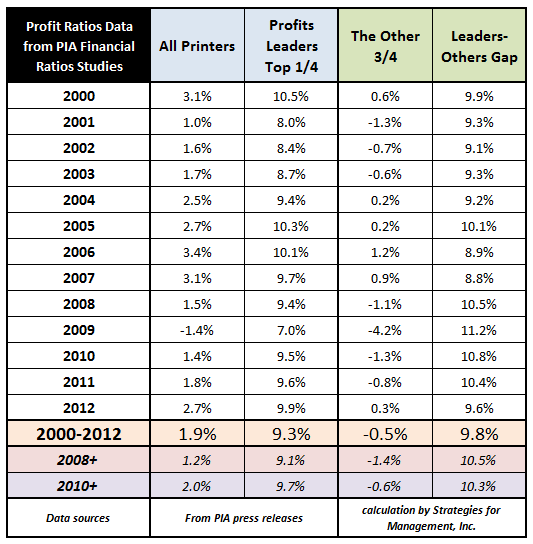
Profit leaders are defined as the top 25% of performers and with a bit of easy algebra, it's easy to tease out what I have referred to as "the other three-quarters" and how they live. The below chart does just that. I'm more interested in the comparative performance of the two groups in slow times. First, a general review of the data shows that for the period 2000 to 2012 the average for all printers was 1.9% and for the leaders it was 9.3%. Once you subtract the profit leaders, the "other three-quarters" averaged -0.5%. That means that the gap between the leaders and the rest of the industry was 9.8 percentage points (it sounds so much more impressive to put it in Wall Street jargon and call it "980 basis points"). (click chart to enlarge)
About Dr. Joe Webb
Dr. Joe Webb is one of the graphic arts industry's best-known consultants, forecasters, and commentators. He is the director of WhatTheyThink's Economics and Research Center.
Video Center


![]()
- 2024 Inkjet Shopping Guide for Folding Carton Presses
- The Future of AI In Packaging
- Inkjet Integrator Profiles: DJM
- Spring Inkjet Update – Webinar
- Security Ink Technologies for Anti-Counterfeiting Measures
- Komori unveils B2 UV Inkjet
- Keeping Nozzles Fresh with Flow
- Komori to Unveil the J-throne 29 Next Generation Digital Press at drupa 2024

WhatTheyThink is the official show daily media partner of drupa 2024. More info about drupa programs
© 2024 WhatTheyThink. All Rights Reserved.