Earlier this year, the Commerce Department issued its report
Annual Survey of Manufactures. It is intended to provide industry data for the years where there is no Economic Census. The Census is conducted every five years and concerns years ending in -2 or -7. The 2007 Census is woefully out of date, probably more than any other Census in my lifetime, with the great volatility of the financial crisis on top of all of the technological changes since that year. Social media had barely started in 2007, and the broad adoption of tablets and smartphones were basically just ideas understood by computer geeks and early adopters. The 2011
ASM is probably the last time we will see any detailed reporting about our industry from the Commerce Department. Because printing's share of GDP has decreased so much, the Commerce Department will not expend its resources to collect detailed data about us, and reallocates its efforts elsewhere.
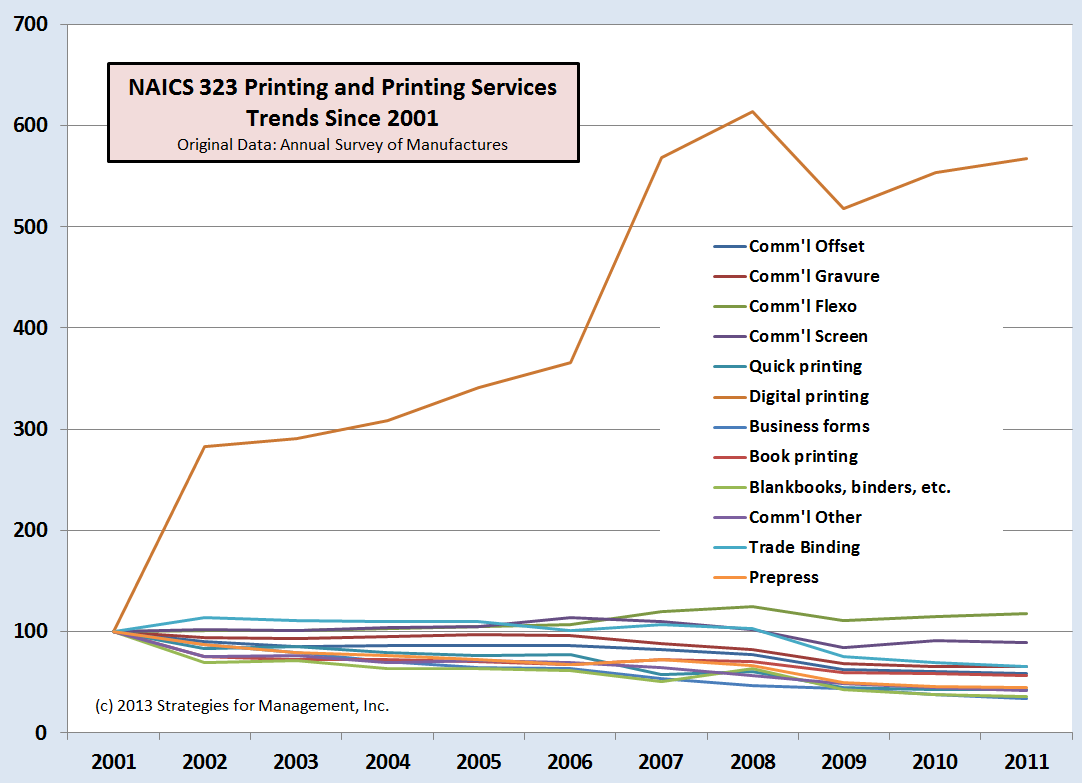
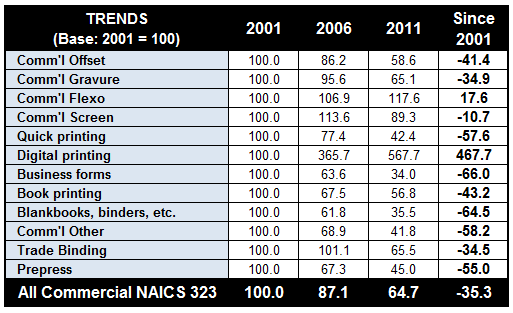
The chart below shows the trends of the major business categories using 2001 as a base year. It's a bit tough to read with all of the segments, so I have added a summary table below it. (click any of the charts in this article to enlarge them)

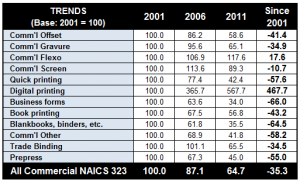
Inflation-adjusted shipments for 2001, 2006, and 2011 show that the only growth categories were commercial flexography (mainly growth in labels) and digital printing, which started from a very low base. Note from the chart that digital printing peaked in its value of shipments in 2008, but its share kept growing throughout that period. That peak period and relative decline were likely related to the financial and real estate crises. The fact that its share would keep growing is not a surprise as digital printing has more applications than ever, and has been taking volume from offset.
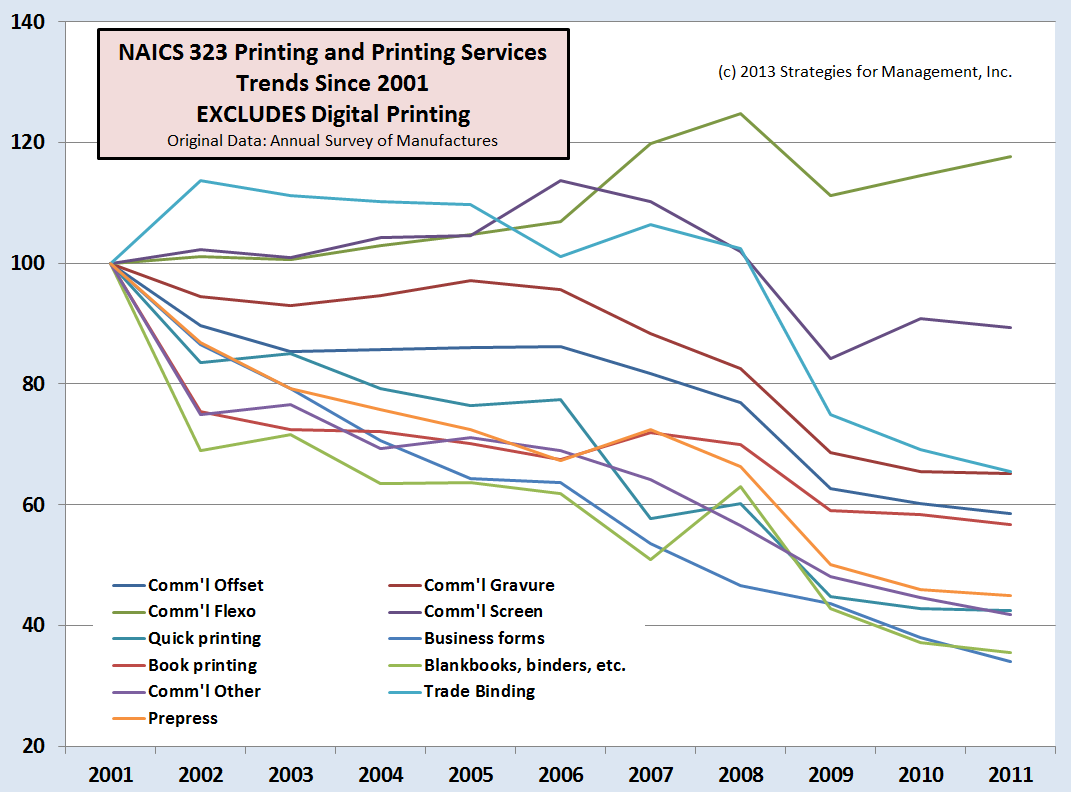
The chart below shows the trends without the digital printing line so the other categories are easier to discern (though the chart still looks like multicolored pasta).

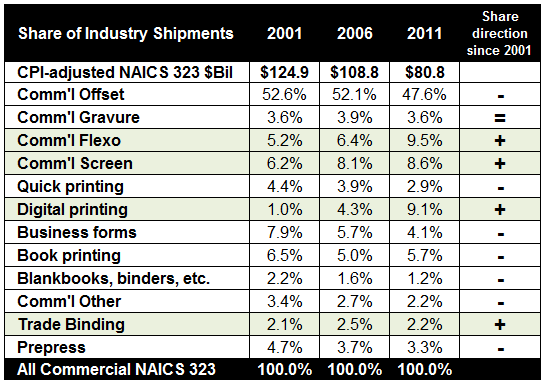
The final table shows the share of shipments by process. Please note that the data do not include packaging, except for labels, inplant and corporate, printing of newspapers by publishers that own their own printing facilities, printing on textiles and clothing, and some other minor categories. Because other categories have declined so significantly, flexo and screen printing have grown in share.
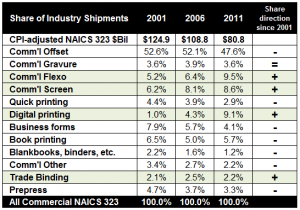
Referring to the prior table, flexo volume is up almost 18% and commercial screen printing is down about 11%. Overall shipments declined by 35% since 2001, but flexo and digital had absolute gains in that period.
* * *
The Economic Census 2012 classifications for the commercial printing will not have breakdowns by print process or major product class. The categories will be as follows:
- Commercial Printing (except Screen and Books)
- Commercial Screen Printing
- Books Printing
- Support Activities for Printing
It is likely that the first data from the 2012 Census will be available in early 2014.
* * *
On another matter, reactions to Apple's quarterly results were mildly hilarious, creating much handwringing among the analysts. Do they really think that Apple is not aware that prices of computers are falling? Or that they have competitors? In spite of Apple's supposed stupidity, 19.7 cents of every dollar they get in revenue is profit... and they are still selling iPads at the rate of 1.87 PER SECOND. In the time it takes to read this sentence, they captured about $9350 in iPad revenue, plus whatever they get from selling data communications contracts.
# # #