The GDP revision of the first quarter 2013 was greater than usual, and in the wrong direction. In April. the advance report of GDP was +2.5%, revised in the preliminary report to +2.4%, and the final report that was released on the morning of July 26 was revised to +1.8%). This statistical "whoops" is larger than usual. GDP is released three different times. The advance report is based on data for two months of the prior quarter and an estimate for the most recent month. Some of the data are estimated for the entire quarter. Then, as the GDP is revised the next month, called the preliminary report, and the month after that with the final report, GDP data includes more reports of actual activity and less estimated data.
There are other factors. Early GDP estimates are based on the activities of large employers which file payroll taxes and reports of activity more often than small businesses. Reports from small businesses are less frequent, and they are often the reason why government data are revised significantly. And then, there is another factor, seasonal adjustments. GDP is always reported as an annualized number. To do so, statisticians must adjust data using seasonal adjustments that reflect the normal ups and downs of many industries. Travel industries have different seasonality than education industries, for example. Retail businesses have different patterns than B2B businesses. All of the components of GDP are adjusted in some manner. But seasonality is based on prior history, and the economy is very dynamic, especially when technological changes are taken into account. Past recession histories are significantly different than this past recession's pattern.
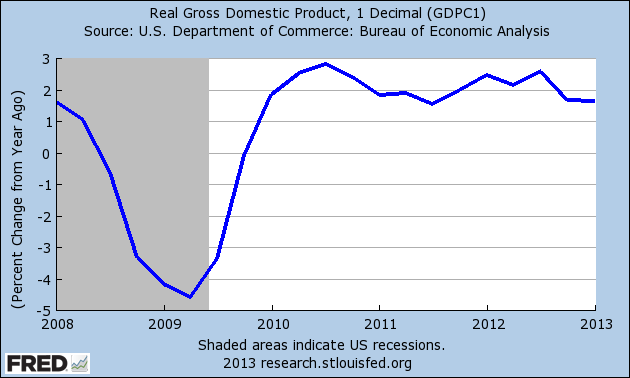
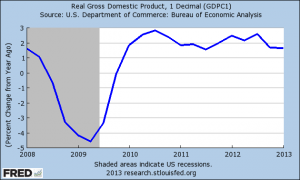
For this reason, I have always preferred the year-to-year comparison, which tends to smooth data variances, reporting issues, and seasonal factors. The chart below shows that the pace of the economy is moving sideways at best, but has a downward bias. The Y/Y change in GDP was first reported as +1.8%, revised to +1.78%, and is now +1.62%. This is not an economy that inspires great forward-looking confidence. (click chart to enlarge)
There have been many reports that the Federal Reserve will stop its quantitative easing activities sometime next year. This sent the bond and stock markets into a downward spiral with occasional rebounds. The NASDAQ has dropped from 3489 to 3348 in the last month, which is rather minor. It started the year at 3112, so it is not as bad as it seems when you look at the number during the trading day. Bonds have dropped in value, but have become good values again when they have been overpriced for some time.
While it is likely the Fed will slow down, it is not likely that they can end quantitative easing. The economy is showing signs of weakening. Economic indicators other than GDP are not fully recovered to pre-recession levels and employment in terms of raw numbers of people employed still has a ways to go. Incomes are stagnant. Even though housing is improving, some of the increase in prices is the result of banks releasing foreclosed properties to the market carefully as they attempt to control supply in hopes of higher future prices. While the Fed should increase rates because these levels cause misallocations of resources, they still need to prop up the collective balance sheets of the banks.
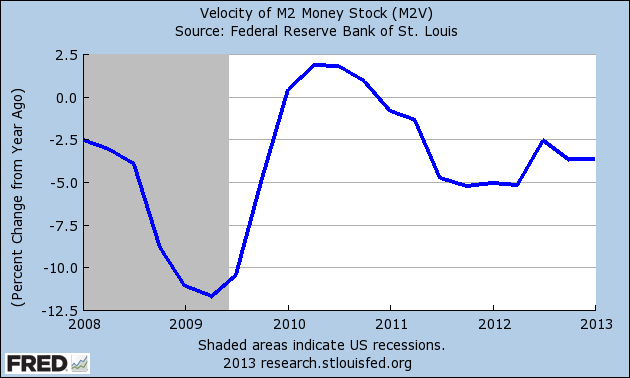
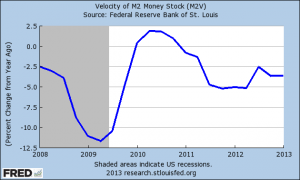
One of the interesting characteristics of the very weak recovery is that the velocity of money (GDP in current dollars divided by the money supply) is still slowing, as noted by the chart below. Money may have been created, but it's not circulating, which is what is keeping inflation (supposedly) "tame." (click to enlarge)
We have never had the breakout quarter of GDP that marks the true end of a recession (a quarter of +5% to +7%) and we have not come close to the post-WW2 average of +3.4%. This remains a stagnant economy where backwards-looking emphasis on efficiencies are chosen as projects rather than forward looking expansion projects. The efficiency spending has the benefits of quick and measurable returns that are easily approved by management. Forward-looking expansion projects have to withstand the scrutiny of the calculation of the future value of cash flows, payback period, and return on investment. Those values are discounted by tax rates and inflation more than they are by the cost of borrowed money. An inability to forecast future demand (what number to use for underlying economic growth, 2% or the WW2 average?), prices of materials (the "tame number" of 2% for the annual increase in PPI, or the likelihood of 5% if inflationary forces or higher economic growth rates) and tax rates (current rates or the likelihood of higher rates as governments have higher deficit funding needs because tax collections are lower than anticipated because of slow economic conditions?). I have my opinions of these (2%, 5%, and 45% for sub-S corporations), but all of these have an effect on which future projects get funded. Companies often choose high desired ROI rates (25%+) as their reward for taking risks. Until the risk profile of net present value calculations change, the bar is too high for projects that would drive strong economic expansion. Choose your projects carefully.
# # #