Commentary & Analysis
Recovery Indicators Still a Mixed Bag, but the Bag May Have a Leak
This month'
This month's recovery indicators show an economy that stumbled a bit. Last month it was a mixed bag, this month the bag leaks. The NASDAQ is up since last month, but in the last few days has taken a beating with other parts of the stock market. The ISM non-manufacturing new orders increased, but imports dropped significantly, from strong growth to a slight decline (for the ISM, 50 is the dividing line between growth and decline). The imports are now below their level at the start of the recession. Manufacturing new orders fell, as did manufacturing imports. Imports are important because they are often materials used in production that are not available stateside (such as coffee beans), Q1 proprietors' income was revised up by $8 billion, the only part of the recovery indicators that did better. Because it is a quarterly figure, it is not reflective of the most recent business conditions. (click chart to enlarge)
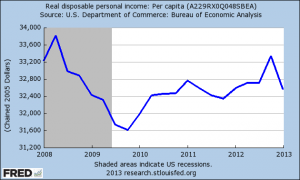
There have been other economic data released that show a slowing or less than satisfactory economy. The productivity report showed that worker compensation fell in Q1, but all income data are subject to question because many workers received payments in anticipation of higher taxes in Q4-2012. It will take a while for the full effects of that tax planning to be understood. Other reports about income such as real disposable per capita income show that income has been relatively stagnant. (click chart to enlarge).
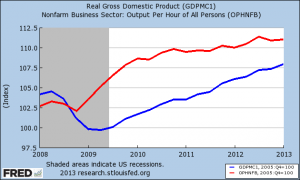
In terms of employment, it is not likely that Friday's employment report will show anything different than a sideways moving economy. Productivity has been running ahead of GDP, which means that employers are keeping up with demand and do not need to expand employment. (click chart to enlarge).
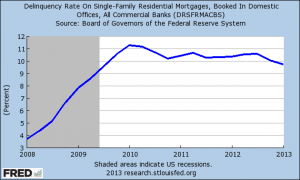
One of the areas of constant drumbeat among the cable news talking heads is the improvement in housing. Other than short-term changes here and there, there are still serious problems in housing. The chart below (click to enlarge) shows that the percentage of mortgages that are behind. While it's slightly better, it's still very bad. (click to enlarge)
Barron's reported this past weekend that “According to a recent FHA report, the average down payment required on its insured mortgages in the first quarter has been a little over 4%. The VA's rather chilling statistical category called No Down Payment indicates that close to 90% of its home loans normally enjoy this status. Recent data are not available for the share of all mortgages insured by the FHA and VA. But we do know they accounted for a hefty 46.4% of all mortgages in 2011, way up from an average of about 10% from 2004 to 2007, just before the Great Recession.” You'd think the lesson that higher down payments ensure greater home ownership stability would have some credence after the housing crisis and the recession. There is such economic desperation that it is still believed that unless aggressive approaches are taken with housing the economy can't grow, or will head back into deep recession. The Fed is still trying to inflate housing prices to get homeowners out from “underwater” conditions where their mortgages are greater than the values of their homes. Some banks have stopped putting foreclosed properties on the market in hopes that they can sell at higher prices if they limit the supply of these homes. Until personal incomes after taxes start to rise, housing may look better on a short term basis, but compared to pre-recession levels, even discounting the housing bubble, housing data are still nothing to be impressed about.
And if you think I'm Dr. Doom, you should read Heidi Moore of the UK Guardian, who has summarized the essential economic concerns quite well.
# # #
About Dr. Joe Webb
Dr. Joe Webb is one of the graphic arts industry's best-known consultants, forecasters, and commentators. He is the director of WhatTheyThink's Economics and Research Center.
Video Center
- Questions to ask about inkjet for corrugated packaging
- Can Chinese OEMs challenge Western manufacturers?
- The #1 Question When Selling Inkjet
- Integrator perspective on Konica Minolta printheads
- Surfing the Waves of Inkjet
- Kyocera Nixka talks inkjet integration trends
- B2B Customer Tours
- Keeping Inkjet Tickled Pink
© 2024 WhatTheyThink. All Rights Reserved.


