Commentary & Analysis
US Commerce Department Revises Last Two Years of Printing Shipments Up Slightly
The US Commerce Department issued its annual update of manufacturing shipments data last Friday.
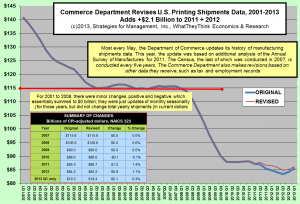
The US Commerce Department issued its annual update of manufacturing shipments data last Friday. The bottom line is that they increased each of the last two years by about $1 billion, but the increases were not enough to increase annual shipments after inflation.
The revision process is constant. Every year, five historical years are revised, with the greatest changes to the most recent three years and the first three months of the current year. The following chart summarizes the changes. (click to enlarge)
Last year, the reported data showed a new seasonality, with May becoming a more prominent month. This was quite a surprise for us, as March had become the most important month of the year. Years prior, the big retail printing season related to Christmas and holiday sales, had been the most important printing season, but it gradually diminished by 2008. This left March to be a big month, probably driven by projects started with new corporate projects in January.
Last year's revisions revised shipments down, even those of the beginning of the year, and the Commerce Department reported a big May, so much so that it became the best month of the year. This is still hard for us to understand, but from looking at the historical data it could just be that May sales have just declined at a lesser rate in recent years. It's not May sales have been increasing, it's that they're just down slightly less than other months.
There is the chance that May as the biggest month is a statistical error in the seasonality adjustments made by the Commerce Department. From what we have been reading, there is great concern that the protracted economic problems have meant that seasonal adjustment methods are grounded in economic assumptions that are better fits for typical patterns but not this one, which has definitely been atypical.
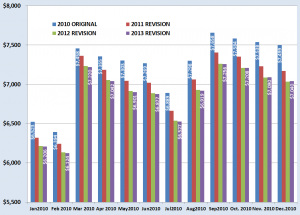
We've prepared a chart of 2010 data that shows the revisions made since their original release. This shows some of the process, and underscores that it takes about three years for the government to have all of the economic data it needs to finalize its figures. Remember, 2010 was the first full year after the economic recovery began in June 2009. The initial reports were not particularly good, but they showed an industry that was about equal to 2009. The figures were revised down, significantly, in 2011, then slightly so in 2012. The 2013 revision did little to change 2010's shipments data. (click chart to enlarge)
Collecting and reporting industry statistics is difficult work, and we appreciate the daunting task that the Commerce Department has. But as managers, we have to make decisions based on the data that we have at the time. It is essential to realize that all new data about markets is "softer" than most analysts admit. The toughest market to estimate is a new one. After all, look how difficult it is to get an old, established market right... and still we have questions.
# # #
About Dr. Joe Webb
Dr. Joe Webb is one of the graphic arts industry's best-known consultants, forecasters, and commentators. He is the director of WhatTheyThink's Economics and Research Center.
Video Center
- Questions to ask about inkjet for corrugated packaging
- Can Chinese OEMs challenge Western manufacturers?
- The #1 Question When Selling Inkjet
- Integrator perspective on Konica Minolta printheads
- Surfing the Waves of Inkjet
- Kyocera Nixka talks inkjet integration trends
- B2B Customer Tours
- Keeping Inkjet Tickled Pink
© 2024 WhatTheyThink. All Rights Reserved.


