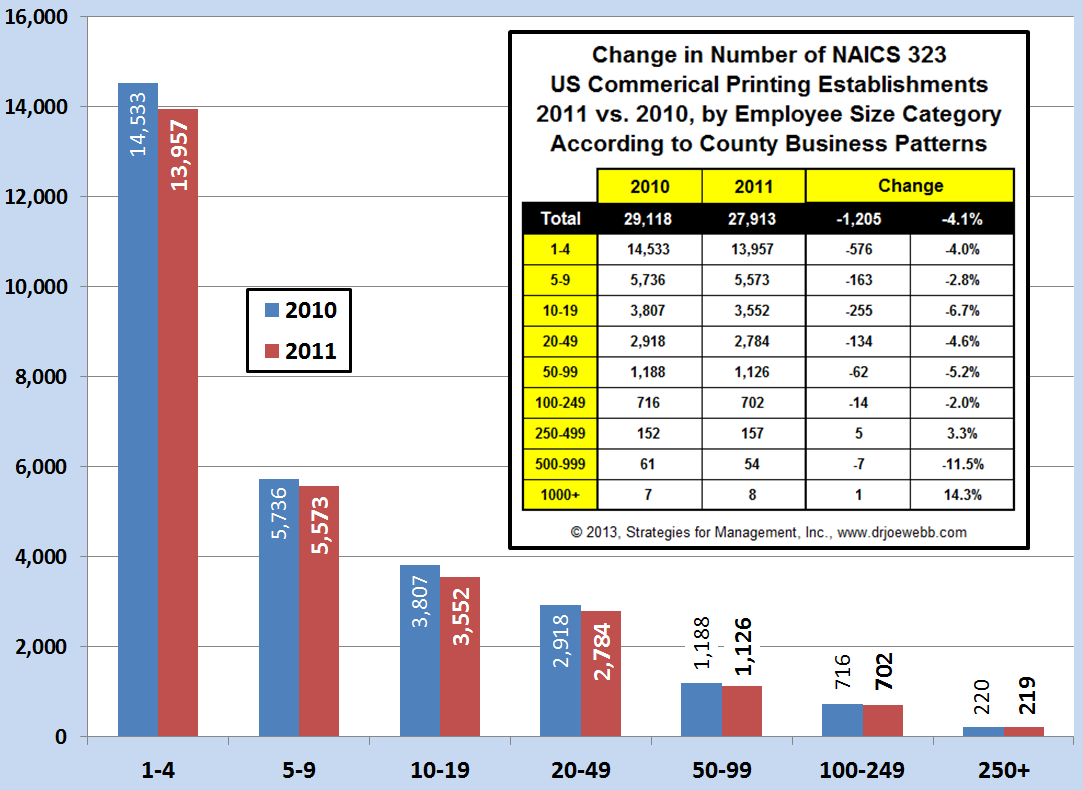
The Commerce Department recently released the latest edition of County Business Patterns data about the number of US business establishments in 2011. Those data indicated that commercial printing establishments declined -4.1% compared to 2010. The biggest percentage declines were in establishments with 500 to 999 employees (between about $90 million to $200 million in sales), which fell by -11.5%, and establishments with 10 to 19 employees (about $1.5 million to $3.5 million) which fell -6.7%. (click chart to enlarge)

CBP printing data 051513

The reason for the declines are numerous, from outright closure, and also acquisition or merger. Establishments can shift sizes, of course. Usually, troubled printing establishments don't die without a protracted downward spiral. They decrease in size over time, and then, even after production stops, they still may have a few employees on the books to handle final administrative tasks like final tax returns and official dissolution. Companies can also increase their size, as there was an increase in establishments with 1000+ employees, probably a consolidation process for that particular company. Sometimes the increase is statistically meaningless, such as a company right on the edge of an employee size interval going from 998 employees to 1001. The increase is meaningful to those four employees, but not meaningful from a total market perspective. The definition of establishment is important to note; a printing firm can own multiple establishments, so it's worthwhile thinking of it as a location. If a firm had two establishments of 25 employees and consolidated into one building, the establishment count for the 20-49 employee category would decrease by 2 and the 50-99 category would increase by 1. Industry output would not change in a meaningful way because the same number of employees would be working at the combined location. Over the years, the nature of the change has been different. Some years the decrease has been predominated by the decline of trade service businesses (such as the loss of color separators, trade typographers as desktop publishing and imaging took hold), and other times the change is dominated by printing companies. Since 1993, the number of printing and print service establishments has decreased about 1,000 per year. Over the years, that 1,000 change has been rather consistent, but it represents a larger and larger percentage of a shrinking total. Back when there were 40,000 establishments, 1,000 was only 2.5% of the total. Now that it's 28,000, that 1,000 is about 4% of the total. The approximate -1,000 annual decline is a net number, which hides the constant restructuring of the industry from a legal perspective. One of the Commerce Department reports, called "birth-death data," shows that there is usually a flow of +2,000 new business entities and -3,000 closures, for a net change of -1,000. This can be as simple as someone closing one corporation and opening another for any variety of reasons, such as closing a partnership to open a corporation. I have long pointed out that the interest in mergers and acquisitions in the industry ignores what is a regular restructuring of smaller print businesses. We hear about mergers of companies that have 100 or more employees because there is an outside financing deal and an M&A consultant who did the matchmaking and some post-deal public relations. We never hear stories about two business owners grumbling about business at a local diner, whining about their worries about the future, and then deciding that they should close their businesses and start a new one together. It's far easier for small businesses to close and start new than it is to merge. In the process they can deal with family, personal tax planning, and other issues by having them die with their old businesses rather than negotiating over them, which only diverts attention from starting a better business than what they had. Over the next months, we will provide more detailed analysis of industry demographic changes, and which segments are changing more and which are changing less. We will also review the data for content-producing industries, such as publishers, in upcoming posts. This was the earliest date of release for County Business Patterns that I am aware of. Usually the data are not released until June. The data are always for the first quarter of the year specified, so this is a snapshot as of mid-March 2011, about two years ago. Back in the 1980s, it was common that these data would be three years old before they were released. County Business Patterns data are based on filings of Social Security taxes, which is required by law. This makes the data more reliable that survey data, since there is the weight of negative legal consequences for non-compliance. This is why these data become a baseline for B2B market projections. This does not mean that the data are always in the format that are needed, or that they can help understand upcoming market changes. The NAICS business classifications always look backward; until an industry reaches a substantial enough size, it will not be assigned a separate business classification. This means that new industries remain hard to track using government data. As I've always said, if you want hard reliable data, start with a huge declining industry, much like the old joke that becoming an Internet millionaire requires starting with $10 million. Nonetheless, these data are an important foundation. Much like a house has a foundation, the structure sitting on the foundation can be renovated or redecorated but the foundation remains the same. * * * Our staff is especially skilled at using these data, which are also available on a state by state and county by county basis; please contact me if you want to explore use of the data for sales territory or channel planning, market sizing, market forecasting (we have extensive historical data that allow us to do this), and other applications. * * * Friday, May 17 is a very important day in terms of statistics. The Census Department releases its annual revisions to historical manufacturing shipments data. If the release follows a usual pattern, the last three full years will be revised (2010 to 2012) and the first months of this year will be revised as well. Then about five years back they make minor revisions to data seasonality where monthly data change but the annual total does not. There were some quirks in last year's revision, and we're anxious to see what changes they make this time. We'll report on the changes next week. # # #