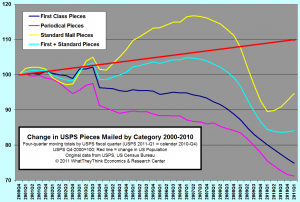
The change in our postal habits is no surprise, and the financial woes of the USPS are well-known. The chart below (click to enlarge) shows US population from 2000 to 2010 as the red line (+9.7%); that is the baseline against which to judge. It's easy to compare from year-to-year, but that does not make a true comparison. Much like adjusting dollars for inflation, things that are not monetary, like the number of pieces of mail, should be compared in this manner.

Using 2000 as the base year, pieces mailed for first class is down -25.2%, standard mail is down by -5.3%, the combination of first class and standard mail is down -15.9%, and periodicals are down -28.8%. In the chart the rise in standard mail is most likely the large number of credit card and mortgage refinancing promotions; note that standard mail is coming back up again, but when combined with first class, it is now flat.
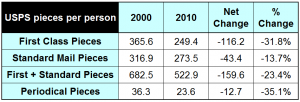
When we look at them on a per person basis, the difference is greater. The table below (click to enlarge) shows that the average person is getting 116 fewer first class pieces, 43 fewer standard class pieces, for approximately 160 fewer pieces a year. That same average person is getting 13 fewer periodicals over the year. To roughly equate these data to households, multiply these amounts by 3. (These data include business addresses; there is no way that we have found to determine which items are delivered where using publicly available USPS data; perhaps those data exist somewhere at the USPS). Note how the percentage changes on this per person basis are greater than just by looking at total volume. On this basis, the combination of first class and standard mail is down -23.4% compared to -15.9%.

The degree of change in the way mail is used is more shocking in this format, especially for magazines. Yet there is a
seemingly endless supply of research data that explains how effective magazines are as advertising media, what great reach they have, and how critical they are to individuals and households. I have no doubt that the research does indicate these things. What is missing from the research, however, is the dramatic change in frequency, quantity, and physical dimensions of printed items no matter how much we enjoy them. Preference and likability are different metrics, and they actually tell us little about frequency, quantity, and dimension, which are critical aspects in understanding printing volume. The same goes for direct mail; as much as it is referred to as "junk mail", it does still have an essential use, and the rules for its effective use in this digital communications age are not fully understood. I miss the days of the checklists for effective direct mail campaigns; I devoured them in college and in a small business I once owned. Now it seems the checklists go out of date as they are written. Effective campaign management is now hyper-nuanced based on the product and target audience. I think we all miss the checklists of a simpler time before the media chaos.
There is a time and place for the exploration of emotional factors like preference and likability; but the hard realities of the business of print still end up with frequency, quantity, and dimension as drivers of our printing economic engine. Grappling with that fact is what drives the restructuring that is well underway.
 Using 2000 as the base year, pieces mailed for first class is down -25.2%, standard mail is down by -5.3%, the combination of first class and standard mail is down -15.9%, and periodicals are down -28.8%. In the chart the rise in standard mail is most likely the large number of credit card and mortgage refinancing promotions; note that standard mail is coming back up again, but when combined with first class, it is now flat.
When we look at them on a per person basis, the difference is greater. The table below (click to enlarge) shows that the average person is getting 116 fewer first class pieces, 43 fewer standard class pieces, for approximately 160 fewer pieces a year. That same average person is getting 13 fewer periodicals over the year. To roughly equate these data to households, multiply these amounts by 3. (These data include business addresses; there is no way that we have found to determine which items are delivered where using publicly available USPS data; perhaps those data exist somewhere at the USPS). Note how the percentage changes on this per person basis are greater than just by looking at total volume. On this basis, the combination of first class and standard mail is down -23.4% compared to -15.9%.
 The degree of change in the way mail is used is more shocking in this format, especially for magazines. Yet there is a seemingly endless supply of research data that explains how effective magazines are as advertising media, what great reach they have, and how critical they are to individuals and households. I have no doubt that the research does indicate these things. What is missing from the research, however, is the dramatic change in frequency, quantity, and physical dimensions of printed items no matter how much we enjoy them. Preference and likability are different metrics, and they actually tell us little about frequency, quantity, and dimension, which are critical aspects in understanding printing volume. The same goes for direct mail; as much as it is referred to as "junk mail", it does still have an essential use, and the rules for its effective use in this digital communications age are not fully understood. I miss the days of the checklists for effective direct mail campaigns; I devoured them in college and in a small business I once owned. Now it seems the checklists go out of date as they are written. Effective campaign management is now hyper-nuanced based on the product and target audience. I think we all miss the checklists of a simpler time before the media chaos.
There is a time and place for the exploration of emotional factors like preference and likability; but the hard realities of the business of print still end up with frequency, quantity, and dimension as drivers of our printing economic engine. Grappling with that fact is what drives the restructuring that is well underway.


