 The top of the list is non-store retailers, such as e-commerce sites, which are up +9% in real terms for June 2010 compared to June 2009. The share of these retailers in total retail sales has gone from 7.1% to 7.5%. Only food and beverage stores were below June 2009.
The point is that most news reporting is not about true data comparisons, but what results were for expectations.
For the first six months of the year (not in the chart), retail sales are up about 4.5%. Excluding motor vehicles, they're up about 3.8%. Non store retailers are up about 10%. Food & beverage is flat.
Friday, July 16, is a very important report: the consumer price index. We'll comment about inflation in next week's blog post, and provide updated multipliers for adjusting previous years dollars to see the real trends in your business.
I recently updated historical book sales for inflation, and they show some trends that are quite different than the unadjusted data. View the spreadsheet in your browser.
Commentary & Analysis
Don't Believe the Papers: Retail Sales are Better than Reported
The June retail sales data released on Wednesday,
The June retail sales data released on Wednesday, July 14, were not as bad as reported in the press. The main storyline was that they did not meet expectations. Those expectations don't include a sense that the economy is moving sideways. There's such a hope that every bit of economic data will have the great news that there is an economic boom emerging. If that's the backdrop, then certainly every economic bit of data will disappoint.
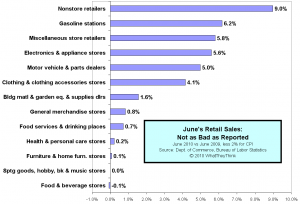
But the chart below shows the comparison of retail sales by channel. I have subtracted two percentage points from each to account for inflation. Look... it's no so bad that anyone should run for the hills:
 The top of the list is non-store retailers, such as e-commerce sites, which are up +9% in real terms for June 2010 compared to June 2009. The share of these retailers in total retail sales has gone from 7.1% to 7.5%. Only food and beverage stores were below June 2009.
The point is that most news reporting is not about true data comparisons, but what results were for expectations.
For the first six months of the year (not in the chart), retail sales are up about 4.5%. Excluding motor vehicles, they're up about 3.8%. Non store retailers are up about 10%. Food & beverage is flat.
Friday, July 16, is a very important report: the consumer price index. We'll comment about inflation in next week's blog post, and provide updated multipliers for adjusting previous years dollars to see the real trends in your business.
I recently updated historical book sales for inflation, and they show some trends that are quite different than the unadjusted data. View the spreadsheet in your browser.
About Dr. Joe Webb
Dr. Joe Webb is one of the graphic arts industry's best-known consultants, forecasters, and commentators. He is the director of WhatTheyThink's Economics and Research Center.
Video Center
- Questions to ask about inkjet for corrugated packaging
- Can Chinese OEMs challenge Western manufacturers?
- The #1 Question When Selling Inkjet
- Integrator perspective on Konica Minolta printheads
- Surfing the Waves of Inkjet
- Kyocera Nixka talks inkjet integration trends
- B2B Customer Tours
- Keeping Inkjet Tickled Pink
© 2024 WhatTheyThink. All Rights Reserved.


