As I've traveled the country in recent months, I would often get the questions “Are we at the bottom yet?” and “When will things get better?” I don't know the answers for these questions, especially when I believe that we will have a slow economy for quite a while, and that this situation gives greater impetus for shifting to digital alternatives at a faster rate.
That doesn't mean that we're not busily hunting for economic clues. Among the more interesting ones we've been investigating is the relationship of printing shipments with stock market indices. Because printing shipments fluctuate considerably from month to month, we used a 12-month moving total, adding a new month, and dropping the oldest month as we moved from month to month. In this way, all of the shipments data were annualized. We did not inflation-adjust the shipments since the S&P is not inflation adjusted.
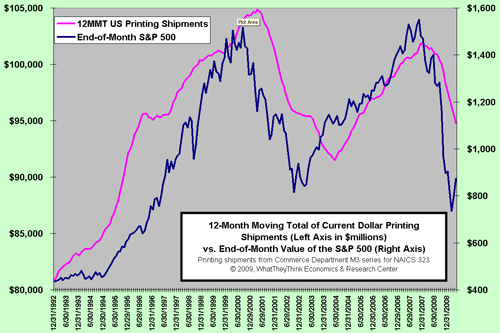
The Dow Jones 30 Industrials comparison was not statistically compelling, but the S&P 500 and NASDAQ were. The chart below is of the S&P 500:
The first thing that we noticed was that printing shipments moved ahead of the S&P until the end of 1999. Shipments kept going up, even though the S&P started is decline in the Spring of 2000, and then shipments began to decline. That is, printing could have been a leading indicator on the left side of the chart and then began to lag the S&P on the right side.
How strong is the relationship? For the entire period of the chart, the r-squared is 74% (GDP's relationship yields a 60% measure). It was particularly strong until 2000, giving an r-squared value of 85%, which would make it an excellent sales forecasting model. For the period of 2000-2007, the statistical relationship breaks down, and is 35%.
Realizing this, and seeing how the chart showed printing shipments lagging an S&P change, we checked what lag-time might improve the score. The best r-squared value we could get was 71% when we set the data up for a 9-month lag with the S&P. That is, the S&P could give us a much better indication of what printing shipments might be nine months from now.
The June 30 S&P 500 was 919. Using the model that results from our analysis, that gives us a $93 billion shipments figure. That seems high to us based on our other models and our assessment of other matters.
What should concern us is that the S&P dropped earlier this year, and the 9-month lag for that has yet to hit. February's S&P was 735, and that gives us an annualized industry size of $90 billion.
The comparison with the NASDAQ was nearly as good as the S&P, and the 9-month lag provided the strongest statistical relationship as well.
Why might there be a relationship, especially a lagging one? The period in the 1990s where print was leading the S&P might be explained best by the Internet Bubble and the marketing of technology products to deal with Y2K problems. We don't have enough data to determine if the leading relationship was present in other times. The lagging aspect does make sense in today's environment.
Stock prices are based on the expectations of future earnings. Any time those expectations change for the better, prices rise; when they fall, stock prices fall. While there are many other factors, this is the most basic explanation. Therefore, when profits decline, discretionary spending contracts quickly. When profits rise, it takes a while for discretionary spending to be reinstated. One thing we should be aware of: the S&P was heavy with financial stocks, at one time representing a quarter of its total value. We know that financials were big spenders on advertising and promotional materials, and that printers loved having them as customers. That industry will be under internal and external spending scrutiny for some time, and print budgets may not be restored very quickly, if at all.
What's the bottom line in using the stock market to predict printing business shipments? It tells us that things will get a little worse before they get better. According to this model, the worst is not behind us, yet, but some upside is possible in 2010. That is, according to this model; other models we have still show a tough environment ahead.


