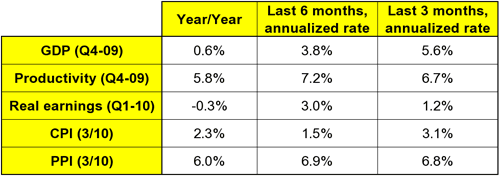
Next Friday (4/30) the first look at GDP for the first quarter will be released. I suspect it will be in the 4% to 5% range, perhaps higher. Yet, the economy does not “feel” strong. We'll review this a bit more in Monday's column, but the chart below shows some of the key indicators that we look at, and they may explain why things feel the way they do.

GDP is always reported as an annualized number, but the news is all about the quarter-to-quarter changed. The fourth quarter of 2009 was less than a percentage point better than the year before, but most recently GDP has been rising. The fourth quarter was quite strong, and almost half of it was for the rebuilding of inventories, so it did not get the big round of applause that one would have expected. I expect that this GDP report will be lower, but that inventory rebuilding will be less of a factor. Keep an eye on that one.
Productivity has been very strong, growing faster than GDP, which is a reason for the sluggishness of getting the unemployment rate to drop. If you can produce more than underlying growth, there's no reason to hire more workers. Real earnings is my real concern. The discontent of the workforce that can result from a long period of increasing productivity without their seeing the reward for their increased output in their paycheck can pose a serious problem for managers and politicians. productivity and earnings do not always move in lockstep, but the longer this disparity continues, the greater the discontent can grow. Increased benefits costs are what usually absorb the extra productivity, but these increases may go elsewhere as businesses look to make up lost ground and restore cut budgets, rebuild cash reserves, and other areas.
There are some economists who say this can only last so long. In reality, it will last until it stops, and it can go on for years. Don't pay attention to anyone who says it can't.
Speaking of not paying attention, if anyone says inflation is under control, there is a great case that they are dead wrong. The producer price index is running just under 7% in recent months. Where does the extra productivity go? Companies see prices of materials rising, and they're getting ready to pay more. If a company is looking at oil prices in the $80s, but they purchased contracts last year at $50, they're looking at a major increase.
Even the prices consumers pay are going up, and are up by an annualized rate of +3.1% so far this year. The PPI is more than twice that. There is a line of thought that inflation at the producer levels will always end up at the consumer stage, that is not always the case. Producers can pay for the increased prices by using the goods they buy more efficiently (productivity) or by cutting other non-production costs (administrative).
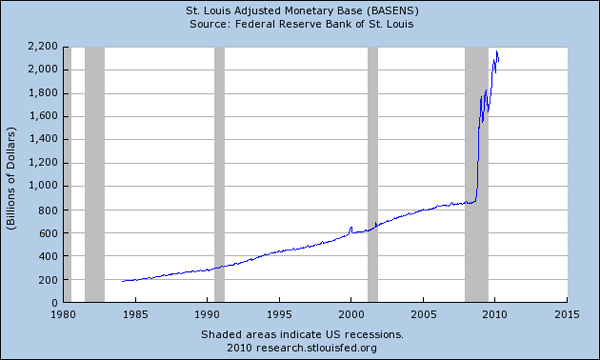
The chart below shows the increasing broad money supply. Shouldn't the economy be overheating by now? Nope. A lot of the money is still propping up bank balance sheets, making them look healthier than they really are.

The economy is more tenuous than some of the broad economic data appear. It is getting better, but proceed with caution.
On Monday, I will address the issues of how print is affected by the economic upturn and some matters about capital investment in the industry. That is, unless other news or desires take precedence. See you then.


