There has long been speculation among business owners and their advisors over how to place a value on privately held companies. Now, newly developed business valuation models which replicate historical buyer experience sheds some light on the topic and provides some very interesting insights into value creation opportunities for current business owners and potential buyers. Historical benchmarking data in the Commercial Print Industry indicates that while some savvy business owners are already starting to demonstrate progress in moving up the value curve, there is still significant upside in the future without requiring acquisition or other unscheduled investment. If you are a potential seller, this provides some perspective on ways to fix up the business before entering into a sale process and if you are buyer it illustrates a classic way to buy low and sell high without pouring more money into the investment to make it happen. It takes good advice, dedicated effort and time (perhaps 2-3 years) to achieve the desired result, but the investment in operating processes and other characteristics of the business can be self-funded if you have a company generating at least $2 Million in annual revenue at average industry margins.
Over the last two years, economists have estimated that the Commercial Print and Advertising Industry has gone down by about 8.6% (~$7.3 Billion); mostly in the private sector. At the same time, the number of establishments has decreased by 2.3% (~641). However, for the survivors, the average operating margin has increased almost 93% and the operating profit per establishment (the only real thing an owner should care about) has increased over 80%. Based on recently developed valuation models for lower middle market privately held manufacturing companies, and Wall Street valuations for their publically held counterparts, this represents an increase in value for the entire industry of $3.6 Billion! So, not only is consolidation happening, it is making the industry financially stronger and more valuable despite it getting smaller. Even more interesting is that while industry consolidation is expected to continue, there are ways for existing owners to leverage what they have and create even more value without the need for further M&A investment and consolidation to accomplish it. The summary of recent industry changes is illustrated in the table below.
Figure 1: Operating Impact on Value in the Commercial Print Industry (NAICS 323)
|
Item |
2011 |
2013 |
Amt Change |
% Change |
|
Establishments1 |
27,913 |
27,272 |
(641) |
-2.3% |
|
Revenue ($ Mil)2 |
85,000 |
77,670 |
(7,330) |
-8.6% |
|
Avg Rev/Establishment ($Mil) |
3.05 |
2.85 |
(0.20) |
-6.5% |
|
Ave OP Margin3 |
1.4% |
2.7% |
1.3% |
92.9% |
|
Operating Profit ($Mil) |
1,190 |
2,097 |
907 |
76.2% |
|
Avg OP/ Establishment ($K) |
42.6 |
76.9 |
34.3 |
80.4% |
|
Avg Multiple for all Companies4 |
4.0 |
4.0 |
||
|
Value per Establishment ($K) |
171.9 |
310.1 |
138.2 |
80.4% |
|
Industry Value ($Mil) |
4,799 |
8,456 |
3,658 |
76.2% |
Sources:
1. Bureau of Labor Statistics: Country Business Patterns, 3/6/2014 WhatTheyThink?
2. WTT and NAPL Economics and Research Centers
3. PIA 3013 Commercial & Advertising Print Ratio Study: Lessons from Industry Profit Leaders
4.” Built to Sell” Valuation Model for private and current avg public company multiples
(2013 multiples used for 2011 to normalize the effects of market conditions.)
We have just completed a study on business value creation in the Commercial Print space over the last two years based on industry benchmarks, government data and appropriate business valuation models. Valuation sensitivities show that the Commercial Print sector, as an investment space has not even come close to its real value potential and there are opportunities for another $32 Billion to be generated. This represents almost 5X increase over the level achieved in 2013! That kind of potential makes this space a very lucrative, value enhancement opportunity for a sophisticated seller and an attractive investment for an opportunistic buyer.
Of course, each of these databases and models are dependent on consistent and critical assumptions to allow them to connect and make sense on a coherent basis. But sensitivity analysis applied to these models identifies key areas that have not been identified and quantified for consideration by existing lower middle market private business owners to date.
The results of the valuation sensitivity assessment are summarized in the table below:
Figure 2: Private Company Value in the Commercial Print Industry (NAICS 323)
|
Item |
2011 |
2013 |
Amt Change |
% Change |
|
Establishments1 |
27,913 |
27,272 |
(641) |
-2.3% |
|
Market Revenue ($ Mil)2 |
85,000 |
77,670 |
(7,330) |
-8.6% |
|
Privately Owned Component ($Mil) |
60,000 |
53,106 |
(6,894) |
-11.5% |
|
Industry Average |
||||
|
OP Margin3 |
1.4% |
2.7% |
1.3% |
92.9% |
|
Est Operating Profit ($Mil) |
840 |
1,434 |
594 |
70.7% |
|
Value Multiple4 |
3.1 |
3.1 |
||
|
Value ($Mil) |
2,636 |
4,499 |
1,863 |
70.7% |
|
Profit Leaders |
||||
|
OP Margin3 |
9.5% |
9.9% |
0.4% |
4.2% |
|
Est Operating Profit ($Mil) |
5,700 |
5,258 |
(442) |
-7.8% |
|
Value Multiple4 |
3.2 |
3.2 |
||
|
Value ($Mil) |
18,156 |
16,746 |
(1,409) |
-7.8% |
|
Improvement Factor |
6.9 |
3.7 |
(3) |
-46.0% |
|
Value Leaders |
||||
|
OP Margin3 |
9.5% |
9.9% |
0.4% |
4.2% |
|
Est Operating Profit ($Mil) |
5,700 |
5,258 |
(442) |
-7.8% |
|
Value Multiple4 |
5.00 |
5.00 |
||
|
Value ($Mil) |
28,508 |
26,295 |
(2,213) |
-7.8% |
|
Net Difference ($Mil) |
25,872 |
21,796 |
(4,077) |
-15.8% |
|
Net Improvement Factor |
10.82 |
5.84 |
(5) |
-46.0% |
|
Improvement/Establishment ($$K) |
926.89 |
799.20 |
(128) |
-13.8% |
Sources:
1. Bureau of Labor Statistics: Country Business Patterns, 3/6/2014 WhatTheyThink?
2. WTT and NAPL Economics and Research Centers
3. PIA 3013 Commercial & Advertising Print Ratio Study: Lessons from Industry Profit Leaders
4.” Built to Sell” Valuation Model by John Warrillow
(2013 multiples used for 2011 to neutralize the effects of market conditions.)
One of the conclusions from the study is that while value is improving in each category over the last two years due to increase in operating margin, the real opportunity for an owner is to move up the value chain from one value category to another.
In many ways the process of moving from one level of Business Value to another is like the movement of several different vehicles each having its own medium to navigate through, environmental conditions to deal with and speed it can accomplish. The figure below provides a characterization of the magnitude of four different levels of business value for a company starting at the bottom of the hierarchy:
Figure 3: Relative Differences Between
Privately Held Companies with Various Levels
Of Value Achievement
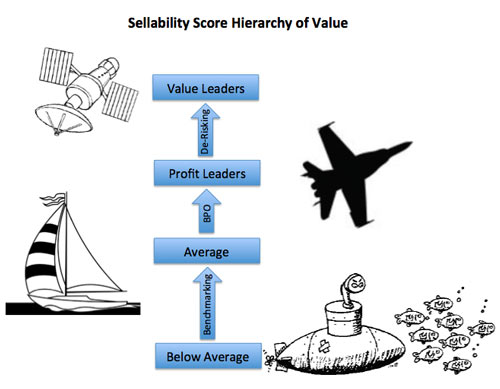
A Below Average Company: Essentially a company under water. Not unlike a submarine. It is still alive and able to navigate from one position to another but it has limited visibility and its speed is impacted by all the fluid around it. It shares its environment with other submerged species who thrive in this space. The vehicle is not particularly efficient in getting from one point to another and has to come up for air occasionally to survive.
An Average Company: Its above water, can move without a great deal of effort from one position to another by adjusting the sails but requires tacking to get to its desired location due to external elements that influence it like wind speed and direction. The craft requires a knowledgeable captain to instruct a crew on what to do but pretty much has to go with the flow as efficiently as possible.
A Profit Leader: Is a company who knows where its going, can get there quickly, has a highly trained pilot and is a product of considerable design, investment and support. There are sophisticated, guidance systems that help with visibility, navigation and maneuvering through difficult competitive environments.
A Value Leader: Essentially a company that operates in the stratosphere. Its pilot is not a single person but a team of experts that communicate with the vehicle effectively through instruments as it travels at incredible speeds in its well defined orbit. It has all the gadgets to monitor critical performance indicators important to diagnosing problems before they become major issues.
Moving up the Chain
So how does an owner move up the value scale from being an average company, to a Profit Leader, to a Value Leader? How long does it take and what kind of Investment is involved?
Step 1: Getting to average performance. A company operating at below average margins or under water typically has something fundamentally wrong with product cost, product quality/service, leadership (management), pricing and/or service offerings. In many ways, getting to an average performance level requires an understanding of what is wrong (The What) and how to deal with it (The How). Doing the “Right things” and doing “Things right” is key to getting above water and starting to become more efficient. Benchmarking the details of the under-performing company against other, like businesses, often provides some clues as to where to prioritize the attention, but doing things right often requires a fresh perspective, industry experience and often the organization’s willingness to change, especially if it means change of company culture. When something is fundamentally wrong, continuing to do it the same way is a sure path to a company fire-sale. In the long run, the issue becomes the owner’s willingness to change in order to survive versus sinking deeper under water as competitive pressures increase. Recent data presented in the annual ratio studies by NAPL provides good perspective on the financial performance of 248 industry participants. The data is segmented into comparisons of average industry performers and high profit performers across a broad segment sizes and can be quite helpful in identifying areas business owners can explore for improvement.
Step 2. Going from an average company to a Profit Leader. In general, there are four major factors that contribute to achieving margins in the top quartile of the industry:
- Customer value based pricing
- Optimizing product and customer mix
- Constant Cost Reduction
- Business Process Optimization.
Many owners consider the first three as a matter of course in managing their businesses but often are not aware of the value re-engineering administrative and production processes can have on quality, cycle time and efficiency of the business. Management, customers and products change but processes haven’t always evolved in an efficient way. There are significant gains that come from improving under-performing functions and assets as well as efficiencies in doing both the right things and doing things right.
The figure below illustrates the kinds of improvement that a good Business Process Optimization effort can produce over a two-year period. Customer value based pricing, optimizing product and customer mix, constant cost reduction and business process optimization is the gateway to running a tight ship and profit leadership.
Figure 4: Improvements Available Through Business Process Optimization
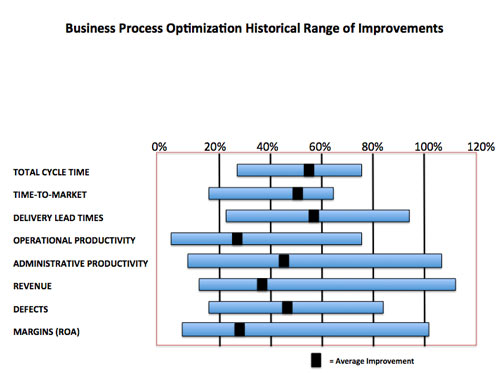
Source: R2D3 BP Opt experience
Step 3: Becoming a Value Leader. The last step in the value enhancement process for an owner is focusing on those things that impact the value in the eyes of a potential buyer. Yes size and profitability are important but there are other factors that need to be considered as well. (Usually done during due diligence.) Buying a home is an emotional experience but buying a business is an investment decision. Here the focus is not only on size, margin and efficiency, but on the risks involved in creating a stream of profits that can be counted on to generate the return for what is invested. Investors have lots of options for where to invest their money and the money is going to go to the places that provide the best return for the least risk.
There are a number of simple ways to characterize value for a business: multiples of: Sales, Pre-Tax Operating Profit, Cash Flow, Earnings Before Interest, Taxes, Depreciation and Amortization (EBITDA) or Seller’s Discretionary Earnings. (All of which can be adjusted for particular nuances of how the owner is managing the financial statements.) For purposes of this discussion we will focus on a multiple of Pre-Tax Operating Income.
Reducing the risks involved with generating a future stream of profits for a company is what gives rise to valuation multiples for lower middle market privately held companies and take a Profit Leader from a valuation that is a 3X multiple of operating income to a Value Leader with a 5X multiple.
Most investment models consider at least eight areas that contribute to becoming a Value Leader. Each has a number of additional dimensions and levels that give it character and better definition. The chart below shows the sensitivity of one valuation model developed by John Warrillow author of “Built to Sell” specifically focused on the manufacturing industry. This model is based on input from over 835 privately held business owners who have received offers for their companies in the last 18 months. There are even more sophisticated models that have been built by others using other underlying metrics such as free cash flow and EBITDA but they all consider the risks of a private company investment as a key component in one form or another. The value model used in this study includes variability around 25 different components contained in the first eight major categories below. (The complete analysis is available as an appendix.)
Figure 5: Sample Value Generating Elements for Privately Held Companies
|
No. |
Category |
Avg. Company |
Profit Leader |
Value Leader |
|
1. |
Financial Performance |
Annual Sales & OP Margins @ 1.5-3.5% |
Annual Sales & OP Margins > 9% |
Annual Sales & OP Margins > 9% |
|
2. |
Growth & Scalability |
Grow at GDP |
Grow at GDP |
Grow Faster than GDP |
|
3. |
Concentration Issues |
16-25% Rev from Largest Customer |
16-25% Rev from Largest Customer |
<15% Rev from Largest Customer |
|
4. |
Asset Management |
Excess Cash can support Growth |
Excess Cash can support Growth |
Can Pay regular dividends and still Grow |
|
5. |
Recurring Revenue |
26-50% of Revenue |
26-50% of Revenue |
>50% of Revenue |
|
6. |
Competitive Barriers |
Customized Products with some competition |
Customized Products with some competition |
Unique Offerings with competitors hard to find |
|
7. |
Customer Satisfaction |
>75% very satisfied |
>75% very satisfied |
100% Referral Rate |
|
8. |
Management Team |
Business would suffer a lot w/o owner for 3 months |
Business would suffer a lot w/o owner for 3 months |
Team in place with long term incentives. Minimal setback if owner out for 3 months |
|
9. |
Efficiency |
$155K Annual Rev/Employee |
$171K Annual Rev/Employee |
$171K Annual Rev/Employee |
|
10. |
Valuation Multiple |
2.5 - 3.7X OP |
2.7 – 3.8X OP |
5X OP |
It is interesting to note that in the Commercial Print Space, the average multiple for the top seven publically traded companies is 6X Operating Income. This investment premium over private companies operating in the same space is often attributed to the value associated with size and liquidity that an investor has with them since there is easy access to other buyers if desired. (Note the public markets account for relative risk, margin, growth and size in the market’s assessment of individual stock price.)
Most business owners need to understand the existence of a “valuation gap” that often exists between buyer and seller. This difference is almost always because of the difference in emotion and perspective tied to both parties. The seller often looks at what he has put into the business and the buyer looks at what he can get out of it compared to other investment opportunities. If an owner does a good job at focusing business performance on providing maximum financial return, when the time comes for a transfer, he will be rewarded with a transaction that is not only higher value, but one that is more likely to close.
The charts below describe the impact this value creation process can have on privately held companies of various sizes given data from the industry sources referenced above. Note that while valuation multiples are fairly constant across the lower middle market between average and higher profit companies, and are independent of company size, actual valuations increase dramatically almost all due to margin improvement.
Figure 6:
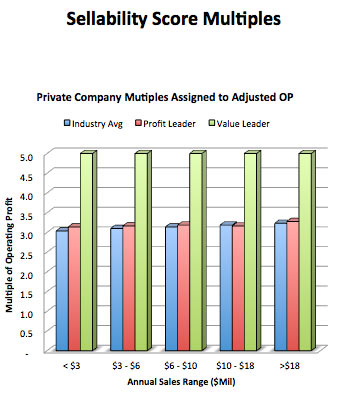
Figure 7:
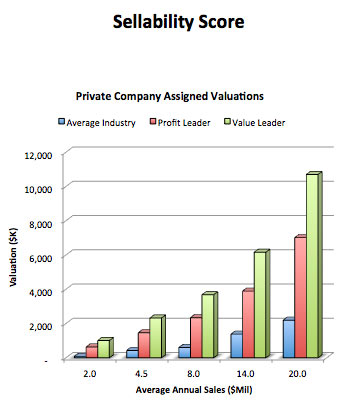
Figure 8: Valuation Multiple Relationship
Operating Margin Vs Risk
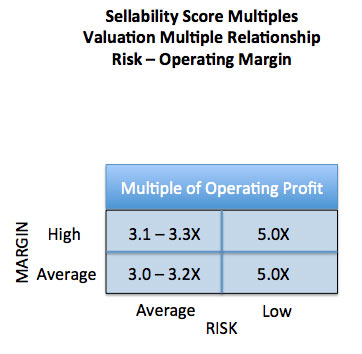
The valuation model used in this study shows how much multiples offered by buyers over the last 18 months are more a function of investment risk than any other factor. The adjacent figure illustrates how buyers value risk over margin. When compared to the charts, a company with the same margin but low risk is worth about the same as a company about twice its size with average risk.
Conclusion
So what’s important to maximizing value? The old adage that in real estate there are only three things that really matter; Location, Location, Location is simple and easy to understand. Of course, there are other factors that influence a buyer such as size, curb appeal and improvements. But with a manufacturing business, what’s important to a Financial Buyer is Size, Growth, Cash Flow and Risk. If you are seller, nobody is going to pay for what you put into the business they will only pay for the value they perceive they can get out of it. Even most strategic buyers have their own unique reasons for how value can be assigned and is often related to either the growth or cost synergies that can be extracted from the acquired business as it is integrated into the owner’s existing operation. Strategic buyers may or may not share some of those synergies with the seller in the form of an increase purchase price.
The good news is that based on the application of benchmarking and investment modeling for lower middle market companies in the commercial print space there is significant opportunity for owners to increase the value of their companies. If you haven’t undergone a business process re-engineering evaluation effort recently it might be time see what can be gained by getting some help in this area. There are also a number of M&A professionals that can help you understand all the investment risks associated with your business today and how to minimize them in the future.
Business Process optimization and “de-risking” the business are just two areas needed to move the business up the value chain from an average company to a profit leader and ultimately to a value leader. Conventional sports wisdom states that offense wins games but defense wins championships. In business; when it come time to sell, profit leadership will get you a good price but a business with minimum risk will capture the ultimate premium. Doing both is a grand slam!


Discussion
By Mark Hahn on May 23, 2014
Gary, thanks for posting this article - great review of valuation drivers for private printing companies.
Readers of this article may find Warrillow's "Sellability Score" interesting, which includes his "Scalability Trifecta" based on:
1) Is your business teachable to employees?
2) Is your service valuable to customers?
3) Is the revenue repeatable - is there a recurring revenue stream?
Best regards,
Mark Hahn
By Les Csonge on May 23, 2014
Fanatstic and extremely insightful and useful article, the infographics are great, especilaly like Figure 3 - would add that much of this applies to many comnpanies, not just Print.
Discussion
Join the discussion Sign In or Become a Member, doing so is simple and free