This month’s research summary is a continuation from last month’s introduction to Minding the Gap: Evaluating the Image Quality of Digital Print Technologies Relative to Traditional Offset Lithography (PICRM-2008-08), by Susan Farnand, Staff Scientist at the Carlson Center for Imaging Science at RIT.
By Susan Farnand
As discussed last month, the goal of this research was to examine the current gap in image quality between high-end digital printers and offset lithography and to develop an idea of how important or relevant this image quality difference is to the end user through the use of psychophysical experiments. An investigation into image quality parameters that are particularly relevant in comparing print systems technologies was also conducted.
For more information on the methodology and background of the research, please read Part A of this summary.
Results & Discussion
In the summary of his paper on measuring digital image quality, Swanson (2000) states that "the consumers of digital imaging output are as varied as their definition of image quality." It seems a comfortable extrapolation to include all printed output in this statement. This is one of the reasons that participants with varied backgrounds were sought out for this experimentation. The results would indicate that this effort was successful, as opinions on the quality of given prints varied widely. Standard deviations on the responses to the digitally produced prints ranged from about 9¢ for one of the Village Sports mailers on coated paper to over 44¢ for one of the China photo pages on uncoated paper. The difference in responses for a single print ranged from 50¢ for a Village Sports mailer on coated stock, for which the pickiest participant assigned a value of 70¢ and the most delighted participant felt it was worth $1.20, to a $2.30 difference for one of the “Sarah” photo pages on uncoated media, for which one disgusted participant offered 20¢ and another impressed participant assigned a value of $2.50.
The correlation coefficients of the individual responses with the mean response for each of the comparison prints averaged approximately 0.6 and varied from approximately 0.24 to 0.8. Interestingly, the three participants who reported color vision anomalies all had correlation coefficients that were higher than the average of 0.64, 0.68, and 0.68.
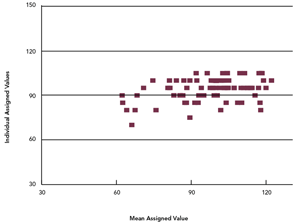
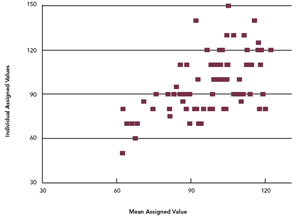
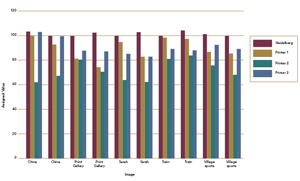
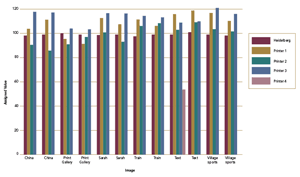
Most of the participants having lower correlation coefficients tended to either have relatively flat responses – they tended to assign values around $1.00 for all of the comparison prints as shown in Figure 1 – or they had one or two responses that did not fit in well with the majority of their responses, as shown in Figure 2. In the case of the participant having the lowest correlation coefficient (and for a few other participants), both of these things occurred. However, removing participants whose responses correlated poorly with the mean responses or the few outliers had little impact on the results. Therefore, all of the results were retained in the analysis.
Figure 1. Data for a participant who exhibited a relatively flat response
click to view image full size
Figure 2. Data for a participant who exhibited a few outlier responses
click to view image full size
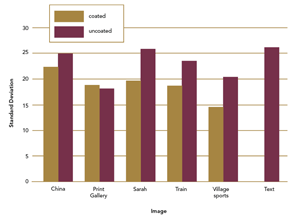
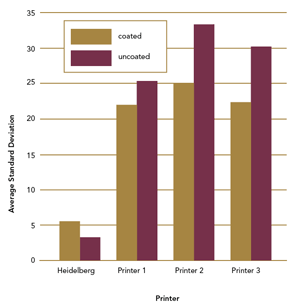
Figure 3 shows that the uncoated media had higher variability than the coated media for the train brochure, the Village Sports mailer, and the “Sarah” photo book page. For the remaining images, the variability is essentially the same between the coated and uncoated media sets. Figure 4 shows the variability by printer. Variability is highest for Printers 2 and 3 on uncoated media.
Figure 3. Standard deviation values for each of the image sets on coated and uncoated media averaged over all images
click to view image full size
Figure 4. Standard deviation values for each of the image sets on coated and uncoated media averaged over all the printers
click to view image full size
The exact reason why the assigned values had increased variability on uncoated stock is uncertain. However, the differences between the reference and comparison prints were more apparent for the prints on uncoated media than those on the coated media, just as the prints on the digital prints had much greater differences than those made on the Heidelberg Speedmaster. As the difference from the reference increased, so did the variability in how the participants valued those prints; some thought the differences were inconsequential, some found they added to the value, and others occasionally felt the differences rendered the prints worthless.
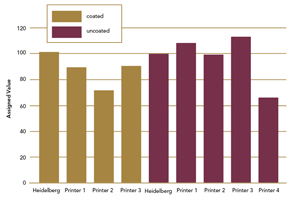
Further investigation reveals other interesting differences between the coated and uncoated media sets. For the coated media, the offset prints are consistently rated higher than the digital prints for all images, as shown in Figure 5. Only the “China” images from Printer 3 and the “Train” images from Printer 1 are rated approximately the same as the offset reference for coated media. However, for the uncoated media, prints produced on the high-end digital printers often rated higher than the offset prints on average, as shown in Figure 6. Many of the prints made on Printers 1 and 3 were rated at a higher value than the offset reference. The train brochure, the Village Sports mailer, and the photo book pages show this shift to higher perceived quality for digital printers 1 and 3. Figure 7 shows the comparison of the coated and uncoated media by printer averaged over all of the image sets.
Figure 5. Average assigned value for each media on coated paper, shown by printer
click to view image full size
Figure 6. Average assigned value for each media on uncoated paper, shown by printer
click to view image full size
Figure 7. Mean assigned values for the images on coated versus uncoated media for each printing device
click to view image full size
Given the high variability of the participants’ responses, it would be reasonable to ask whether or not any of the differences exhibited in Figures 5 and 6 are significant. For the coated images, a difference of about 14¢ would be needed to be significant at a 95% confidence level. With this requirement, all of the prints made on Printer 2, the Print Gallery, Village Sports, and one of the “Sarah” prints made on Printer 1, and the “Sarah” prints made on Printer 3, are significantly worse than those made on the Speedmaster.
For the uncoated images, a difference of about 18¢ would be needed to be significant at a 95% confidence level. With this requirement, the photo book pages and Village Sports brochures made on Printer 3 and the text images and one of the Village Sports brochures made on Printer 1 were all rated of significantly higher value than the prints made on the Speedmaster. The single text print made on a desktop printer was not considered to be of comparable quality level as the prints made on the offset press or the high-end digital printers.
It is interesting to note that there were two instances where one of the two prints of an image on a given media made on Printer 1 was significantly different and the other one was not. Further investigation revealed that Printers 1 and 2 showed more variation between the two prints of a given image on a given media within the run (about 5¢ on average) than did either Printer 3 or the offset press, which showed an average within-run difference of about 2¢. While the levels of variation were too small to be statistically significant (although the “Sarah” photo page on coated media for Printer 1 had a difference between the mean responses for the two prints of 12¢ and was close to being significant), the run lengths were relatively short. The increased variation for two of the digital printers may signal that within-run variability is an important factor to monitor.
The data indicate that statistically significant differences between prints made on digital equipment and those made on an offset press existed in this experiment. What factors led to these perceived differences in print quality? The comments made by the participants as they made their assessments are instructive.
The three most common comments dealt with uniformity, including things like grain, banding, and smooth gradations; contrast; and text and line quality, especially when regarding arcs and white text. Lack of uniformity was the most common complaint for the prints made using digital equipment, with concerns regarding text and line quality ranking second. However, many participants preferred the higher contrast of the digital printer output, especially for the photo book pages and marketing material on the uncoated media. Although there were few comments specific to gloss, it seems reasonable to posit that the higher gloss appearance of the prints created on the digital equipment added to the perception of higher value on the uncoated media. Certainly, the higher gloss added to the higher contrast and the higher color saturation of these prints, which was appealing to many participants.
In their work on digital and offset print quality, Chung and Rees (2006) report that the problems with offset printing relate to issues with the materials used while the problems with digital printers relate to the technology and lack of standards making the “use of formal quality assurance procedures difficult.” The results of this survey seem to support this conclusion. The main problem with the offset prints seemed to relate to the uncoated media used. The prints on this media generated by the offset press used in this research were lower in contrast and gloss, giving them a flat, dull appearance. Conversely, the digital prints had problems with uniformity and, to a lesser extent, text and line quality, that were the result of technical constraints and limitations.
Conclusions
It is important to remember that prints were made on only one offset press and only one machine for each of three different high-end digital printer vendors. Different results may be obtained using different equipment, even if it is from the same vendor and has the same model number. Different results could be obtained on this same equipment run by different people or on different days. Therefore, drawing conclusions from this work must be done with some caution. In all actuality, the best that can be hoped for is a better understanding of existing trends.
For this set of participants with this set of images, it was found that the offset press produced prints on coated paper that had comparable or higher perceived value for all of the images tested. On uncoated paper, the story was somewhat different. On uncoated media, some of the prints from two of the digital printers—especially those of the photo book pages and marketing materials—were found to be of higher value. Participants generally liked the uniformity and high quality lines and text of the offset prints, while they tended to prefer the higher contrast of the digital prints—at least for some applications—on the uncoated paper. These results are in general agreement with Chung and Rees’ (2006a) findings that offset printing image quality issues tend to be related to materials problems, while image quality issues for digital printing equipment tend to involve technical limitations of the equipment.
References
Chung, R., & Rees, M. (2006). A survey of digital and offset print quality issues (PICRM-2006-04). Rochester, NY: Printing Industry Center at RIT.
Swanson, T. W. (2000). Digital image quality: What is it and how is it measured? IS&T’s Eleventh International Symposium on Photofinishing Technologies: Vol. 11 (pp. 11-13). Springfield, VA: The Society for Imaging Science & Technology.
2007-2008 Research Monographs:
To read about this research in detail, download the monograph from: http://print.rit.edu/pubs/picrm200803.pdf
This article from the Printing Industry Center at RIT was originally published in the Centers affiliate-only eReview newsletter. Article Series Index.

